Spring Service: Improving Processing Time Could Harm Service Scalability
Learn more about improving processing speed in your Spring service.
Join the DZone community and get the full member experience.
Join For Free
Improving processing time by running tasks in parallel became very easy in the latest versions of Java and Spring. Must we understand the threads' usage behind the syntactic sugar? Read on to find out.
You may also like: Get the Most Out of the Java Thread Pool
Let's Start With the Code
Below is a simple controller of service (I will name it users service) that gets the input userId and returns the user object: id, name, and phoneNumber:
    @GetMapping(value = "/users/{userId}")
    public User getUsers(@PathVariable String userId) {
        logger.info("Getting the user object of: " + userId);
        String name = getName(userId);
        String phoneNumber = getPhoneNumber(userId);
        return new User(userId, name, phoneNumber);
    }

    private String getName(String userId) {
        logger.info("Calling metadata service to get the name of user: " + userId);
        String url = "http://localhost:8090/metadata/names/" + userId;
        return restTemplate.getForObject(url, String.class);
    }

    private String getPhoneNumber(String userId) {
        logger.info("Calling metadata service to get the phone number of user: " + userId);
        String url = "http://localhost:8090/metadata/phoneNumbers/" + userId;
        return restTemplate.getForObject(url, String.class);
    }
[The full project can be found here. The service is a Spring Boot application with embedded Tomcat. Having this kind of service running can be done in less than 5 minutes.]
As you can see, to get the user name and phone number, I need to use a different service (called the metadata service), which is a common scenario. Response time of GET / and metadata/names/{userId}GET / is around 300 milliseconds each and that's given. Our focus is the response time (and improvement) of metadata/phoneNumbers/{userId}GET users/{userId}. Names and phone numbers are randomly generated.
Running the GET request http://localhost:8888/users/2505 via Postman, I get a response in 661 milliseconds. This makes sense because we know getting the user name takes around 300 ms and getting the user phone number also takes around 300 ms, and we do it sequentially:
17:49:19.432 [nio-8888-exec-3]: Getting the user object of: 2505
17:49:19.433 [nio-8888-exec-3]: Calling metadata service to get the name of user: 2505
17:49:19.783 [nio-8888-exec-3]: Calling metadata service to get the phone number of user: 2505
We can see all parts are executed by a Tomcat worker thread.
Improve Processing Time
Both requests, getting the name and phoneNumber, require only the userid as the input, so none of each depends on the other. Why not run both in parallel and see if it improves response time?
There are a few ways to do that. CompletableFuture is very tempting because of its simplicity. It was introduced in Java 8 as a concurrency API improvement. CompletableFuture.supplyAsync together with lambda expressions looks almost like magic (see new code below). The changes are minor, only lines 4-8:
    @GetMapping(value = "/users_parallel/{userId}")
    public User getUsers(@PathVariable String userId) throws ExecutionException, InterruptedException {
        logger.info("Getting user object of: " + userId);
        CompletableFuture<String> name = CompletableFuture
                .supplyAsync(()-> getName(userId));
        CompletableFuture<String> phoneNumber = CompletableFuture
                .supplyAsync(()-> getPhoneNumber(userId));
        return new User(userId, name.get(), phoneNumber.get());
    }
Now, running the GET request http://localhost:8888/users_parallel/2505 via Postman, I get a response in 347 milliseconds. This is an improvement of almost 50 percent in response time. Voilà. Should we open the champagne? Well, wait a minute...
We need to test the performance of our service when servicing more than one client in parallel, which is more similar to production. This is usually what we aim for — more requests mean more activity. I will start with a basic test of 20 requests per second. You can assume that the metadata service is not a bottleneck.
Remember that our focus is on APIs /users and /users_parallel.
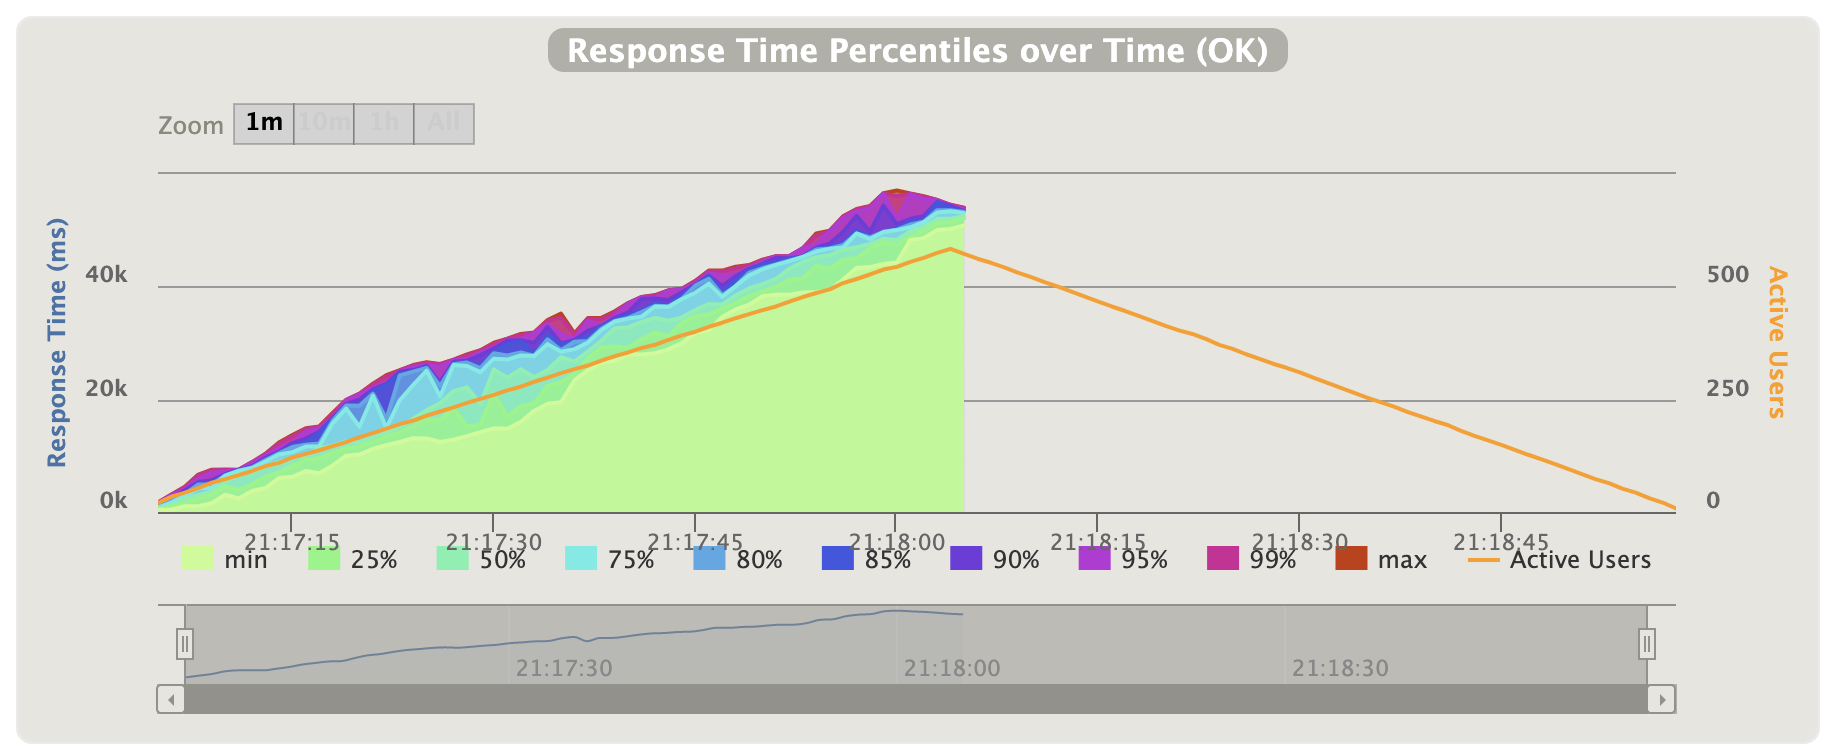
For simulating client requests, I am using Gatling, an open-source framework written in Scala. Execution definition in Gatling is called "simulation." Writing simulation is pretty easy. See here for my "20 requests per second during 60 seconds" simulation. Below are the results. The orange line is the number of active users/requests, which abusively decreases after 60 seconds.


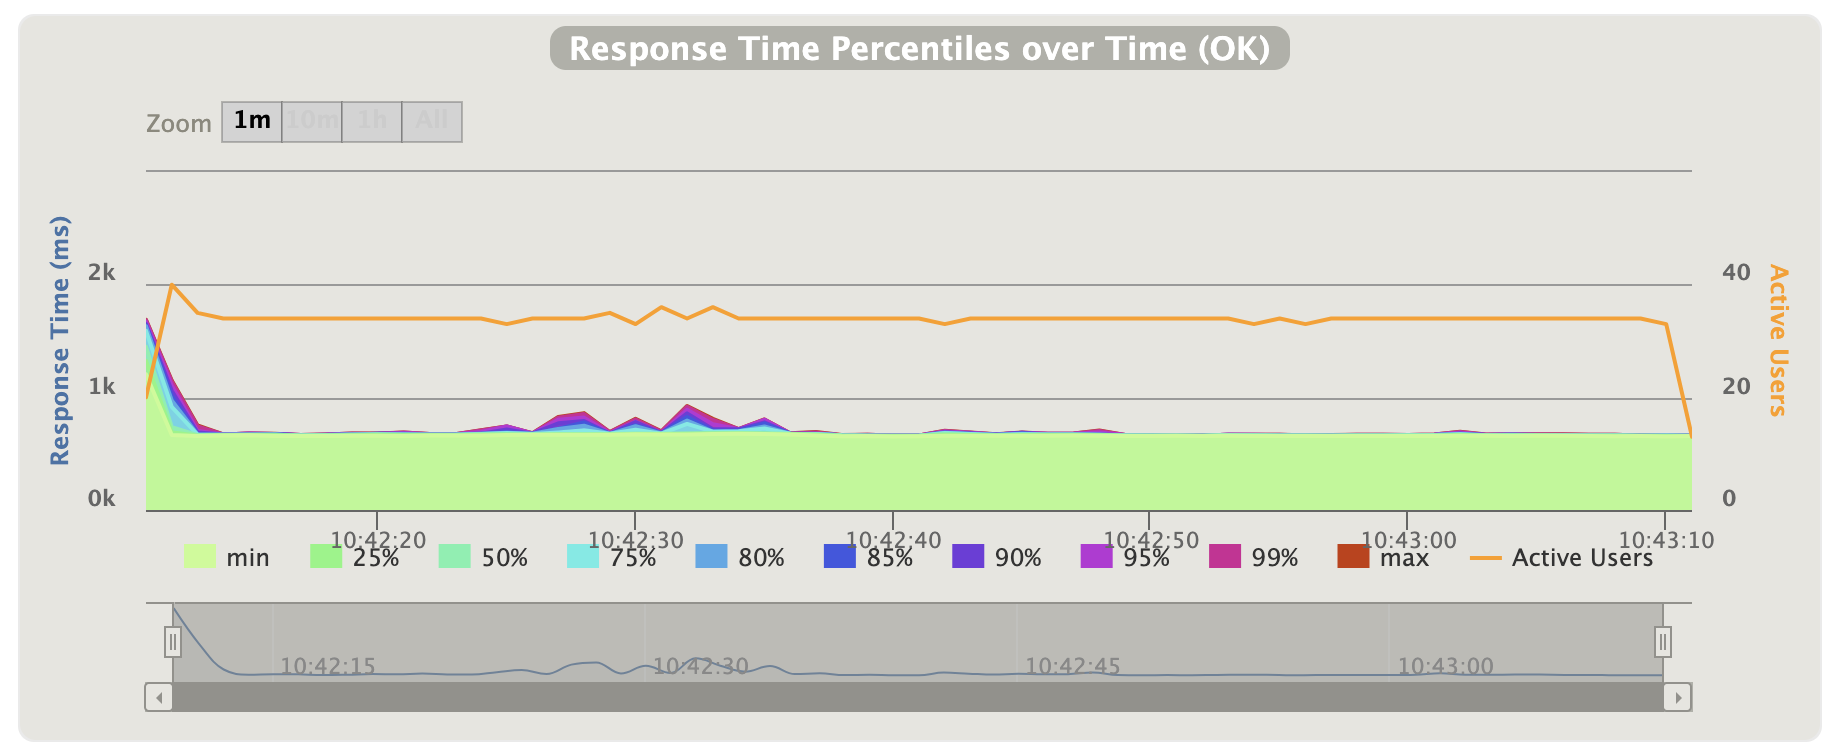
The graph describes the response time over time. We definitely can see the response time increases over time. The average is 27289 ms and the 95-percentile response time is 51370 ms. By monitoring the service, with VisualVM, I didn't see issues related to CPU or memory. For comparison, let's run the same test (20 requests per second) against the sequential implementation /users. These are the results:

Put back the champagne to the cellar. We see that before our "improvement," the 95-percentile was dramatically lower — 709 ms. That actually makes sense when comparing to the processing time we observed at the beginning — each call to the metadata service takes around 300 ms. So what went wrong?
Identify Bottlenecks
Let's go back to the parallel execution and try to understand the bottleneck. Theses are the execution logs when running one request:
10:14:53.886  [nio-8888-exec-1] : Got request: 2505
10:14:53.887  [onPool-worker-7] : Calling metadata service to get the name of user: 2505
10:14:53.887  [onPool-worker-1] : Calling metadata service to get the phone number of user: 2505
We can see that calling the metadata service is not done by the Tomcat worker threads (named nio-X-exec-Y) but by the ForkJoinPool.commonPool() threads, which is the default thread pool of CompletableFuture.
When it comes to threads, I usually chase bottlenecks by logging some kind of request-id during the different threads' processing parts (start/end of each thread). So I will add it to the logs and run again (for simplicity, in the existing logs, I will concatenate UUID to the user id). Running the simulation again and filtering the logs by just one of the request ids (2505_e6a1f189-ee48-4742-8b2d-f506dcbeb599), this is what I see:
21:11:24.553  INFO [o-8888-exec-164] : Got request: 2505_e6a1f189-ee48-4742-8b2d-f506dcbeb599
21:11:39.221  INFO [onPool-worker-1] : Calling metadata service to get the name of user: 2505_e6a1f189-ee48-4742-8b2d-f506dcbeb599
21:11:39.304  INFO [onPool-worker-7] : Calling metadata service to get the phone number of user: 2505_e6a1f189-ee48-4742-8b2d-f506dcbeb599
Although the Tomcat thread started executing the request on 21:11:24, ForkJoinPool thread calls the metadata service only at 21:11:39, meaning we waited 15 seconds to have a thread available to call the metadata. It seems like the bottleneck is ForkJoinPool.commonPool(). Our Tomcat threads (by default, there are 200) are blocked by ForkJoinPool.commonPool(), which only have 8 threads (as the number of my processors). From the ForkJoinPool documentation:
"For applications that require separate or custom pools, a ForkJoinPool may be constructed with a given target parallelism level; by default, equal to the number of available processors."
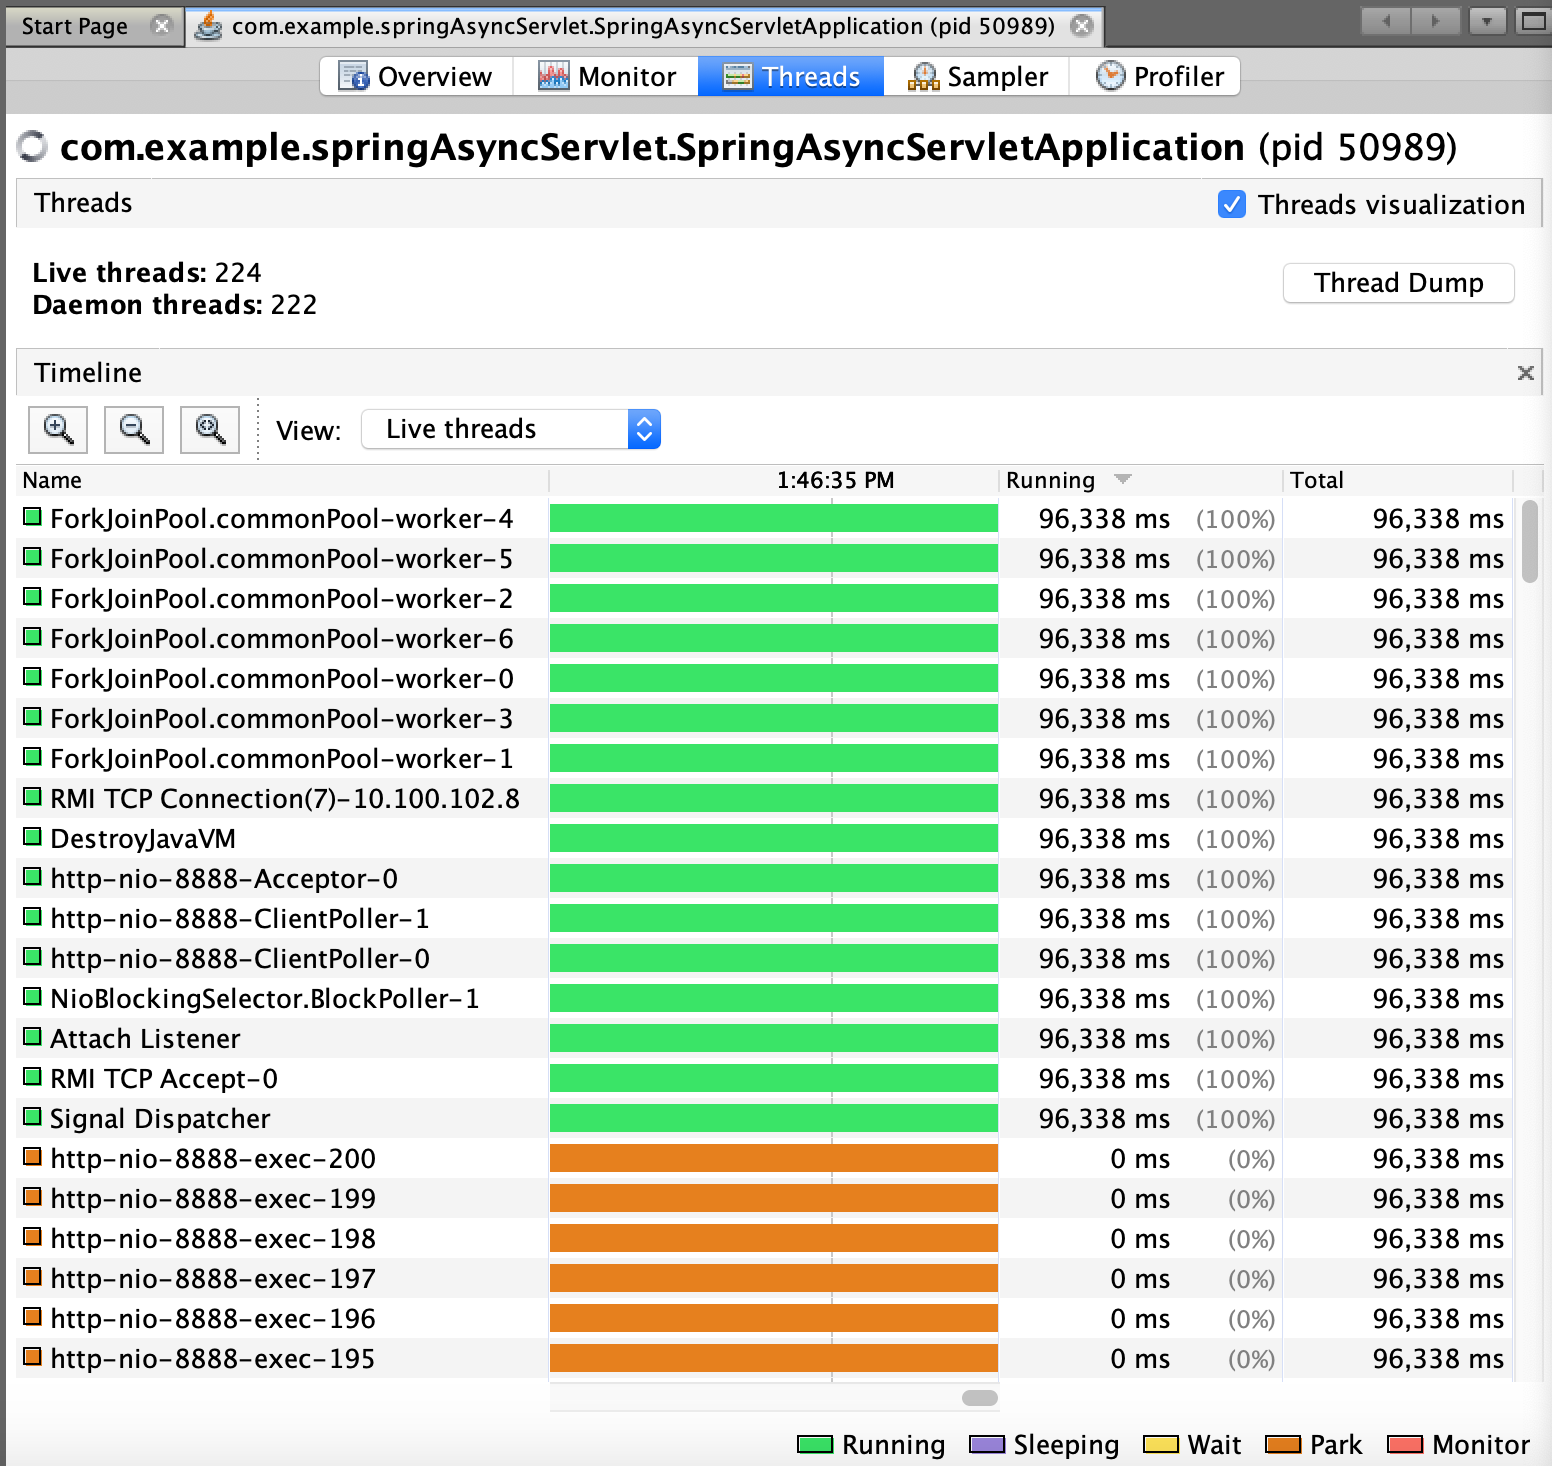
Also, monitoring the threads using VisualVM, I always see 7 "Running" worker threads of that ForkJoinPool (I have noticed one is missing — didn't figure out why yet — feel free to comment):

The Tomcat threads are usually in the "Park" state. This state is triggered when calling LockSupport.park, which is part of the implementation of CompletableFuture.get. In our case, we use it when a Tomcat thread waits for a ForkJoinPoolthread to complete (see name.get() andphoneNumber.get() in getUsersParallel). If most of the time the 200 Tomcat threads are blocked by those 7 threads, we actually can set the number of Tomcat threads to 8 and get the same results. Adding the line below to application.properties, we get:
server.tomcat.max-threads=8Running the same simulation against /users_parallel, I get a slightly better result comparing to the preview parallel simulation. The average response time of 26524 ms and 95-percentile of 49066 ms. This is probably due to less context switch.
So, we actually get better results when using fewer threads.
Optional Solution
We know that each Tomcat thread (there are 200) needs to have 2 threads available (because we want to get the name and phone number in parallel) to not be blocked. So, having a thread pool of 400 threads for CompletableFuture should release the bottleneck (see full code here) :
@RestController
public class GetUsersController {
...
    ExecutorService executorService = Executors.newFixedThreadPool(400);

    @GetMapping(value = "/users_parallel_more_threads/{userId}")
    public User getUsersParallelMoreThreads(@PathVariable String userId) throws ExecutionException, InterruptedException {
        CompletableFuture<String> name = CompletableFuture
                .supplyAsync(()-> getName(userId), executorService);
        CompletableFuture<String> phoneNumber = CompletableFuture
                .supplyAsync(()-> getPhoneNumber(userId), executorService);
        return new User(userId, name.get(), phoneNumber.get());
    }
...
}
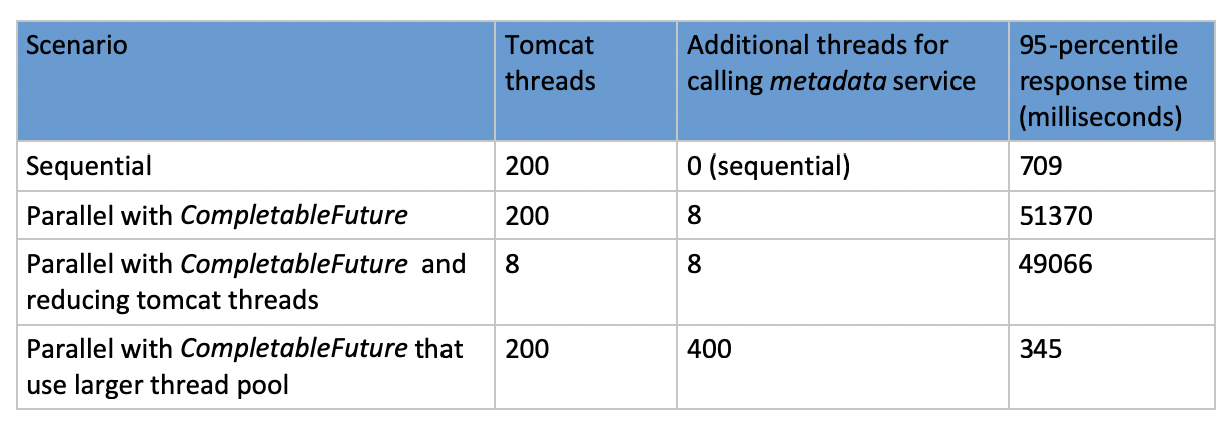
Running the simulation again, I get an average response time of 339 ms and 95-percentile of 345 ms, which is the best compared to all other options we saw:

Conclusions
We must understand the threads' usage of the magics supplied by java.util.concurrent and Spring. What we do next actually depends on our service usage and our resources. If the /users service is a background task, having the sequential approach is enough. In case the /users is a user-facing application, then the response time is very important, and therefore, we must take the parallel approach and manage our own thread pool and pick the number of the threads depending on a few parameters.
The optional solution suggested is to be examined carfeully because we actually added resources, and we should be able to verify if it matches our machines in production. Memory should not be an issue (usually when it comes to adding 400 threads), but you should verify that the CPU is not too busy with switching threads.
However, I will recommend changing the number of threads while testing performance on the machine used to find the best number. More logical cores and faster (instructions per second) of CPU allows more threads. Having more threads than cores is relevant for service like /users that mostly do I/O tasks, but in case of CPU intensive tasks (like transcoding), we should stick to the number of cores.
Further Reading
Opinions expressed by DZone contributors are their own.

Comments