Sampling Strategies in Distributed Tracing: A Comprehensive Guide
This article will explore different sampling techniques, their benefits and drawbacks, and determine the optimal sampling approach for distributed tracing.
Join the DZone community and get the full member experience.
Join For FreeIf you are running a distributed system where each request talks to more than a couple of services, databases, and a queuing system, pinpointing the cause of an issue is not a trivial affair. The complexity increases as the number of services increases, as east-west traffic goes up, as teams get split up, and as data tends to eventual consistency. There are a plethora of tools aiming to solve this problem to various degrees. Perhaps the most critical tooling in this workflow is distributed tracing. We have even argued that a well-implemented distributed tracing solution might subsume logging into its fold.
Yet, in reality, tracing end-to-end request flows has been an afterthought in most companies, as postulated in this article. One of the biggest challenges plaguing widespread adoption is the sheer volume of trace data. Capturing, storing, indexing, and querying from this massive dataset will not only impact performance and add significant noise but also break the bank :)
The solution to this data volume problem is the tried and tested strategy of sampling. In this article, we will delve deeper into various sampling strategies, their advantages and shortcomings, and see what an ideal sampling strategy for distributed tracing should look like.
An Introduction to Sampling
Sampling is selectively capturing a subset of traces for analysis rather than capturing and storing every trace. In other words, capture only the ‘interesting’ traces. There may be many events in a distributed architecture that define ‘interesting.’ For instance:
- Latency Events: Traces exceeding a certain latency threshold can be selectively sampled. By focusing on high latency traces, you can identify performance bottlenecks and areas for improvement.
- Errors: Selectively sample traces that result in errors or exceptions. By capturing these error traces, you can investigate and address issues that negatively impact the system's reliability and stability.
- Priority Events: Assigning priorities to different types of requests or services can help determine which traces to sample. For example, you might assign higher priority to critical services or specific user interactions, ensuring that traces related to these high-priority components are captured.
Most companies try to capture these events more holistically, which mostly boils down to one of these two strategies.
- Head-based Sampling: Traces are sampled randomly, typically based on a predefined sampling rate or probability. For instance, a system may randomly sample 1% of all traces. The principle here is that in a large enough dataset, a 1% or an x% sample will, in ‘high probability,’ capture most traces of interest.
- Tail-based Sampling: Tail sampling operates under the principle that rare but impactful events occur sporadically. These tail events often indicate performance bottlenecks, service degradation, or other issues that need attention. Collecting data on every request or transaction, where success cases are the norm, is therefore impractical and not efficient.
Head-Based Sampling in Open Telemetry
Head-based sampling is where the sampling decision is made right at the start of the trace. In other words, irrespective of whether the trace is ‘interesting’ or not, the decision to drop or keep a span gets made through a simple algorithm that is based on the desired percentage of traces to sample.
The Open Telemetry project comes built-in with 4 samplers that can be set as a configuration.
AlwaysSample and NeverSample
These samplers are self-explanatory. These samplers do not make any decisions; they either sample everything or nothing, as the case may be.
TraceIDRatioBased
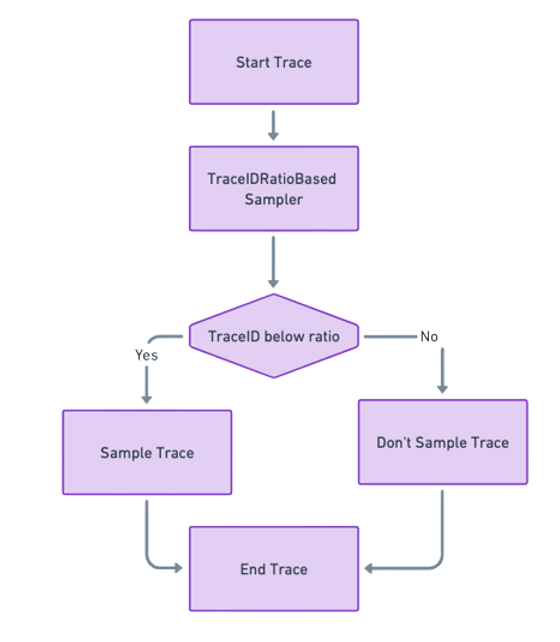
The TraceIdRatioBased sampler makes decisions based on the ratio set and the trace ID of each span. For instance, if the ratio is set to 0.1, the sampler will aim to sample approximately 10% of spans. One way to set this ratio is to look at the TraceID of the span. TraceIDs are randomly generated 128-bit numbers. The sampler treats the TraceID as a number between 0 and 1 by dividing it by the maximum possible 128-bit number. If this number is less than the ratio set when creating the sampler, the sampler samples the span. Otherwise, it doesn't.
The key when implementing this sampler is to have a deterministic hash of the TraceIDwhen computing the sampling decision. This basically ensures that running the sampler on any child Span will always produce the same decision as the root span.

Sampled spans in traceid ratio-based sampler in head sampling.
Parent Based Sampler
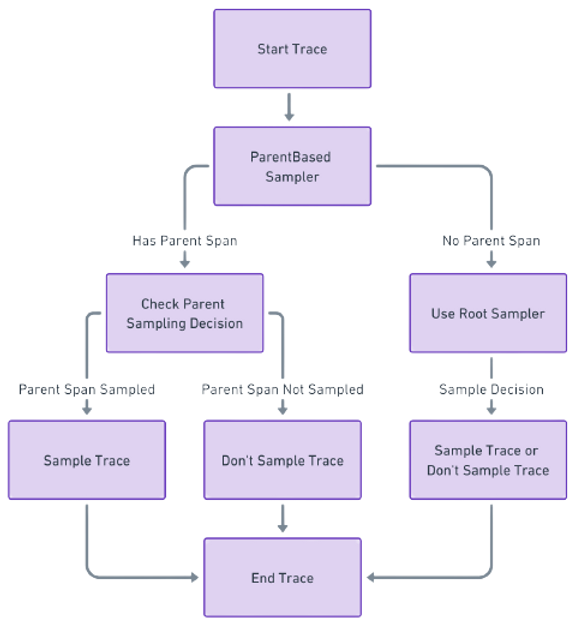
This sampler makes decisions based on the sampling decision of the parent span. If a span has a parent span and the parent span is sampled, then the child span will also be sampled. This is useful for ensuring that entire traces are sampled (or not sampled) consistently.
The Open Telemetry default sampler is a composite sampler and is essentially ParentBased with root=AlwaysSample. This can be modified at the root to a TraceIdRatioBased sampler to sample only a ratio of the spans. The remaining child spans will be sampled or not based on the parent span’s sampling decision. Once that decision is made at the start of the creation of the first span, this gets propagated to all the subsequent child spans as the request flows through the system. This means that the entire trace is sampled as a whole with no span gaps in the middle.

Sampled spans in parent-based sampler in head sampling.
Head Sampling Is Easy To Set Up and Maintain
The great thing about creating a Head sampling strategy is that it is:
- Simple to execute at scale: As long as the sampler’s configurations are set properly during the instrumentation of the agent, the end-to-end spans of a trace will get sampled with no gaps in between.
- Can be made efficient: In high-volume systems, a lower sampling ratio is most probably enough to capture both interesting and uninteresting traces. This is also efficient because the sampling decision is propagated to all child spans with a ParentBased sampler.
- Unbiased: Sampling traces is purely random and does not look at any properties of the span or the trace to make a decision.
- Performant: The decision to sample is made at the start with a quick algorithm instead of holding data in memory to make the decision later.
The Intangible Costs of This Strategy Outweigh Its Benefits
Most companies, when implementing OpenTelemetry, end up executing the Head sampling strategy with a TraceIdRatioBased sampler at the root. While there are clear benefits, as outlined above, the intangible costs of this strategy outweigh the benefits, especially in large-scale, high-volume clusters.
1. This Is a Noisy Strategy
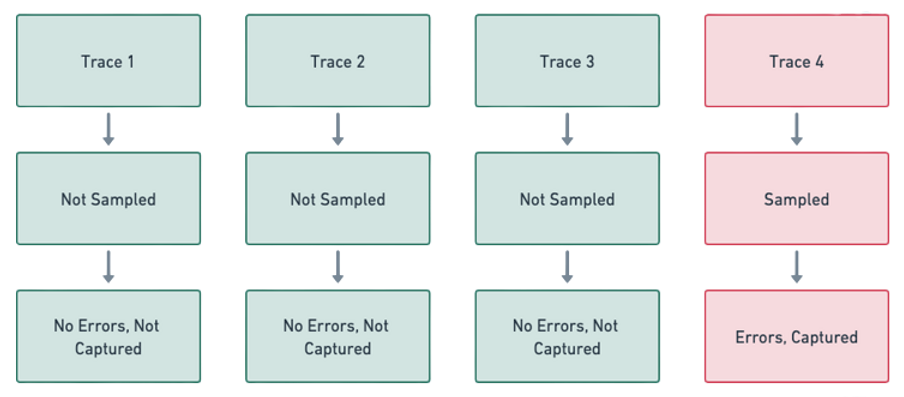
There is a probability attached to whether an interesting trace is captured or not. This means that when looking to debug a potential error, there is a likelihood that the trace might not even have been captured. On top of this, most platforms dump traces onto a dashboard, which implies that the developer has to search, query, and filter from the list of traces to identify a potential trace knowing that there is no guarantee that the trace is even captured.

Sample spans in head sampling may not contain traces of interest.
2. This Leads to Low Developer Trust
This randomness leads to developers, more often than not, preferring to start their debugging journey from monitoring and logging platforms rather than from the tracing platform.
3. Which Leads to Low Usage
When this starts happening, the tracing platform becomes an optional tack-on to the observability pipeline and tooling. At the organization level, the usage ends up becoming sporadic and infrequent as a result.
4. Which Eventually Leads to Poor RoI
When the average developer who ships and owns a service is using a tracing tool maybe 2-3 times a year, the RoI case for distributed tracing gets quite fuzzy.
Clearly, a better way to beat this ‘probability’ problem and hence drive more RoI is to employ Tail Based Sampling.
Tail-Based Sampling in Open Telemetry
Tail sampling is where the decision to sample a trace takes place by considering all the spans within the trace. In other words, Tail Sampling gives the option to sample a trace based on specific criteria derived from different parts of a trace. The Tail Sampling processor in the Open Telemetry project is not part of the core OTEL collector contrib.

Sample spans contain error traces.
To implement Tail Sampling effectively, the tail sampling processor already comes with multiple policies. Some of the more commonly used policies are:
- Latency: Using this policy, the decision to sample is made based on the duration of the trace. The duration is calculated by comparing the earliest start time and the latest end time without factoring in the events that occurred during the intervening period. If the duration exceeds the threshold set, then the trace gets sampled.
- Status_code: Using this policy, the sampling decision is made based on the HTTP status code of the response. If the HTTP status code is in the range of 100-399, the span's status is set to Ok. These codes represent successful or provisional responses. If the HTTP status code is in the range of 400-599, the span's status is set to Error. These codes represent client errors (400-499) or server errors (500-599). If there's no HTTP status code (for example, because the operation didn't involve HTTP), the span's status is left unset.
- Composite: Most companies use a composite policy that is a combination of two or more policies with certain percentages of spans per policy.
The following is a placeholder example of a composite tail-based sampling policy. There are no defaults set by Otel, so at least one policy has to be set up for tail sampling to run. For a tail-based policy to run effectively, we need to define three important configurations.
- decision_wait: 10s: This sets the wait time to ten seconds before deciding to sample, allowing traces to be completed. This will basically store the data in memory for a full ten seconds.
- num_traces: 100: This sets the maximum number of traces that can be stored in memory to 100.
- expected_new_traces_per_sec: 10: This sets the expected number of new traces per second to ten.
processors:

  tail_sampling:

    decision_wait: 10s

    num_traces: 100

    expected_new_traces_per_sec: 10

    policies:

      [

         {

            name: composite-policy-1,

            type: composite,

            composite:

              {

                max_total_spans_per_second: 1000,

                composite_sub_policy:

                  [

                    {

                      name: test-composite-policy-1,

                                type: latency,

                                latency: {threshold_ms: 5000}

                    },

                    {

                      name: test-composite-policy-2,

                                type: status_code,

                                status_code: {status_codes: [ERROR, UNSET]}

                    }

                  ]

              }

          }

        ]
Tail Sampling Makes Collection Intelligent
Tail sampling has some distinct advantages:
- Informed Decisions: Tail sampling makes decisions at the end of a request or even after the request has been completed. This allows it to make more informed decisions because it has access to more information.
- Reduced Noise: By making more informed sampling decisions, tail sampling can reduce noise and make identifying and diagnosing issues easier.
- Cost Efficiency: Tail sampling is also more cost-efficient. By storing and analyzing only the most relevant traces, the amount of storage and processing required can be reduced significantly.
Yet, in Practice, Tail Sampling Scales Poorly
In practice, though, Tail-based sampling scales rather poorly due to inherent design challenges.
Not a ‘set and forget’ design: Microservices are a complex beast that can change shape and form. Systems change, traffic patterns change, and features get added. The rules that govern the sampling policies need to be constantly updated too.
Performance intensive and operationally hard design: The fundamental design of waiting for the trace to complete end to end means we have to hold these spans in memory for a set time in a collector. In addition to this, all the spans need to end up in the same collector for tail sampling to work effectively. This can be done either locally or in some central location. If held locally, this is going to eat into the application resources and will never scale for a real production system. When processed centrally in some other location, this means complex engineering to support scale. This might involve setting up a load balancer that also will have to be trace id aware to send all the spans of the same trace to the same collector. This will then help orchestrate the capturing of an ‘interesting’ trace from the flood of spans.
Defining ‘interesting’ traces involves significant collaboration: While errors might be fairly straightforward to capture, capturing other traces based on latency or the number of queries sent to a DB or a particular customer’s span involves significant collaboration overheads and team specificity. Remember, these may involve changes and additions in the future as systems are involved.
Data costs: Lastly, there is inherent variability in costs since ‘interesting’ events may happen in spikes and may be largely unpredictable. This makes it hard to manage costs predictably.
An Ideal Model Would Incorporate the Best Elements From Both the Approaches
Given the pros and cons of both these sampling techniques, an ideal theoretical model would incorporate the best elements from each approach. The end goal would be to create a strategy that is simple to execute, efficient, and effective in a variety of scenarios. Here’s one such ideal theoretical construct:
1. No-Ops, Automated Selection of Interesting Traces
Operational complexity is one of the biggest bottlenecks that need to be removed to democratize the use of tracing. An ideal solution would automate the instrumentation of the collector/processor/load balancing aspects of Tail Sampling. Once dropped in, the spans get collected, anomalies are identified, and the trace gets stitched and dumped into persistent storage. The rest get discarded.
2. Adaptive
Systems change continuously, and the decisions ideally should not be based on fixed rules. For instance, the sampling rate can be dynamically altered based on error trends, traffic patterns, and other telemetry data, which brings us to the next point.
3. Integrations With Other Tools
There is telemetry data emitted to multiple tools in the Observability infrastructure. An ideal platform should be able to read/listen to these signals to create dynamic policies. For instance, a seemingly simple policy such as ‘capture <traces greater than p95 in the last day> is fairly complicated to execute. To execute this, the tail processor must have access to the p95 latency values of the last day and the current p95 latency to make a decision. This has to be as close to real-time as possible. The way such traces get sampled today instead is by using decisions such as latency greater than 300ms, which is hard coded into the policy config.
4. Form-Based and Not Code Based
When the tail policy decisions need to be modified today, it involves a complex collaboration process between the developer and the platform/ops teams. This then translates to changes in the policy file. An ideal solution would have a form-based approach where the developer can dynamically adjust the sampling policy to capture traces that meet certain unique conditions without needing the involvement of the ops teams. Of course, this may dramatically alter the trace volumes and hence must come with proper feedback to the developer.
Conclusion
In summary, while tracing is a powerful tool for understanding and debugging complex distributed systems, crafting the right sampling techniques is critical to deriving strong utility. While both head-based and tail-based sampling offer unique advantages, they also come with their own set of challenges. The quest for an ideal solution continues. Platforms such as ZeroK.ai eliminate this problem by using AI to automatically identify traces of interest and create a no-ops, adaptive, and operationally straightforward experience. There are bound to be newer developments in this space over the next few years.
Published at DZone with permission of Varun Ramamurthy. See the original article here.
Opinions expressed by DZone contributors are their own.

Comments