K-Means Clustering With SAS
K-means clustering partitions observations into clusters in which each observation belongs to the cluster with the nearest mean.
Join the DZone community and get the full member experience.
Join For FreePROC FASTCLUS performs disjoint cluster analysis on the basis of distances computed from one or more quantitative variables.
The most-used cluster analysis procedure is PROC FASTCLUS, or k-means clustering. K-means clustering aims to partition n observations into k clusters in which each observation belongs to the cluster with the nearest mean.
K-means clustering also known as unsupervised learning. Unsupervised learning is a type of Machine Learning algorithm used to draw inferences from datasets consisting of input data without labeled responses.
The most common unsupervised learning method is cluster analysis, which is used for exploratory data analysis to find hidden patterns or grouping in data. There is no dependent variable used in unsupervised learning for analysis.
Clustering means the grouping of a particular set of objects based on their characteristics, aggregating them according to their similarities.
PROC FASTCLUS is used in a variety of analytic, business intelligence, reporting, and data management situations.
PROC FASTCLUS <MAXCLUSTERS= n> <RADIUS= t> <options>;
VAR variables;
ID variables;
FREQ variable;
WEIGHT variable;
BY variables;
The PROC FASTCLUS statement calls the FASTCLUS procedure.
out specifies the output dataset.
radius = t specifies the minimum distance from the previous seed to classify an observation as a new seed; by default, t = 0.
maxclusters = n specifies the maximum number of clusters permitted; by default, n is 100.
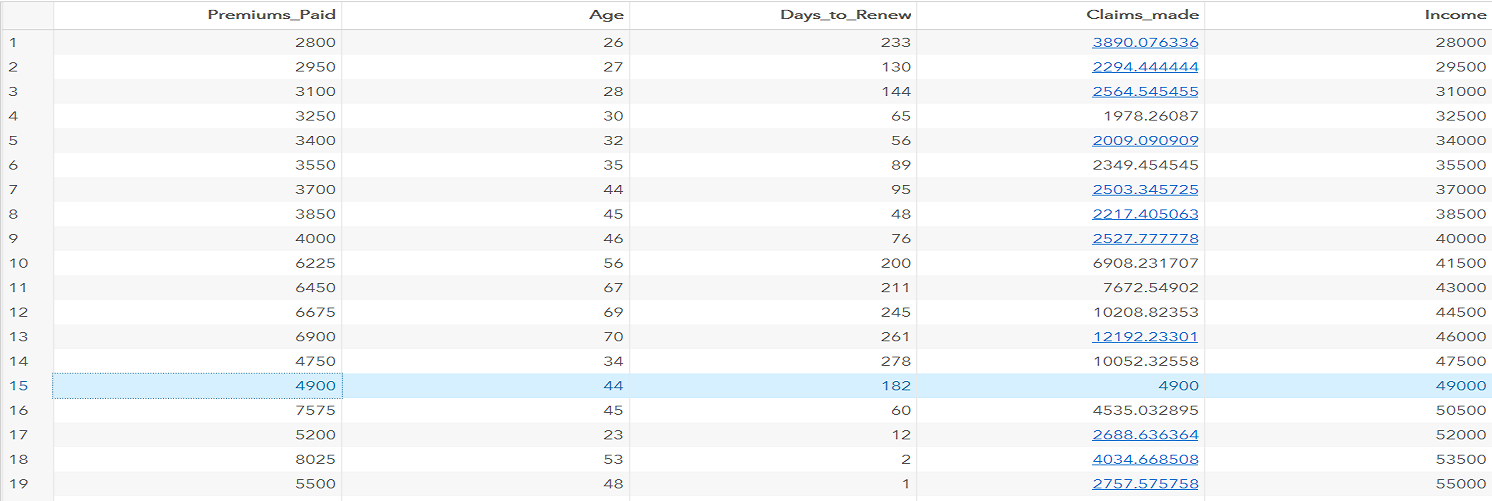
Let's understand k-means clustering with the help of an example. We will perform the k-means on insurance data contains 100 observation and 5 variables (Premium_Paid, Age, Days_to_Renew, Claims_made, Income).
Income and Age variables are used to perform k-means clustering.
proc fastclus data = libref.cluster out = out maxc= 3;
var Income Age;
title 'FASTCLUS ANALYSIS';
RUN;
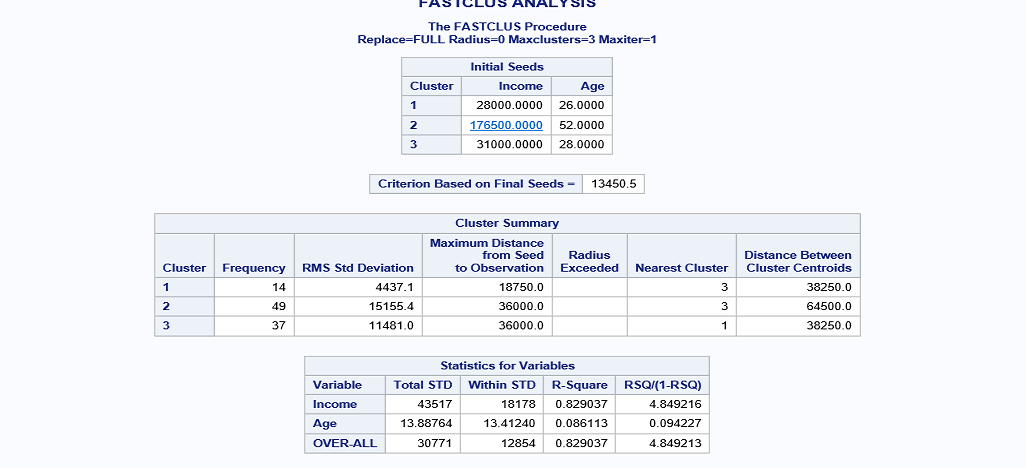
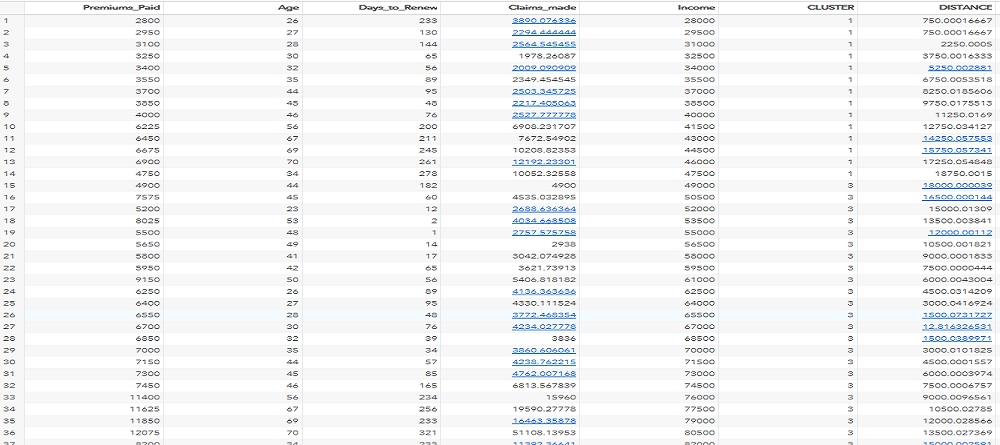
When you run this code, the output is generated and it shown on the screen. The clusters are grouped on the basis of maximum distance from seed to observations.


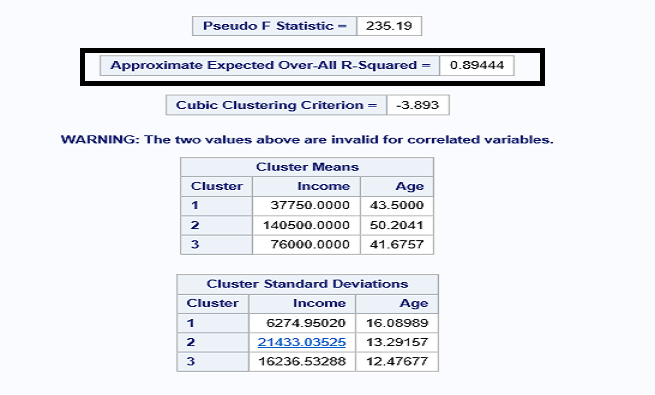
The R-squared value for the model is 0.89444 (>0.70). Hence, this a good fit model. The distance between the seed and observation of the first cluster distance is 18750, and the last cluster is the maximum value.

Now, you know about k-means clustering with SAS.
Opinions expressed by DZone contributors are their own.

Comments