Issue Prioritization Template
In this guide, I share a Google Sheet Prioritization template and tell you about the tool my team invented based on it.
Join the DZone community and get the full member experience.
Join For FreeIntroduction
Many companies have faced the problem of issue prioritization, and my team is no exception. Customers wanted new features, managers offered their ideas, and developers came up with their solutions. Our product backlog in Jira turned into an endless list of issues. The sprint planning meetings took hours and ended up with the sprint still not getting the most significant backlog issues.
Our solution was to create a Google Sheets spreadsheet to prioritize tasks and synchronize the remote team.
- We adopted a decision matrix or decision matrix analysis—a method that helps make weighted decisions based on different criteria.
- Came up with criteria from the RICE score and AARRR.
- Integrated the spreadsheets with Jira using Automate.io. Tried Zapier as well.
And so we got a prioritization tool for the whole team.
We decided to share our prioritization template and tell you about the tool we invented based on it.
Get a Free Template and read how to create Jira to Google Sheets integration via Zapier.
How to Prioritize with An Issue Prioritization Template
We've left a few of our issues in the spreadsheet as an example. Delete them before configuring the prioritization matrix.
Rename the Teams and Criteria
- Rename the tabs with the teams that will evaluate the issues. We've divided into Product Managers and Devs.
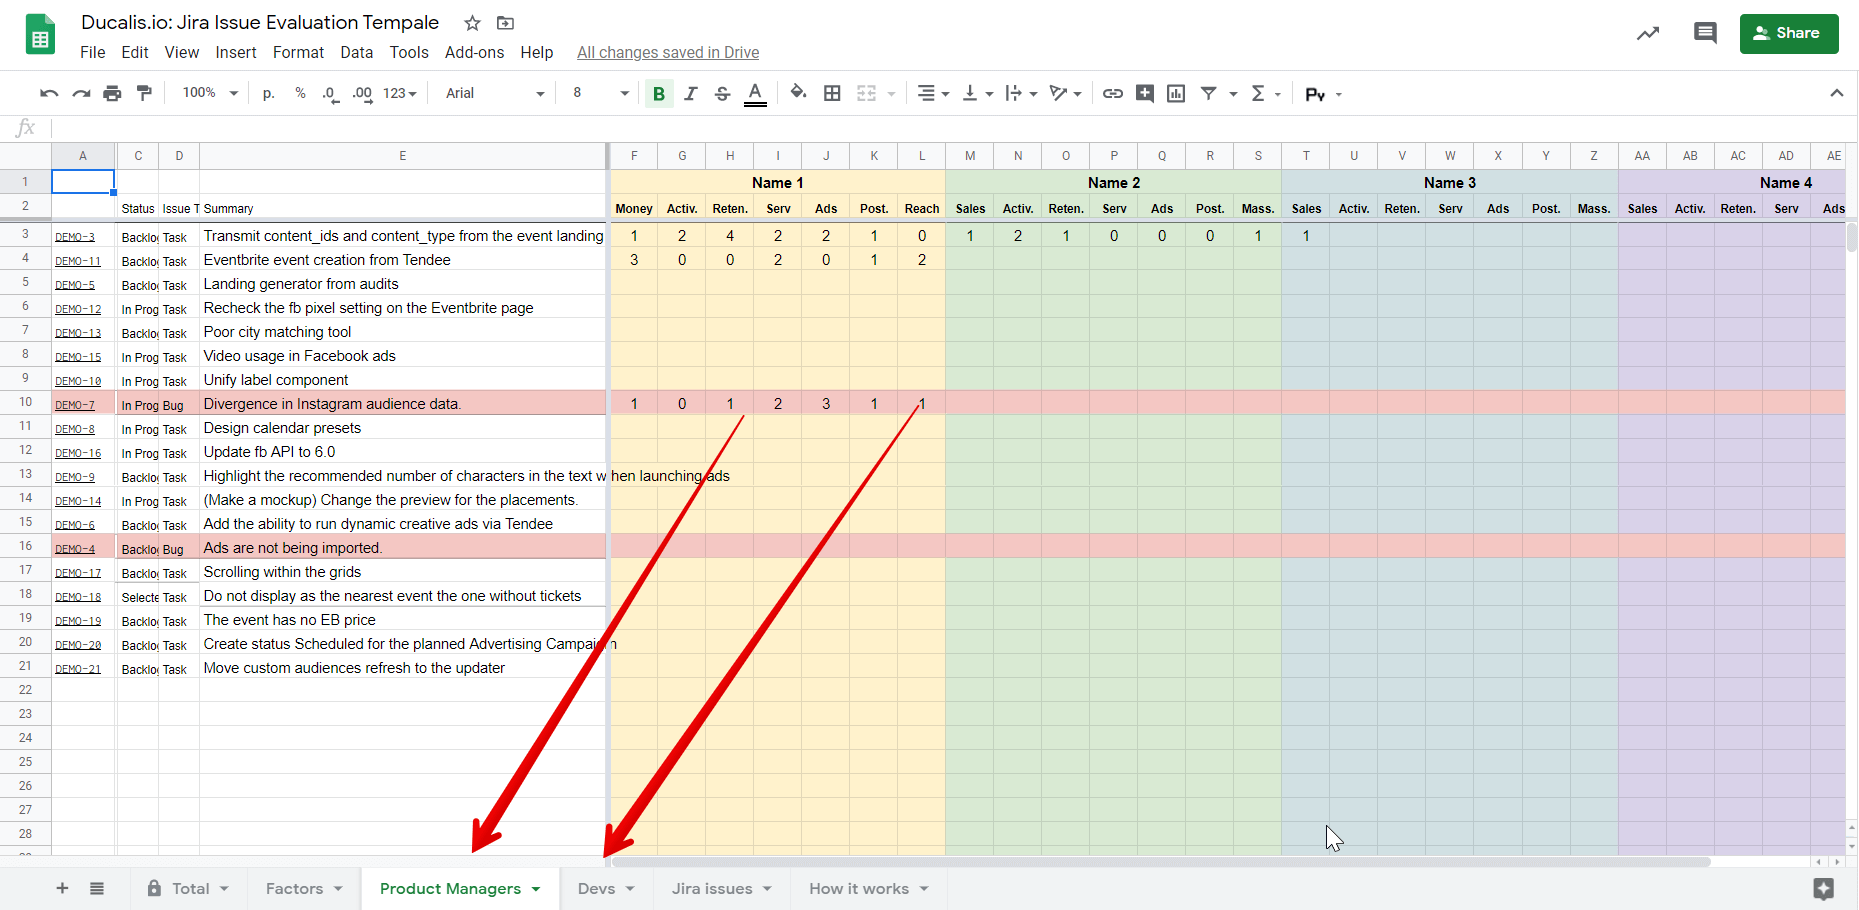
Also, change the team names on the Factors tab.
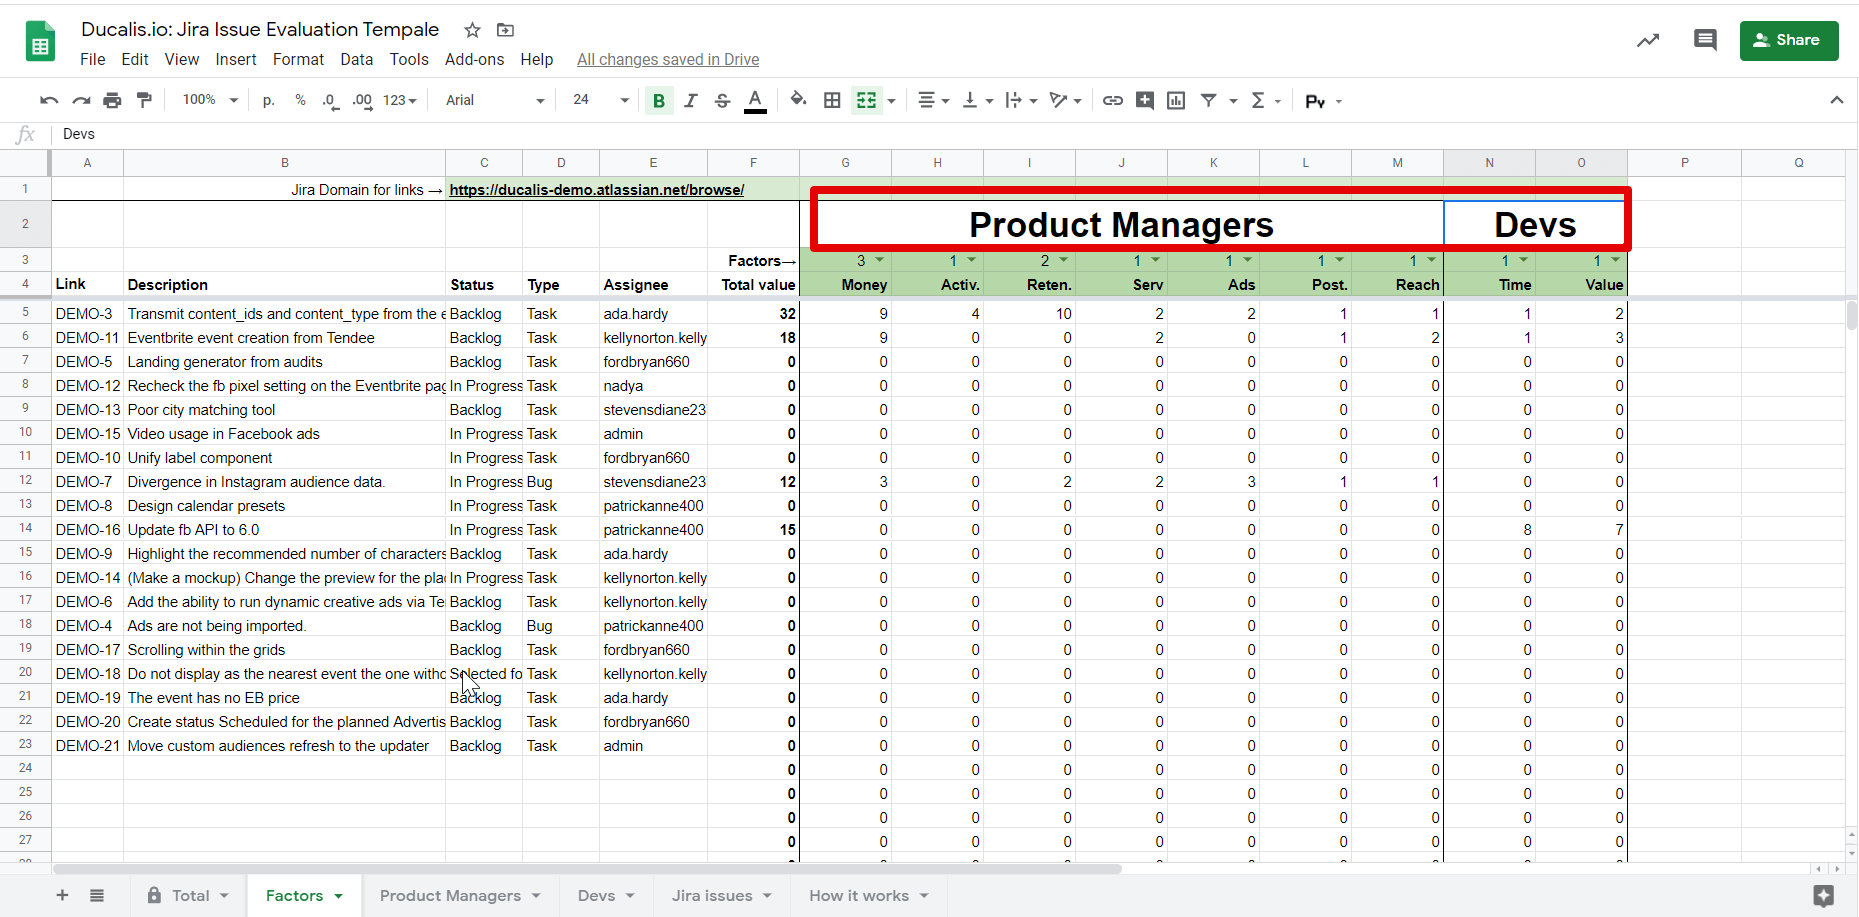
2. Rename the evaluation criteria on the same tab or use the suggested ones. The spreadsheet has an example of our criteria. They may differ for different teams. For example, managers can evaluate the impact of a feature on sales, but they cannot determine the development time.
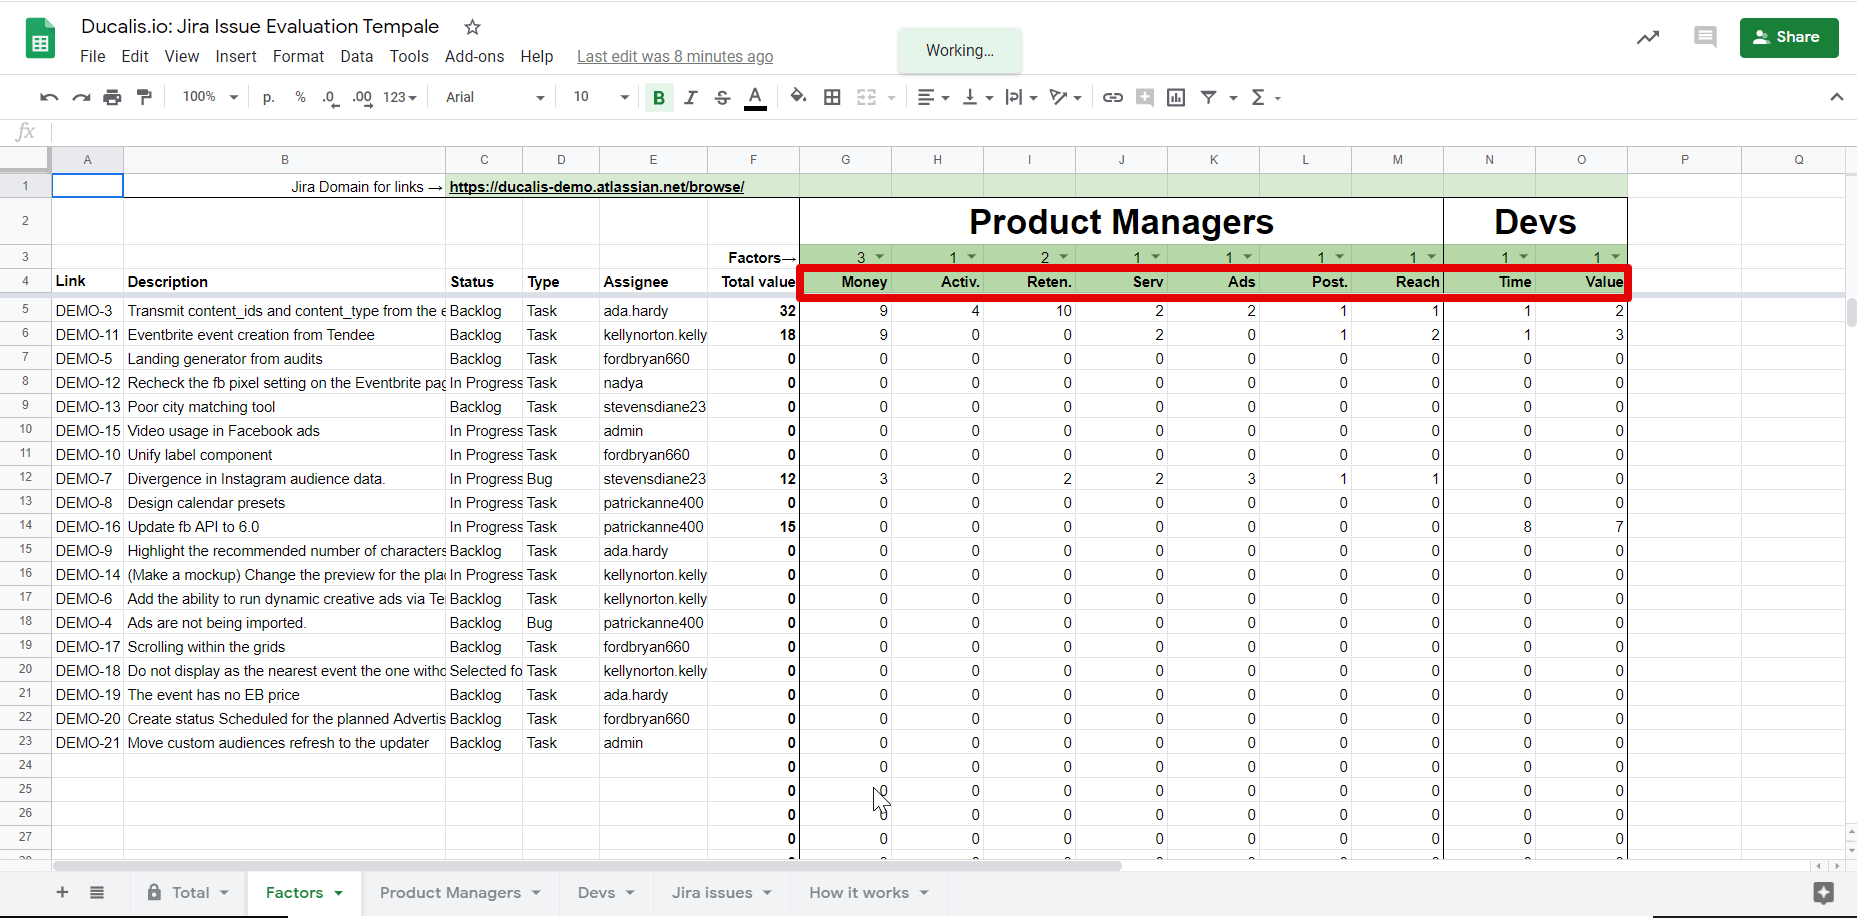
Our criteria examples:
- Product Managers Team.
- Money—Influences the money income.
- Activation—Helps to understand how the product works.
- Retention—Increase user's motivation to use the product again.
- Service—Helps us spend on customer support less time without quality loss.
- Ads—Increase the amount of Facebook Ads a user launches via our product. Important for Facebook Marketing Partnership.
- Posting—Helps to create more templates or custom posts. Shows the advantage of posting and analysis via the tool. Customers post more via the service.
- Reach—How many customers or product units or how much money this feature will affect.
- Developers Team
- Time—Time spent on development, complexity.
- Value—Importance for development and product.
Add Criteria Weight and Description
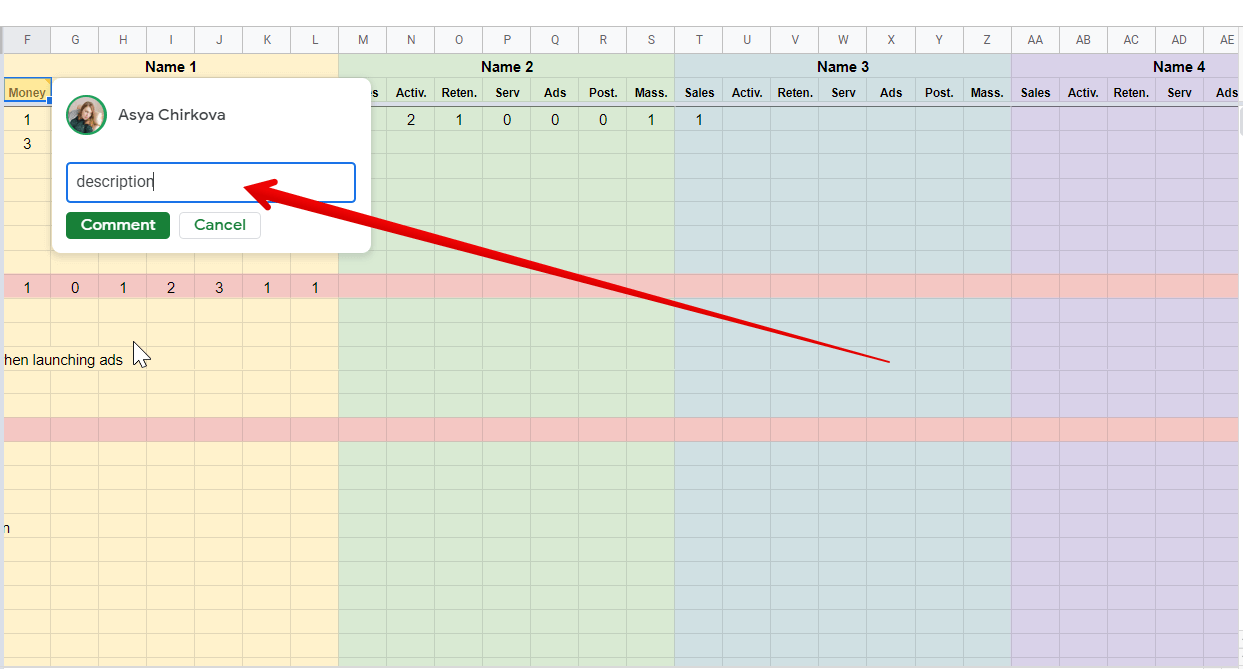
1. Add to each criterion a description using a comment on the cell in the Factors tab and team tabs so that users can see them immediately. Do not put descriptions on separate tabs—no one likes to switch between them.
2. Add each criterion weight in the Factors tab—a ratio that shows the importance of the criterion compared to others.
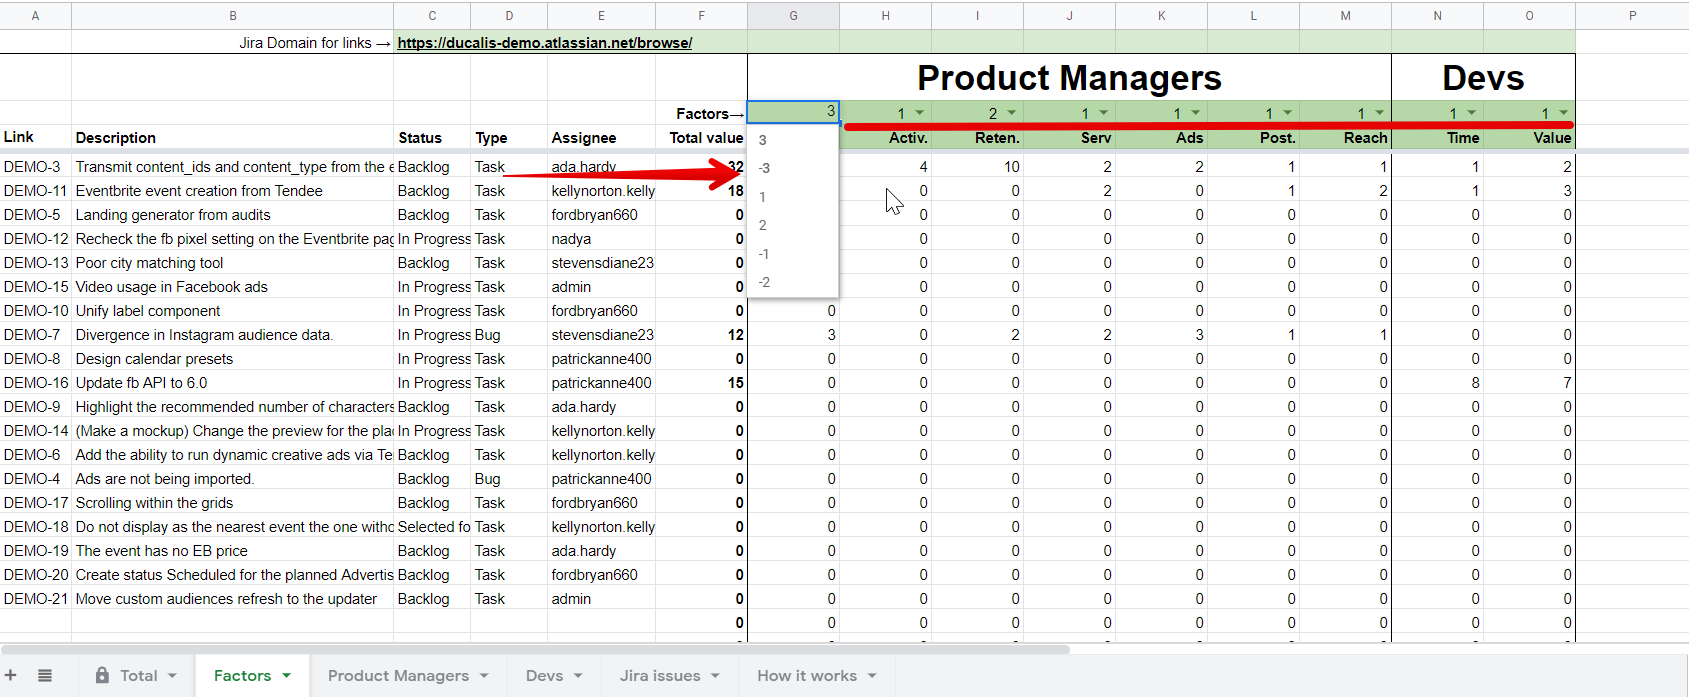
In our matrix, we used the Time criterion (dev time), which has a negative ratio. Set the required weight for each criterion from -3 to 3.
Add Jira Issue Links
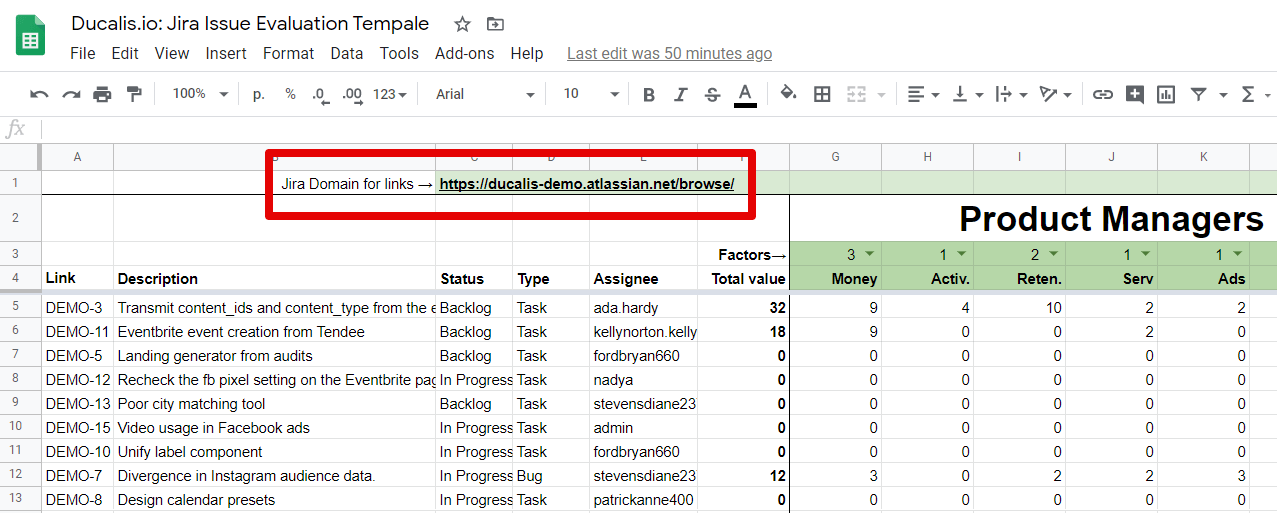
Each issue has a link to Jira so that you can open it and read the description.
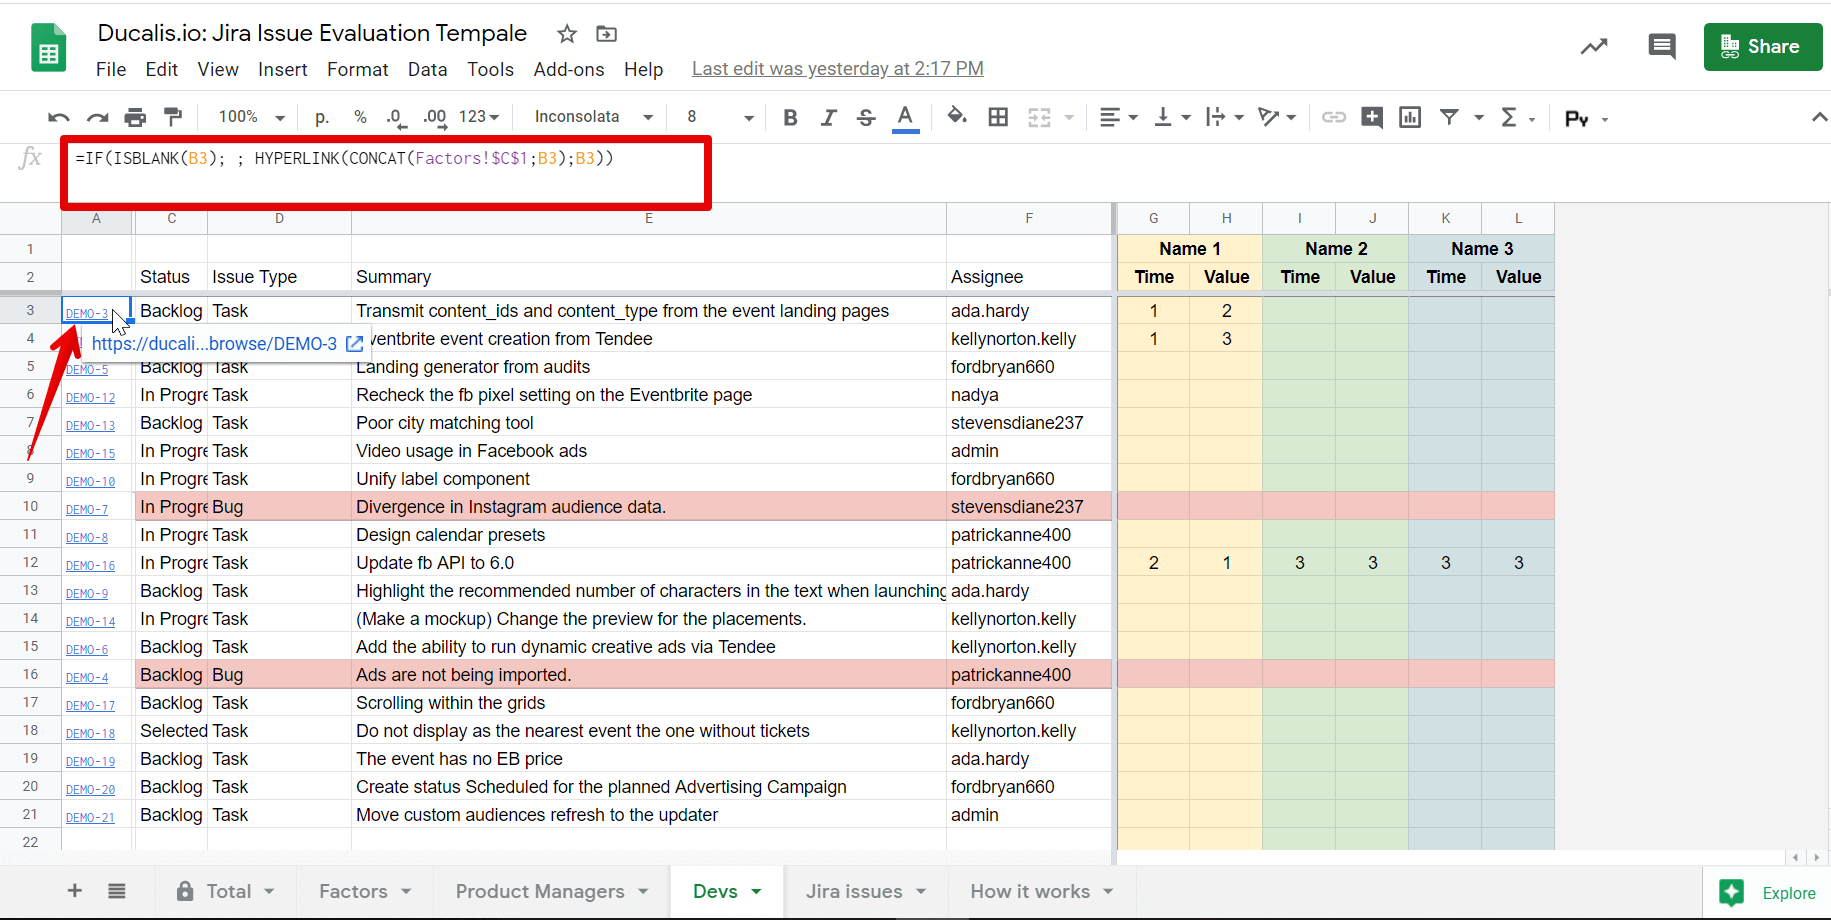
. You must add the link to your Jira domain. Open any issue and copy a part of the link from it.
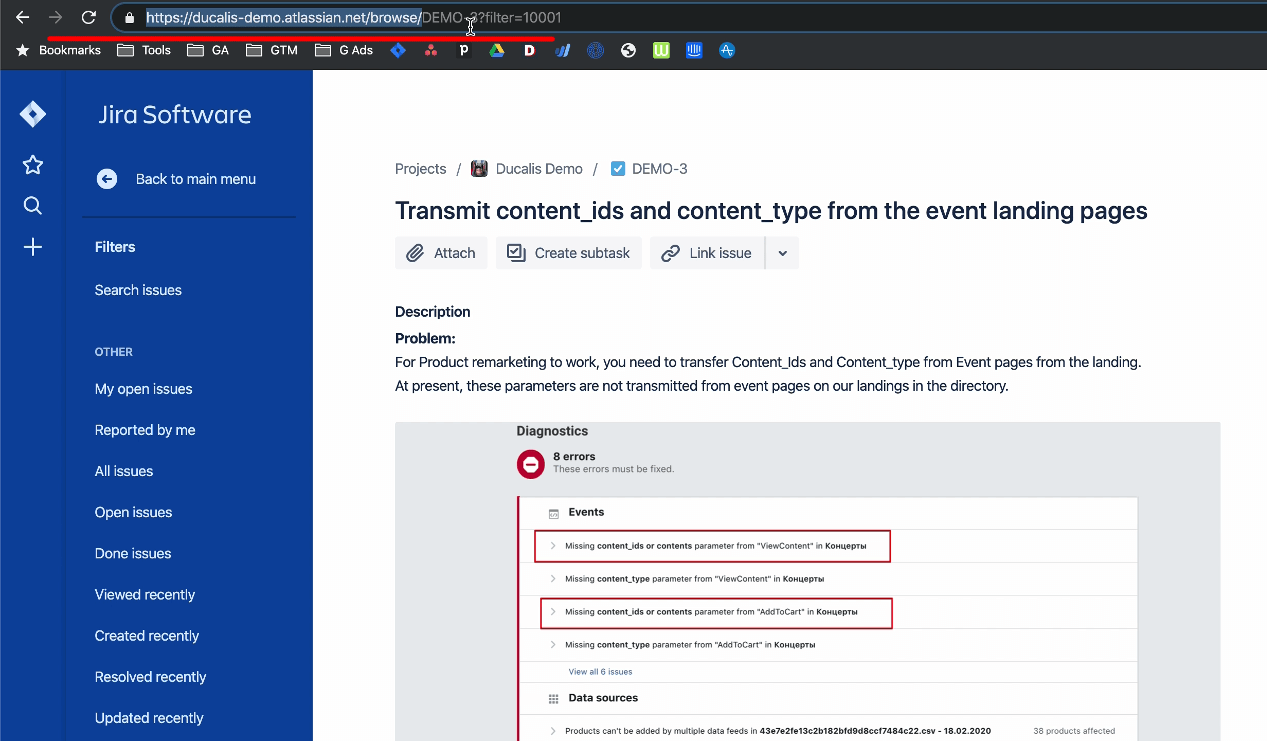
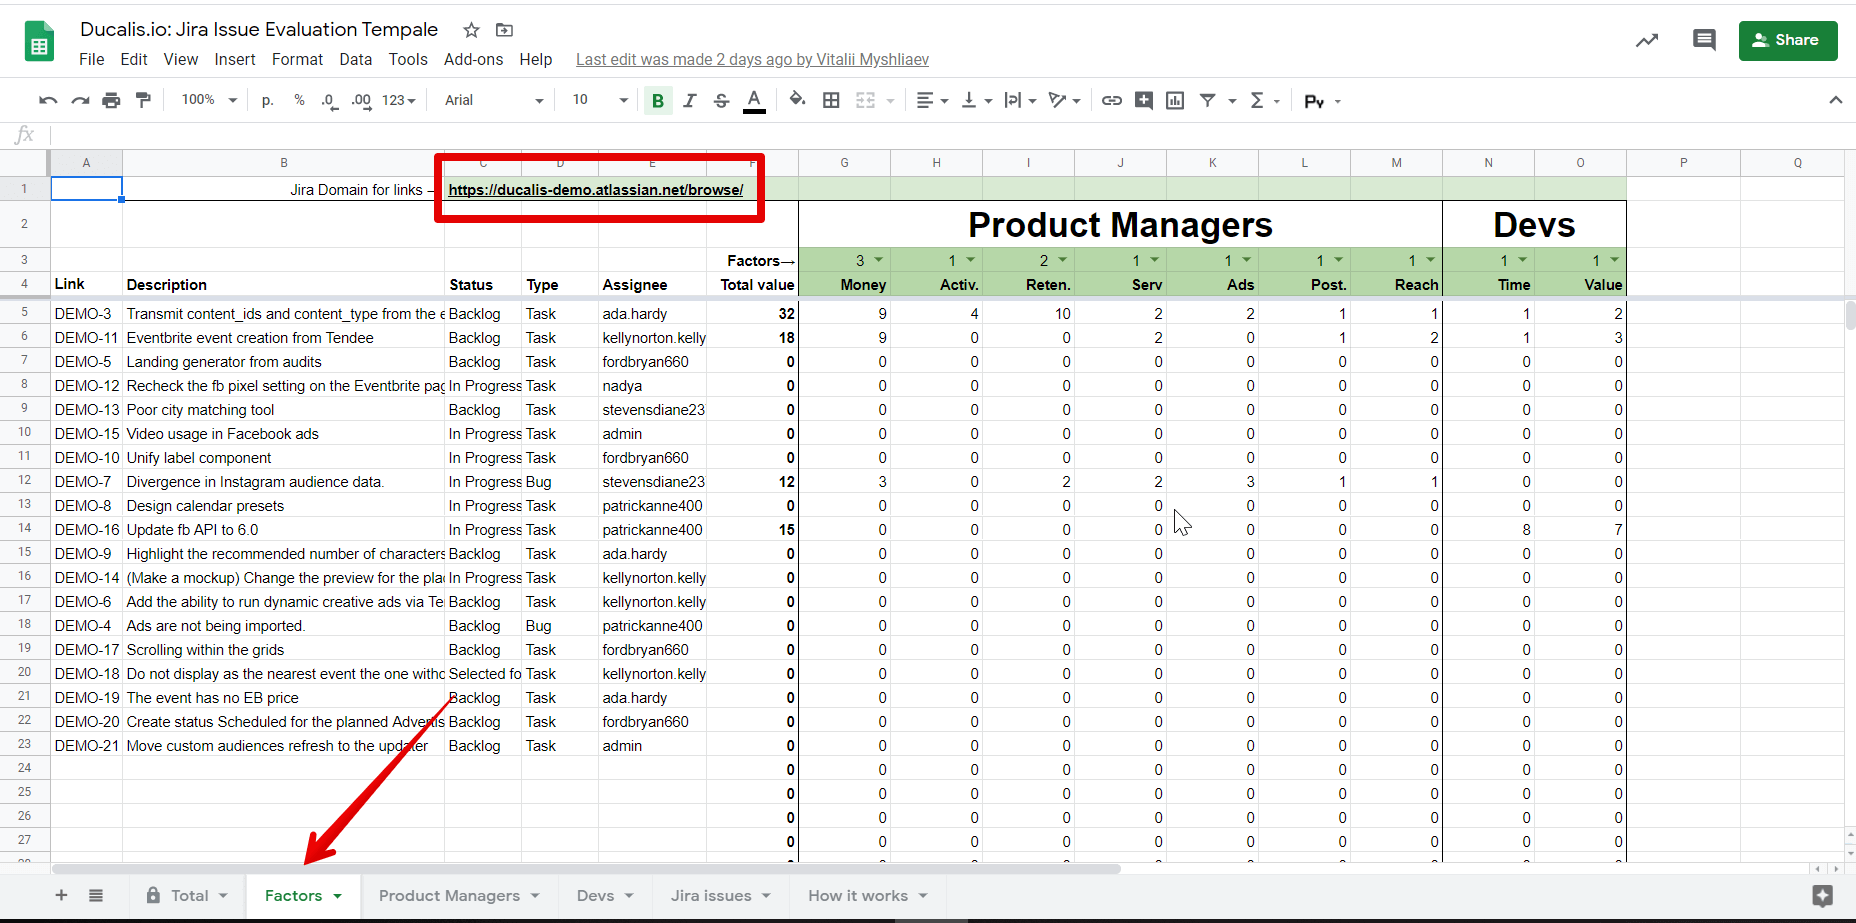
2. Add the link to the field on the Factors tab (Jira Domain for links).
Set Up the Total tab
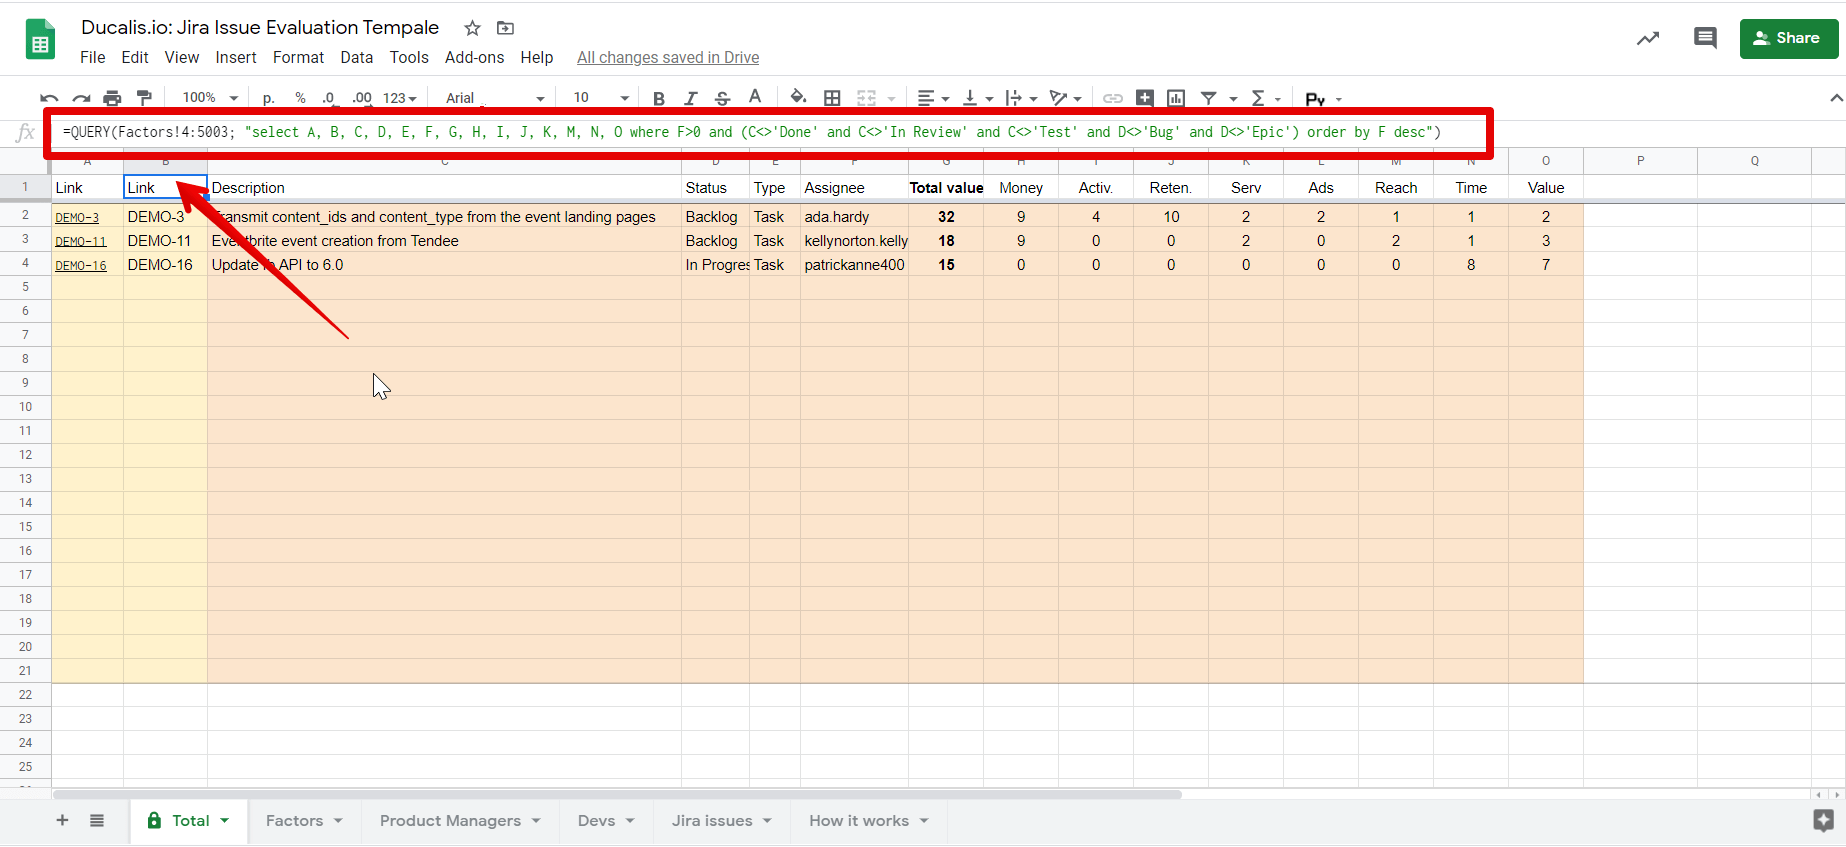
- The evaluation results will appear on the Total tab.
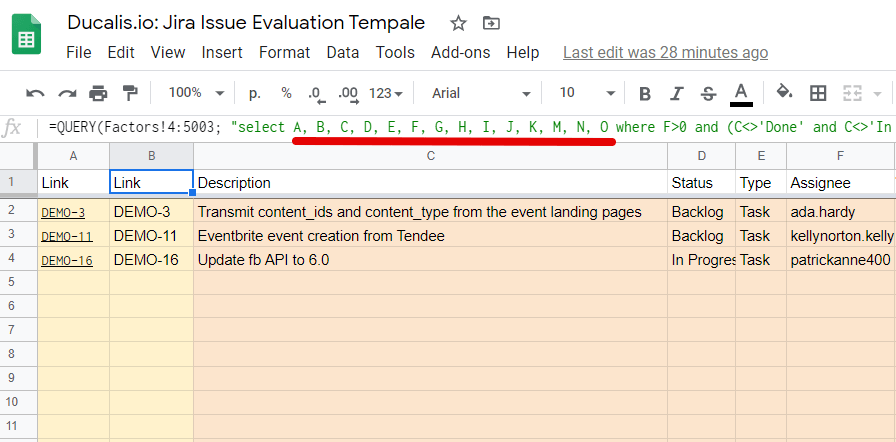
The data is taken from the Factors tab from columns A through O by default.
If there are more/fewer criteria, they must be added/removed from the formula.
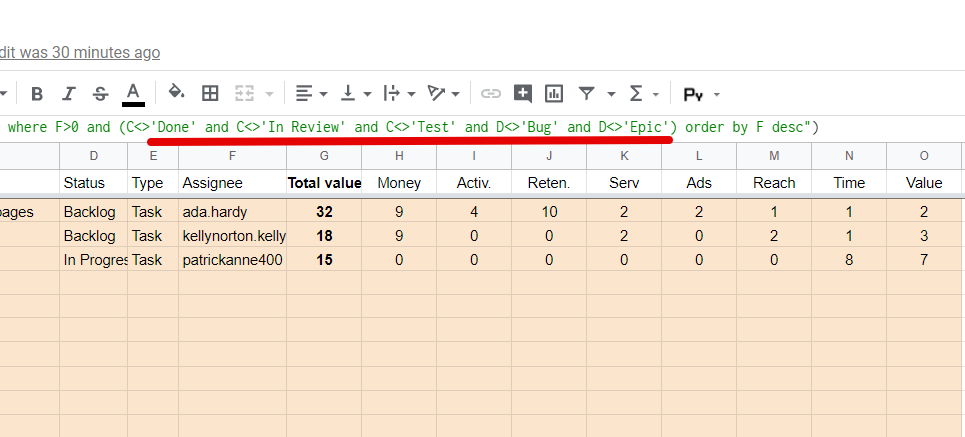
2. Issues with Done, In Review, Test, Bug, or Epic statuses do not fall into Total by default either. If you need to change this setting, add/remove the required statuses from the formula.
Issues Evaluation in Decision Matrix Template
We evaluated the issues once a week. We chose a specific day for the project prioritization to synchronize.
- To start the assessment, go to the tab with the team you belong to.
- Start evaluating each issue by existing criteria. In our weighted matrix template, the issues are scored from 0 to 3. Scores value:
0—No impact.
1—Low impact.
2—Medium impact.
3—High impact.
Calculation and Decision Matrix Analysis
After the evaluation, all scores are automatically calculated in the Calculations tab by the formula:
Total volume = Criterion 1*Factor 1 + Criterion 2*Factor 2 + Criterion 3*Factor 3 + Criterion N*Factor N.
The total value and the top priority issues will be calculated in the Total tab. Issues with a high number of scores will be at the top of the list. In the team's opinion, they have the highest priority. We have determined that we can take no more than 20 issues to the future sprint, so we highlight that number in the Total tab of the weighted decision matrix.
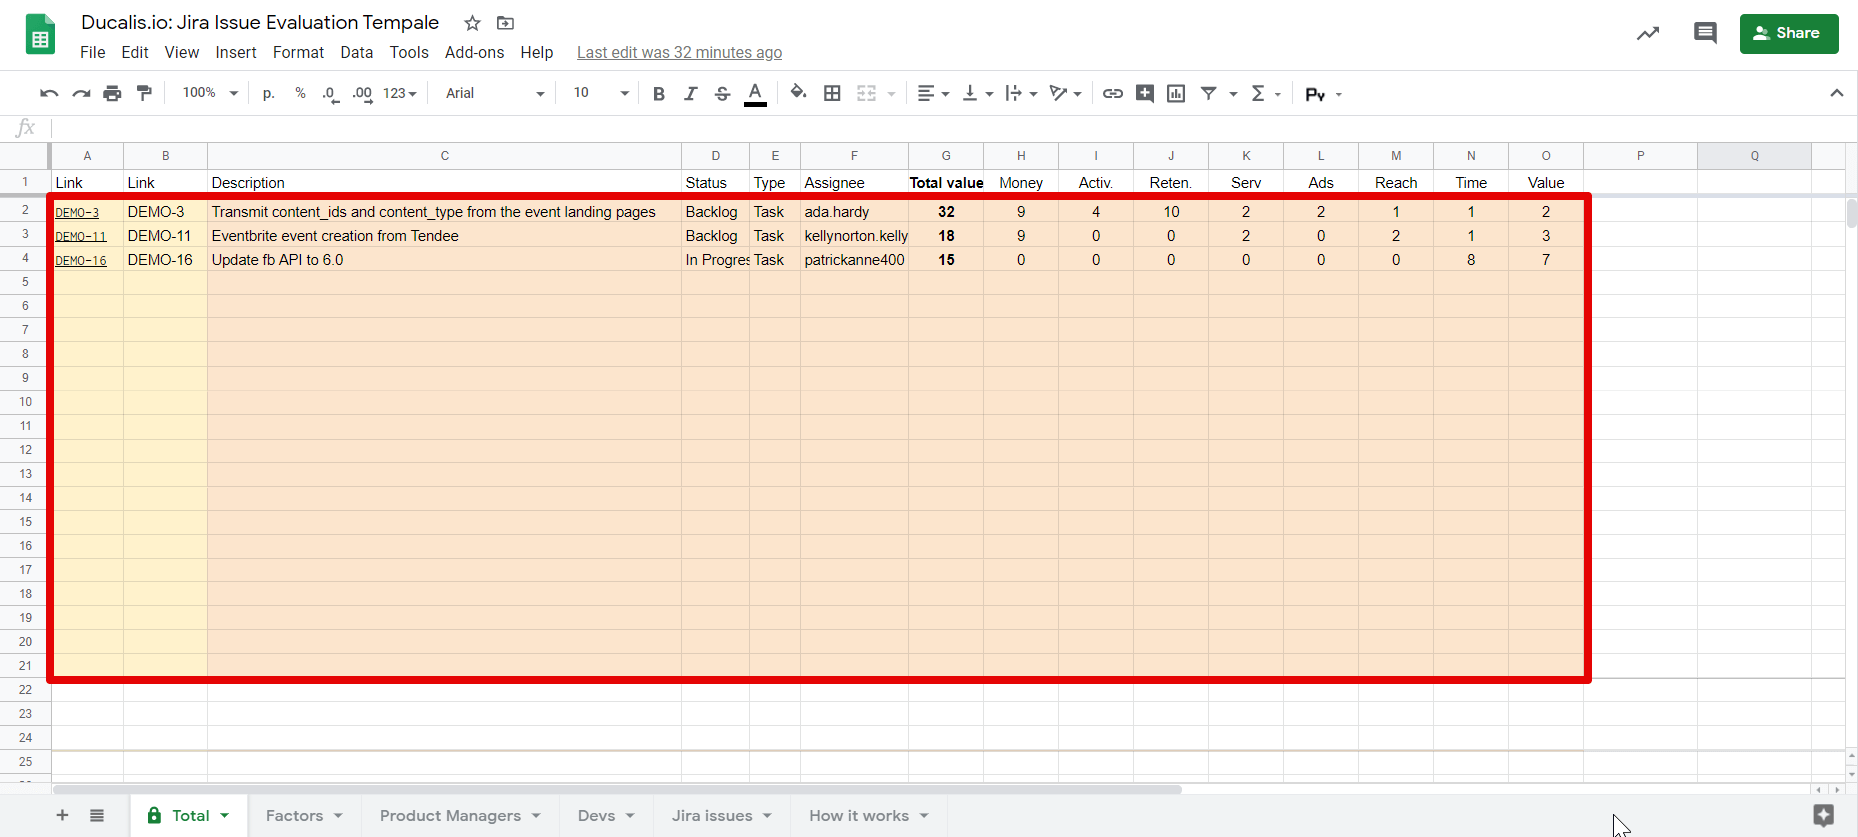
You can change the number of top issues using the conditional formatting function.
How to Automate the Weighted Decision Matrix
At first, the Google Sheets spreadsheet seemed perfect, but after a couple of weeks, we started having problems: Jira import was constantly crashing, lots of duplicated or lost data rows, spreadsheets were often freezing when several people were evaluating at once. We had a Google Sheets admin who was continually fixing the formulas. Anyway, the team sometimes forgot to assign the scores.
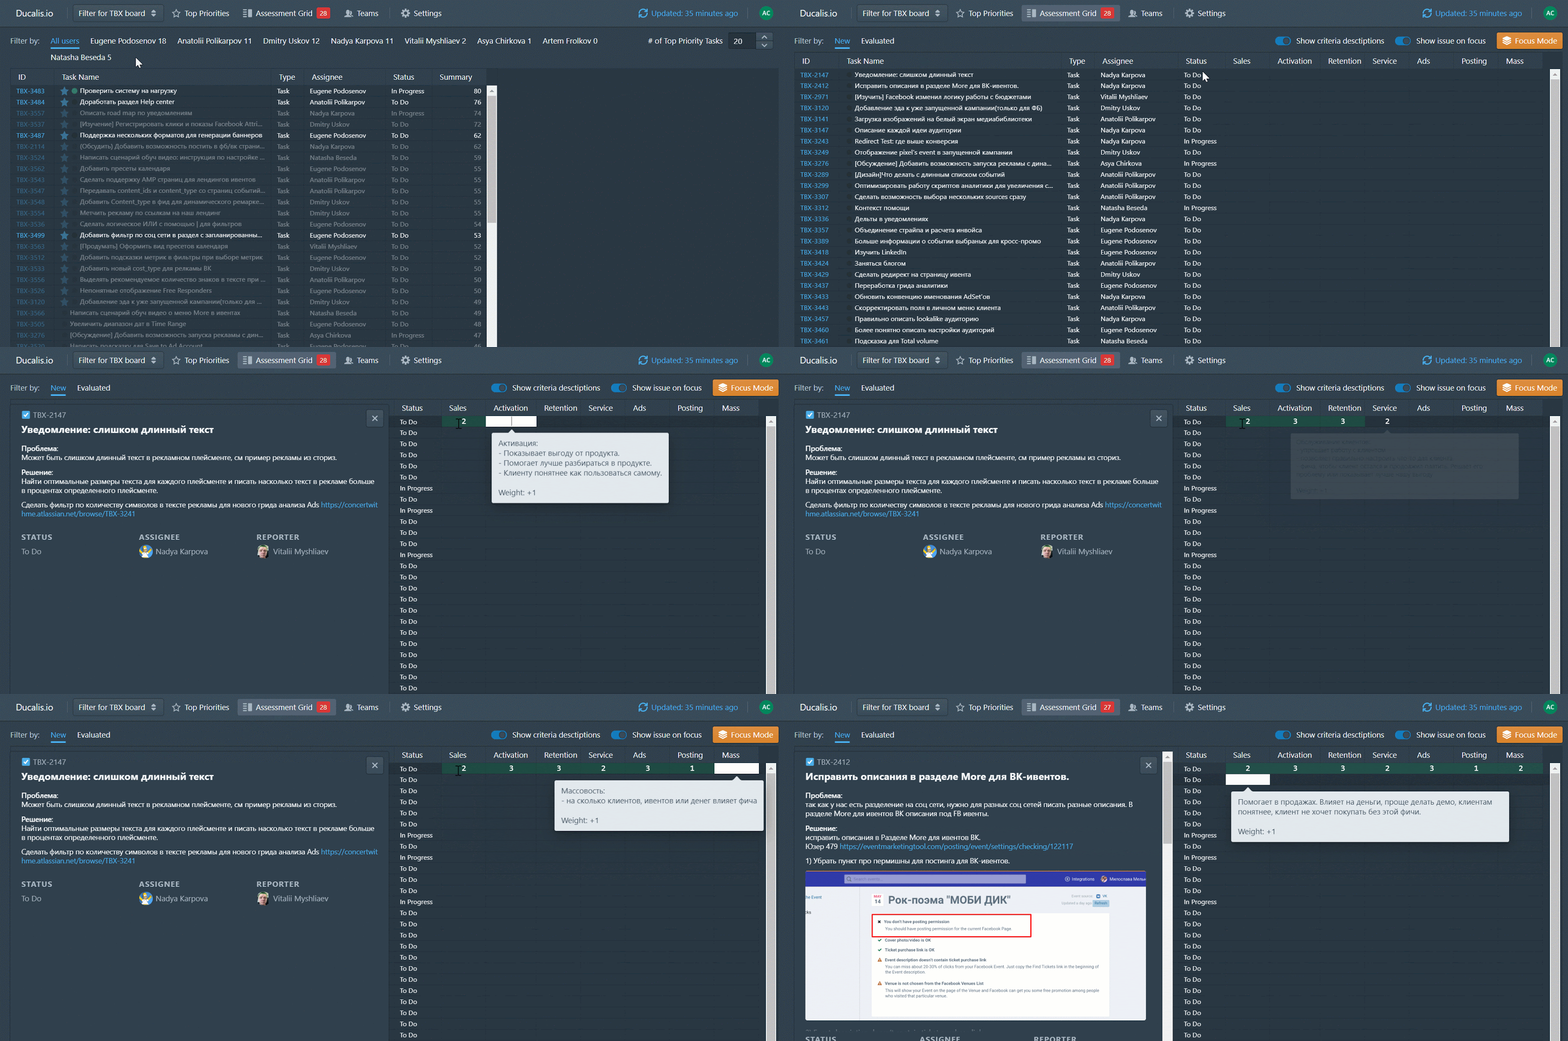
After two months of suffering, we took this weighted scoring model as a basis and made our prioritization tool—Ducalis. Issues were uploaded automatically, formulas were no longer crashing, and notifications reminded users when it was time to prioritize. We used the service inside our remote team for more than a year and now decided to show it to the world.
Published at DZone with permission of Natasha Beseda. See the original article here.
Opinions expressed by DZone contributors are their own.

Comments