Exploring OpenTelemetry Capabilities
Explore the benefits of the OpenTelemetry protocol and gain the flexibility to configure telemetry according to your needs.
Join the DZone community and get the full member experience.
Join For FreeIt is impossible to know with certainty what is happening inside a remote or distributed system, even if they are running on a local machine. Telemetry is precisely what provides all the information about the internal processes. This data can take the form of logs, metrics, and Distributed Traces.
In this article, I will explain all of the forms separately. I will also explain the benefits of OpenTelemetry protocol and how you can configure telemetry flexibly.
Telemetry: Why Is It Needed?
- It provides insights into the current and past states of a system. This can be useful in various situations. For example, it can reveal that system load reached 70% during the night, indicating the need to add a new instance. Metrics can also show when errors occurred and which specific traces and actions within those traces failed.
- It demonstrates how users interact with the system. Telemetry allows us to see which user actions are popular, which buttons users frequently click, and so on. This information helps developers, for example, to add caching to actions. For businesses, this data is important for understanding how the system is actually being used by people.
- It highlights areas where system costs can be reduced. For instance, if telemetry shows that out of four instances, only one is actively working at 20% capacity, it may be possible to eliminate two unnecessary instances (with a minimum of two instances remaining). This allows for adjusting the system's capacity and reducing maintenance costs accordingly.
- Optimizing CI/CD pipelines. These processes can also be logged and analyzed. For example, if a specific step in the build or deployment process is taking a long time, telemetry can help identify the cause and when these issues started occurring. It can also provide insights for resolving such problems.
- Other purposes. There can be numerous non-standard use cases depending on the system and project requirements. You collect the data, and how it is processed and utilized depends on the specific circumstances. Logging everything may be necessary in some cases, while in others, tracing central services might be sufficient.
No large IT system or certain types of businesses can exist without telemetry. Therefore, this process needs to be maintained and implemented in projects where it is not yet present.
Types of Data in Telemetry
Logs
Logs are the simplest type of data in telemetry. There are two types of logs:
- Automatic logs: These are generated by frameworks or services (such as Azure App Service). With automatic logs, you can log details such as incoming and outgoing requests, as well as the contents of the requests. No additional steps are required to collect these logs, which is convenient for routine tasks.
- Manual logs: These logs need to be manually triggered. They are not as straightforward as automatic logs, but they are justified for logging important parts of the system. Typically, these logs capture information about resource-intensive processes or those related to specific business tasks. For example, in an education system, it would be crucial not to lose students' test data for a specific period.
info: ReportService.ReportServiceProcess[0]
Information: {"Id":0,"Name":"65", "TimeStamp":"2022-06-15T11:09:16.2420721Z"}
info: ReportService. ReportServiceProcess[0]
Information: {"Id":0,"Name":"85","TimeStamp":"2022-06-15T11:09:46.5739821Z"}
Typically, there is no need to log all data. Evaluate the system and identify (if you haven't done so already) the most vulnerable and valuable parts of the system. Most likely, those areas will require additional logging. Sometimes, you will need to employ log-driven programming. In my experience, there was a desktop application project on WPW that had issues with multi-threading. The only way to understand what was happening was to log every step of the process.
Metrics
Metrics are more complex data compared to logs. They can be valuable for both development teams and businesses. Metrics can also be categorized as automatic or manual:
- Automatic metrics are provided by the system itself. For example, in Windows, you can see metrics such as CPU utilization, request counts, and more. The same principle applies to the Monitoring tab when deploying a virtual machine on AWS or Azure. There, you can find information about the amount of data coming into or going out of the system.
- Manual metrics can be added by you. For instance, when you need to track the current number of subscriptions to a service. This can be implemented using logs, but the metrics provide a more visual and easily understandable representation, especially for clients.

Distributed Trace
This data is necessary for working with distributed systems that are not running on a single instance. In such cases, we don't know which instance or service is handling a specific request at any given time. It all depends on the system architecture. Here are some possible scenarios:
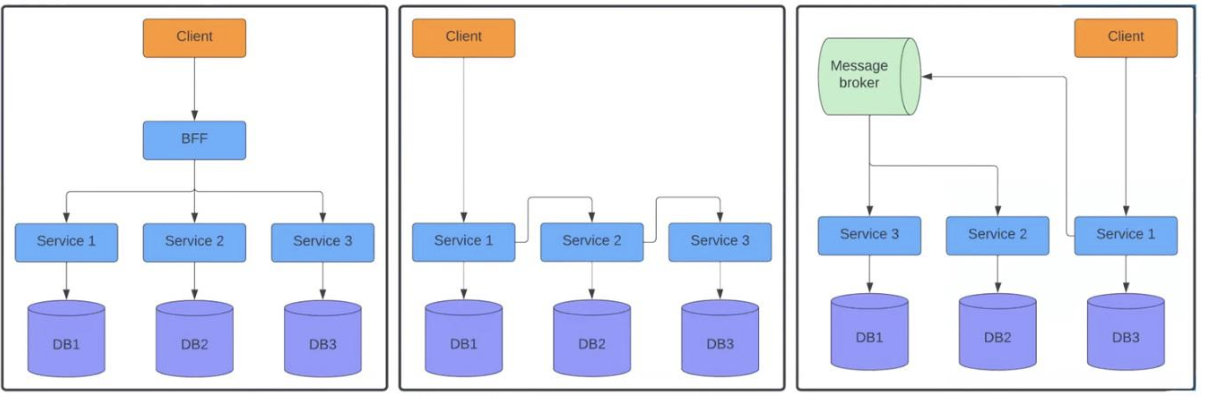
In the first diagram, the client sends a request to the BFF, which then separately forwards it to three services. In the center, we see a situation where the request goes from the first service to the second, and then to the third. The diagram on the right illustrates a scenario where a service sends requests to a Message Broker, which further distributes them between the second and third services. I'm sure you've come across similar systems, and there are countless examples.
These architectures are quite different from monoliths. In systems with a single instance, we have visibility into the call stack from the controller to the database. Therefore, it is relatively easy to track what happened during a specific API call. Most likely, the framework provides this information. However, in distributed systems, we can't see the entire flow. Each service has its own logging system. When sending a request to the BFF, we can see what happens within that context. However, we don't know what happened within services 1, 2, and 3. This is where Distributed Trace comes in. Here is an example of how it works:
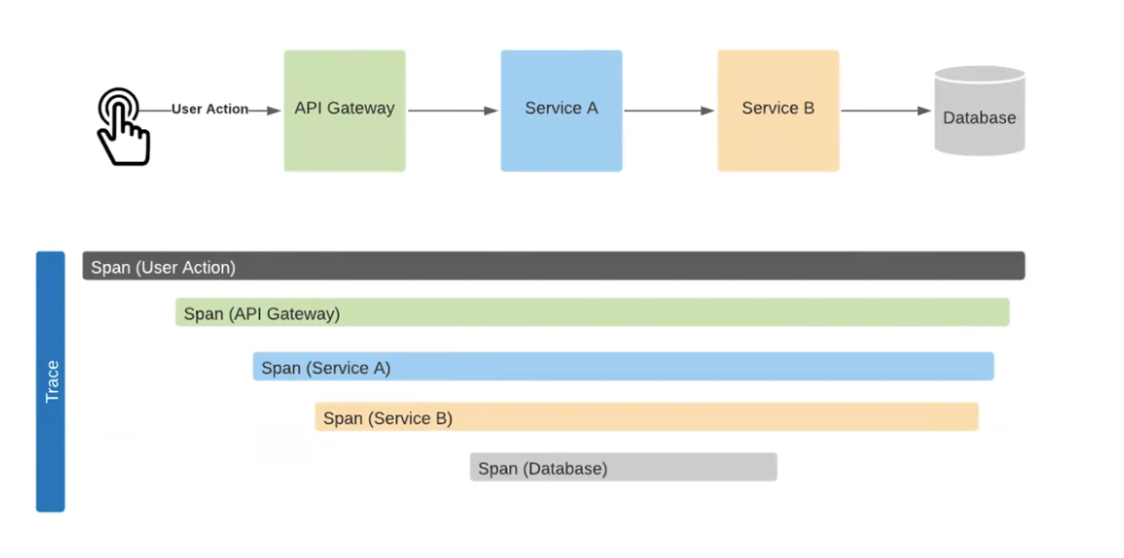
Let's examine this path in more detail…
The User Action goes to the API Gateway, then to Service A, and further to Service B, resulting in a call to the database. When these requests are sent to the system, we receive a trace similar to the one shown. Here, the duration of each process is clearly visible: from User Action to the Database. For example, we can see that the calls were made sequentially. The time between the API Gateway and Service A was spent on setting up the HTTP connection, while the time between Service B and the Database was needed for database setup and data processing. Therefore, we can assess how much time was spent on each operation. This is possible thanks to the Correlation ID mechanism.
What is the essence of it? Typically, in monolithic applications, logs and actions are tied to process ID or thread ID during logging. Here, the mechanism is the same, but we manually add it to the requests. Let's look at an example:

When the Order Service action starts in the Web Application, it sees the added Correlation ID. This allows the service to understand that it is part of a chain and passes the "marker" to the next services. They, in turn, see themselves as part of a larger process. As a result, each component logs data in a way that allows the system to see everything happening during a multi-stage action.
The transmission of the Correlation ID can be done in different ways. For example, in HTTP, this data is often passed as one of the header parameters. In Message Broker services, it is typically written inside the message. However, there are likely SDKs or libraries available in each platform that can help implement this functionality.
How OpenTelemetry Works
Often, the telemetry format of an old system is not supported in a new one. This leads to many issues when transitioning from one system to another. For example, this was the case with AppInsight and CloudWatch. The data was not grouped properly, and something was not working as expected.
OpenTelemetry helps overcome such problems. It is a data transfer protocol in the form of unified libraries from OpenCensus and OpenTracing. The former was developed by Google for collecting metrics and traces, while the latter was created by Uber experts specifically for traces. At some point, the companies realized that they were essentially working on the same task. Therefore, they decided to collaborate and create a universal data representation format.
Thanks to the OTLP protocol, logs, metrics, and traces are sent in a unified format. According to the OpenTelemetry repository, prominent IT giants contribute to this project. It is in demand in products that collect and display data, such as Datadog and New Relic. It also plays a significant role in systems that require telemetry, including Facebook, Atlassian, Netflix, and others.

Key Components of the OTLP Protocol
- Cross-language specification: This is a set of interfaces that need to be implemented to send logs, metrics, and traces to a telemetry visualization system.
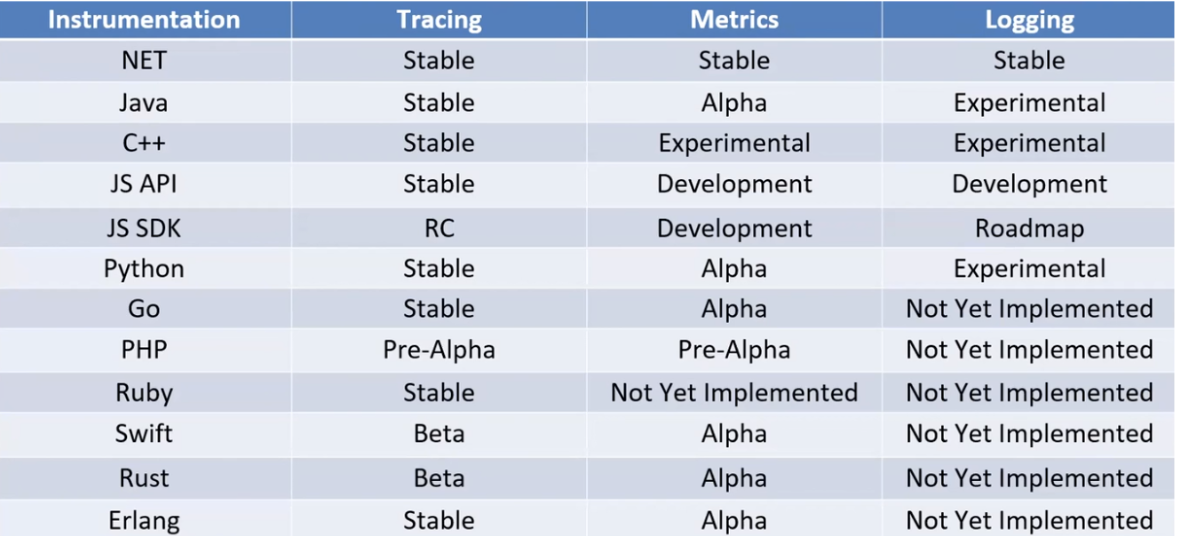
- SDK: These are implemented parts in the form of automatic traces, metrics, and logs. Essentially, they are libraries connected to the framework. With them, you can view the necessary information without writing any code. There are many SDKs available for popular programming languages. However, they have different capabilities. Pay attention to the table. Tracing has stable versions everywhere except for the PHP and JS SDKs. On the other hand, metrics and logs are not yet well-implemented in many languages. Some have only alpha versions, some are experimental, and in some cases, the protocol implementation is missing altogether. From my experience, I can say that everything works fine with services on .NET. It provides easy integration and reliable logging.
- Collector: This is the main component of OpenTelemetry. It is a software package that is distributed as an exe, pkg, or Docker file.
The collector consists of four components:
- Receivers: These are the data sources for the collector. Technically, logs, metrics, and traces are sent to the receivers. They act as access points. Receivers can accept OTLP from Jaeger or Prometheus.
- Processors: These can be launched for each data type. They filter data, add attributes, and customize the process for specific system or project requirements.
- Exporters: These are the final destinations for sending telemetry. From here, data can be sent to OTLP, Jaeger, or Prometheus.
- Extensions: These tools extend the functionality of the collector. One example is the health_check extension, which allows sending a request to an endpoint to check if the collector is working. Extensions provide various insights, such as the number of receivers and exporters in the system and their operation status.

In this diagram, we have two types of data: metrics and logs (represented by different colors). Logs go through their processor to Jaeger, while metrics go through another processor, have their own filter, and are sent to two data sources: OTLP and Prometheus. This provides flexible data analysis capabilities, as different software has different ways of displaying telemetry.
An interesting point: data can be received from OpenTelemetry and sent back to it. In certain cases, you can send the same data to the same collector.
OTLP Deployment
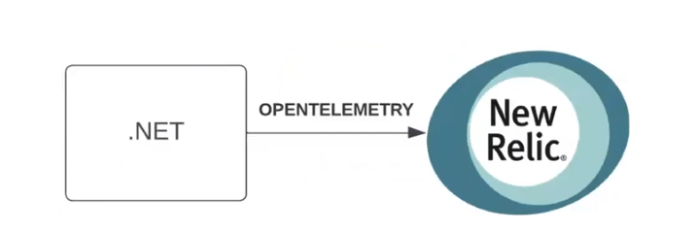
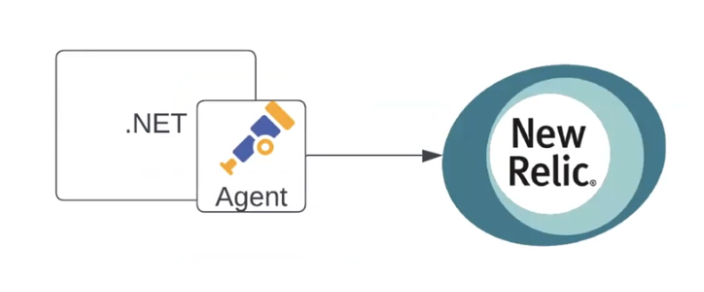
There are many ways to build a telemetry collection system. One of the simplest schemes is shown in the illustration below. It involves a single .NET service that sends OpenTelemetry directly to New Relic:
If needed, the scheme can be enhanced with an agent. The agent can act as a host service or a background process within the service, collecting data and sending it to New Relic:
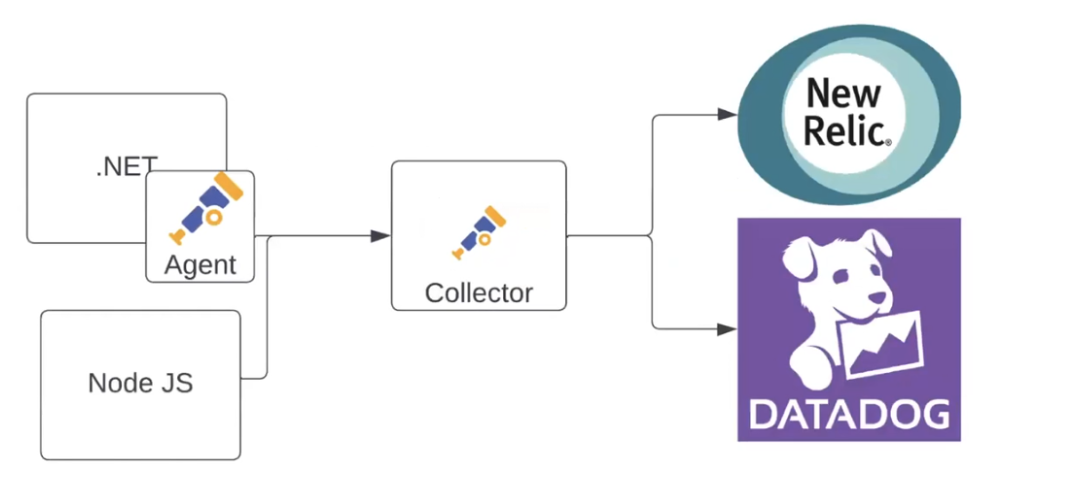
Moving forward, let's add another application to the scheme (e.g., a Node.js application). It will send data directly to the collector, while the first application will do it through its own agent using OTLP. The collector will then send the data to two systems. For example, metrics will go to New Relic, and logs will go to Datadog:
You can also add Prometheus as a data source here. For instance, when someone on the team prefers this tool and wants to use it. However, the data will still be collected in New Relic and Datadog:

The telemetry system can be further complicated and adapted to your project. Here's another example:

Here, there are multiple collectors, each collecting data in its own way. The agent in the .NET application sends data to both New Relic and the collector. One collector can send information to another because OTLP is sent to a different data source. It can perform any action with the data. As a result, the first collector filters the necessary data and passes it to the next one. The final collector distributes logs, metrics, and traces among New Relic, Datadog, and Azure Monitor. This mechanism allows you to analyze telemetry in a way that is convenient for you.
Exploring OpenTelemetry Capabilities
Let's dive into the practical aspects of OpenTelemetry and examine its features. For this test, I've created a project based on the following diagram:

It all starts with an Angular application that sends HTTP requests to a Python application. The Python application, in turn, sends requests to .NET and Node.js applications, each working according to its own scenario. The .NET application sends requests to Azure Service Bus and handles them in the Report Service, also sending metrics about the processed requests. Additionally, .NET sends requests to MS SQL. The Node.js requests go to Azure Blob Queue and Google. This system emulates some workflow. All applications utilize automatic tracing systems to send traces to the collector.
Let's begin by dissecting the docker-compose file.
version: "2"
services:

postal-service:
build:
context: ../Postal Service
dockerfile: Dockerfile
ports:
- "7120:80"
environment:
- AZURE_EXPERIMENTAL_ENABLE_ACTIVITY_SOURCE=true
depends_on:
- mssql

report-service:
build:
context: ../Report
dockerfile: Dockerfile
-"7133:80"
environment:
- AZURE_EXPERIMENTAL_ENABLE_ACTIVITY_SOURCE=true
depends_on:
- mssql
billing-service:
The file contains the setup for multiple BFF (Backend For Frontend) services. Among the commented-out sections, we have Jaeger, which helps visualize traces.
ports:
- "5000:5000"

#jaeger-all-in-one:
# image: jaegertracing/all-in-one: latest
# ports:
# - "16686:16686"
# - "14268"
# - "14250"
There is also Zipkin, another software for trace visualization.
# Zipkin
zipkin-all-in-one:
image: openzipkin/zipkin:latest
ports:
"9411:9411"
MS SQL and the collector are included as well. The collector specifies a config file and various ports to which data can be sent.
# Collector
otel-collector:
image: ghcr.io/open-telemetry/opentelemetry-collector-releases/opentelemetry-collector-contrib:0.51.0
command: ["--config=/etc/otel-collector-config.yaml" ]
volumes:
- ./otel-collector-config.yaml:/etc/otel-collector-config.yaml
ports:
- "1888:1888" # pprof extension
- "13133:13133" # health_check_extension
- "4317:4317"
- "4318:4318"
- "55678:55679" # zpages extension
depends_on:
- jaeger-all-in-one
- zipkin-all-in-one
The config file includes key topics: receivers, exporters, processors, extensions, and the service itself, which acts as the constructor for all of this.
otel-collector-config.yaml
receivers:
otlp:
protocols:
grpc:
http:/
cors:
allowed_origins:
- http://localhost:4200
max_age: 7200

exporters:
prometheus:
endpoint: "0.0.0.0:8889"
const_labels:
label1: value1
logging:
There is a single receiver, otlp, which represents the OpenTelemetry Protocol. Other receivers can be added as well (such as Prometheus). The receiver can be configured, and in my example, I set up the allowed_origins.
receivers:
otrip:
protocols:
grpc:
http:
cors:
allowed_origins:
http://localhost:4200
max_age: 7200
Next are exporters. They allow metrics to be sent to Prometheus.
exporters: prometheus:
endpoint: "0.0.0.0:8889"
const_labels:
label1: value1
logging:
Then come the extensions. In this case, there is a health_check extension, which serves as an endpoint to check the collector's activity.
extensions: health_check:
pprof:
endpoint: :1888
zpages:
endpoint: :55679
Lastly, we have a service with pipelines, traces, and metrics. This section clarifies the data type, its source, processing, and destination. In this example, traces from the receiver are sent for logging to two backends, while metrics are sent to Prometheus.
service
extensions: [pprof, zpages, health_check] pipelines:
traces:
receivers: [otlp]
processors: [batch]
exporters: [zipkin, jaeger]
metrics:
receivers: [otlp]
processors: [batch]
exporters: [prometheus]
Now, let's see how it works in practice. The frontend sends requests to the backend, and the backend uses BFF to send requests. We create a trace and observe the results. Among them, we see some requests with a 500 status.

To understand what went wrong, we look at the traces through Zipkin.
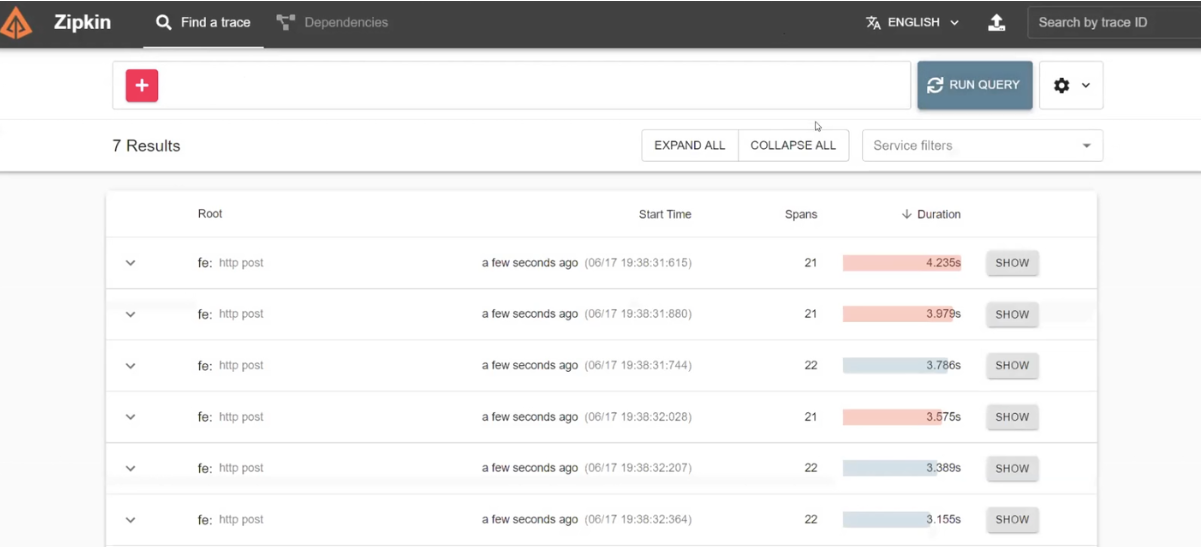
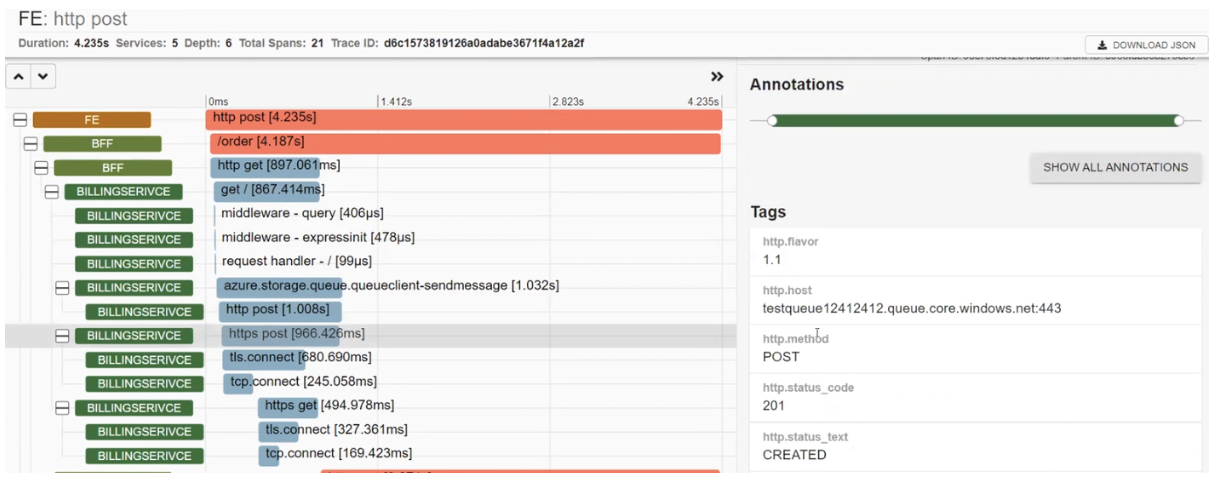
The detailed description of the problematic request shows that the frontend called BFF, which then sent two synchronous requests, one after the other. Through the traces, we can learn where this request was directed, the URL it targeted, and the HTTP method used. All this information is generated based on automatic data. Additionally, manual traces can be added to make the infographic more informative.

Additionally, we see that BFF called BILLINGSERVICE. In it, there are middleware processes, requests sent to Azure, and an HTTP POST request that was sent to Azure, resulting in a CREATED status. The system also sets up and sends requests to Google.
There is also POSTALSERVICE, where one request failed. Taking a closer look, we see the error description: "ServiceBusSender has already been closed...". Therefore, one must be cautious with ServiceBusSender in the future. Here, we can also observe multiple requests being sent to MS SQL.

Finally, we obtain a comprehensive infographic of all the processes in the system. However, I want to warn you that things are not always as transparent. In our case, two traces, as they say, are "out of context." Nothing is clear about them: where they are executed, what happens with them, and there are minimal details. Sometimes, this happens, and you need to be prepared. As an option, you can add manual traces.

Let's take a look at how metrics are sent to Prometheus. The illustration shows that the additional request was successfully sent. There was one request, and now there are five. Therefore, metrics are working properly.

In the .NET application, requests are sent to Azure Service Bus, and they are processed by the Report Service. However, in Zipkin, there was no Report Service. Nevertheless, the metrics show that it is functioning. So, remember that not everything in OTLP works as expected everywhere. I know libraries that add traces to message brokers by default, and you can see them in the stack. However, this functionality is still considered experimental.
Let's not forget about health_check. It shows whether our collector is functioning.
{["status":"Server available","upSince": "2022-06-17T15:49:00.320594Z","uptime": "56m4.4995003s"}Now let's send data to Jaeger as well (by adding a new trace resource). After starting it, we need to resend the requests since it does not receive previous data. We receive a list of services like this:

We have similar traces to those in Zipkin, including ones with a 500 status.

I personally like the System Architecture tab, which displays a system graph. It shows that everything starts with a request to BFF, which is then redirected to BillingService and PostalService. This exemplifies how different tools display data in their unique ways.

Lastly, let's discuss the order. In it, we can find the request and the generated trace ID. If you specify this trace ID in the system, you can learn what happened in the request and thoroughly investigate the HTTP call. This way, the frontend learns that it is the first to receive the User Action. In the same way, the frontend understands that it needs to create a trace that will be passed along the chain and send data to the collector. The collector collects and sends the data to Jaeger, Zipkin, and Prometheus.

Therefore, the advantages of using the OpenTelemetry Protocol are evident. It is a flexible system for collecting, processing, and sending telemetry. It is particularly convenient in combination with Docker, which I used in creating this demo.
However, always remember the limitations of OTLP. When it comes to traces, everything works quite well. However, the feasibility of using this protocol for metrics and logs depends on the readiness of specific system libraries and SDKs.
Opinions expressed by DZone contributors are their own.

Comments