Now, with more context about the main concepts, architecture, and components of OpenTelemetry, we are ready to start tracing. We will instrument two APIs; one will be built in .NET and the other in Python. They will be designed to have the same endpoints and the same purpose. It will return untranslatable words that exist only in one language at random or by language. In this diagram, you can follow each API's simple flows:
Figure 8: Untranslatable API flow chart

Different programming language paradigms present us with different challenges, so I've selected to show examples in two languages, Python and .NET — not to highlight the challenges but to demonstrate the consistency of OpenTelemetry across stacks. Please note that all .NET examples are for ASP.NET Core, and the configuration might differ for the .NET Framework.
Configuration
First, imagine that we already have a project created for whatever language we will use with the basic structure. You will install (Python) or add the necessary libraries (.NET) to your project by running the following commands. For Python, if using setuptools, you can add this library as an installation requirement.
Python:
$ pip install opentelemetry-distro
.NET:
$ dotnet add package OpenTelemetry --prerelease

$ dotnet add package OpenTelemetry.Instrumentation.AspNetCore --prerelease

$ dotnet add package OpenTelemetry.Extensions.Hosting --prerelease
These commands will also add the SDK and API for OpenTelemetry as a dependency.
Collect Traces Using OpenTelemetry
In OTel, we can perform tracing operations on a Tracer. We can obtain it by using GetTracer() in the global Tracer Provider, returning an object that can be used for tracing operations. However, when using auto-instrumentation and depending on the language, that might not be necessary.
Add a Simple Trace With Automatic Instrumentation
Not all frameworks offer automatic instrumentation, but OpenTelemetry advises using it for those that do. Not only does it save lines of code, but it also provides a baseline for telemetry with little work. It works by attaching an agent to the running application and extracting tracing data. When considering auto-instrumentation, remember that it's not as flexible as manual instrumentation and only captures basic signals.
Let us look at code implementations. Below, we have the basic setup for auto-instrumenting our API.
Python:
# app.py
from flask import Flask, Response

app = Flask(__name__)

@app.route("/")
@app.route("/home")
@app.route("/index")
def index():
   return Response("Welcome to Untranslatable!", status=200)
# Add more actions here

if __name__ == "__main__":
   app.run(debug=True, use_reloader=False)
.NET:
// Program.cs
using Microsoft.AspNetCore.Builder;
using Microsoft.Extensions.DependencyInjection;
using OpenTelemetry.Resources;
using OpenTelemetry.Trace;

var serviceName = "untranslatable-dotnet";
var serviceVersion = "1.0.0";

var builder = WebApplication.CreateBuilder(args);
var resource = ResourceBuilder.CreateDefault().AddService(serviceName);

builder.Services.AddOpenTelemetryTracing(tracerProviderBuilder =>
   tracerProviderBuilder
   .SetResourceBuilder(resource)
   .AddSource(serviceName)
   .SetResourceBuilder(
       ResourceBuilder.CreateDefault()
           .AddService(serviceName: serviceName, serviceVersion: serviceVersion))
   .AddAspNetCoreInstrumentation()
   .AddConsoleExporter()
).AddSingleton(TracerProvider.Default.GetTracer(serviceName));

var app = builder.Build();

//… Rest of the setup and actions here
In Python, we don't need to add anything to the code to extract basic metrics, but I'd recommend using the FlaskInstrumentor that adds flask-specific features support. You can add FlaskInstrumentor().instrument_app(app) after instantiating Flask and add extra configurations as needed.
In .NET, we need to configure necessary OpenTelemetry settings as the exporter, instrumentation library, and constants. Like in Python, adding the OpenTelemetry.Instrumentation.AspNetCore package will provide extra features specific to the framework, adding to the base instrumentation library. The instrumentation library for ASP.NET Core will automatically create spans and traces from inbound HTTP requests.
To run our applications with automatic instrumentation and start collecting and exporting telemetry, run the commands below.
Python:
$ python3 -m venv .
$ source ./bin/activate
$ pip install .
$ opentelemetry-bootstrap -a install
$ opentelemetry-instrument \
   --traces_exporter console \
   --metrics_exporter console \
   flask run
.NET:
$ dotnet run Untranslatable.Api.csproj
These commands will start the instrument agent and set up the specific instrumentation libraries. Now, a trace will be printed to the console whenever we send a request. We can see the examples of output below.
Python:
{
 "name": "/words",
 "context": {
   "trace_id": "0x55072f6cc00531a489613e782942f75a",
   "span_id": "0x28135f1ccf37d85f",
   "trace_state": "[]"
 },
 "kind": "SpanKind.SERVER",
 "parent_id": null,
 "start_time": "2022-07-28T10:14:38.951442Z",
 "end_time": "2022-07-28T10:14:38.952775Z",
 "status": {
   "status_code": "UNSET"
 },
 "attributes": {
   "http.method": "GET",
   "http.server_name": "127.0.0.1",
   "http.scheme": "http",
   "net.host.port": 8000,
   "http.host": "127.0.0.1:8000",
   "http.target": "/words?language='es'",
   "net.peer.ip": "127.0.0.1",
   "http.user_agent": "python-requests/2.28.1",
   "net.peer.port": 58618,
   "http.flavor": "1.1",
   "http.route": "/words",
   "http.status_code": 200
 },
 "events": [],
 "links": [],
 "resource": {
   "telemetry.sdk.language": "python",
   "telemetry.sdk.name": "opentelemetry",
   "telemetry.sdk.version": "1.12.0rc2",
   "telemetry.auto.version": "0.32b0",
   "service.name": "unknown_service"
 }
}
.NET:
Activity.TraceId:      	e5e958c3cf3cfb4819605c102cdcfeba
Activity.SpanId:       	b75dd2c4abb36412
Activity.TraceFlags:       	Recorded
Activity.ActivitySourceName: OpenTelemetry.Instrumentation.AspNetCore
Activity.DisplayName: words
Activity.Kind:    	Server
Activity.StartTime:   2022-07-28T10:10:42.9292690Z
Activity.Duration:	00:00:00.0004600
Activity.Tags:
	http.host: localhost:7104
	http.method: GET
	http.target: /words
	http.url: http://localhost:7104/words?language=pt
	http.user_agent: python-requests/2.28.1
	http.route: words
	http.status_code: 200
   StatusCode : UNSET
Resource associated with Activity:
	service.name: untranslatable-dotnet
	service.instance.id: d715f73f-3147-4708-aec6-98bd75a3ad77
Notice that in Python, the traces have many empty unknown values by not adding any configuration.
Add Manual Instrumentation
Manual instrumentation means adding extra code to the application to start and finish spans, define payload, and add counters or events. You can use client libraries and SDKs available for many programming languages. Manual instrumentation and automatic instrumentation should walk hand in hand as they complement each other. Instrumenting your application with intention will augment the automated instrumentation and provide better and deeper observability. The following implementation will add traces to the APIs' methods:
Python:
# app.py
# the libraries you already had
from opentelemetry import trace
from opentelemetry.sdk.resources import SERVICE_NAME, Resource
from opentelemetry.sdk.trace import TracerProvider
from opentelemetry.sdk.trace.export import BatchSpanProcessor, ConsoleSpanExporter
from opentelemetry.instrumentation.flask import FlaskInstrumentor

resource = Resource(attributes={SERVICE_NAME: "untranslatable-python"})

tracer_provider = TracerProvider(resource=resource)
trace.set_tracer_provider(tracer_provider)
tracer = trace.get_tracer(__name__)
trace.get_tracer_provider().add_span_processor(
   BatchSpanProcessor(ConsoleSpanExporter())
)

app = Flask(__name__)
FlaskInstrumentor().instrument_app(app)

@tracer.start_as_current_span("welcome-message")
@app.route("/")
def index():
   return Response("Welcome to Untranslatable!", status=200)

@app.route("/words/random", methods=["GET"])
def word_random():
   with tracer.start_as_current_span("random-word"):
       data = read_json_from_file()
       words = json.dumps(data)
       random_word = random.choice(words)

   return Response(random_word, mimetype="application/json", status=200)

if __name__ == "__main__":
   app.run()
.NET differs from other languages that support OpenTelemetry. The System.Diagnostics API implements tracing, reusing existing objects like ActivitySource and Activity to comply with OpenTelemetry under the hood. For consistency, I've used the OpenTelemetry Tracing Shim so that you can learn to use OpenTelemetry concepts. If you want to see an implementation using Activities, you can check this repo.
.NET:
// UntranslatableController.cs
using System.Linq;
using System.Threading;
using Microsoft.AspNetCore.Mvc;
using OpenTelemetry.Trace;
using Untranslatable.Api.Controllers.Extensions;
using Untranslatable.Api.Models;
using Untranslatable.Data;
using Untranslatable.Shared.Monitoring;

namespace Untranslatable.Api.Controllers
{
   [ApiController]
   [Route("words")]
   [Produces("application/json")]
   public class WordsController : ControllerBase
   {
       private readonly IWordsRepository wordsRepository;
       private readonly Tracer tracer;

       public WordsController(Tracer tracer, IWordsRepository wordsRepository)
       {
           this.wordsRepository = wordsRepository;
           this.tracer = tracer;
       }

       [HttpGet]
       public ActionResult<UntranslatableWordDto> Get([FromQuery] string language = null, CancellationToken cancellationToken = default)
       {
           using var span = this.tracer?.StartActiveSpan("GetWordByLanguage");

           Metrics.Endpoints.WordsCounter.Add(1);
           using (Metrics.Endpoints.WordsTime.StartTimer())
           {
               var allWords = Enumerable.Empty<UntranslatableWord>();
               using (var childSpan1 = tracer.StartActiveSpan("GetByLanguageFromRepository"))
               {
                   childSpan1.AddEvent("Started loading words from file...");
                   allWords = wordsRepository.GetByLanguage(language, cancellationToken);
                   childSpan1.AddEvent("Finished loading words from file...");
               }
               using (tracer.StartActiveSpan("WordsToArray"))
               {
                   var result = allWords.Select(w => w.ToDto()).ToArray();
                   return Ok(result);
               }
           }
       }

       [HttpGet]
       [Route("random")]
       public ActionResult<UntranslatableWordDto> GetRandom(CancellationToken cancellationToken = default)
       {
           using var span = this.tracer?.StartActiveSpan("GetRandomWord");

           Metrics.Endpoints.WordRandom.Add(1);
           using (Metrics.Endpoints.WordRandomTime.StartTimer())
           {
               span.AddEvent("GetRandomWord");
               var word = wordsRepository.GetRandom(cancellationToken);
               span.AddEvent("Done select Random Word");

               return Ok(word.ToDto());
           }
       }
   }
}
Store and Visualize Data
Jaeger is a popular open-source distributed tracing tool initially built by teams at Uber and then open sourced once it became part of the CNCF family. It's a back-end application for tracing that allows developers to view, search, and analyze traces. One of its most powerful functionalities is visualizing request traces through services in a system domain, enabling engineers to quickly pinpoint failures in complex architectures.
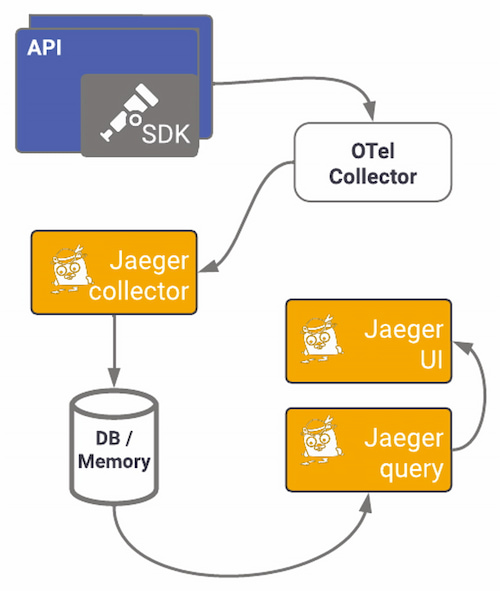
Jaeger provides instrumentation libraries built on OpenTracing standards. Using the specific exporter for Jaeger can offer a quick win on observing your application. Here we will use the OTel exporter and OpenTelemetry's Jaeger exporter to send OTel traces to a Jaeger back-end service. We've seen how the OTel collector works and is set up; the following diagram shows what using Jaeger's specific exporter pipeline looks like:
Figure 9: OTel Collector pipeline

To start visualizing data, you need to set up Jaeger first. You can opt for other setups, but I'll use the all-in-one image to install the collector, query, and Jaeger UI in one container, using memory as default storage (not for production environments). This docker-compose file sets up all components, the network, the ports needed, and the OTel Collector. The ports used in this example are the default ports for each service. Run docker-compose up to start the containers.
version: "3.5"
services:
 jaeger:
   networks:
     - backend
   image: jaegertracing/all-in-one:latest
   ports:
     - "16686:16686"
     - "14268"
     - "14250"
 otel_collector:
   networks:
     - backend
   image: otel/opentelemetry-collector:latest
   volumes:
     - "/YOUR/FOLDER/otel-collector-config.yml:/etc/otelcol/otel-collector-config.yml"
   command: --config /etc/otelcol/otel-collector-config.yml
   environment:
     - OTEL_EXPORTER_JAEGER_GRPC_INSECURE:true
   ports:
     - "1888:1888"
     - "13133:13133"
     - "4317:4317"
     - "4318:4318"
     - "55670:55679"
   depends_on:
     - jaeger
networks:
 backend:
You should now have two containers running, one for Jaeger and another for the OTel collector:
NAMES                 STATUS
otel_collector-1      Up 23 minutes
jaeger-1              Up 23 minutes
If you navigate to http://localhost:16686, you should see Jaeger's UI. Here you'll be able to explore the traces generated by your instrumentation:
Figure 10: Jaeger's user interface

In the top left drop-down menu is the service we created. Services are added to that list when we export traces to Jaeger. As I've mentioned, there are two ways to export telemetry to Jaeger, using the OTLP or directly to Jaeger using one of the supported protocols. We've already seen how to configure the OTLP collector, so now all we have to configure is the Collector to export to Jaeger:
receivers:
 otlp:
   protocols:
     http:
       endpoint: 0.0.0.0:4318
     grpc:
       endpoint: 0.0.0.0:4317
processors:
 batch:
   timeout: 1s
exporters:
 logging:
   loglevel: info
 jaeger:
   endpoint: jaeger:14250
   tls:
     insecure: true
extensions:
 health_check:
 pprof:
   endpoint: :1888
 zpages:
   endpoint: :55679
service:
 extensions: [pprof, zpages, health_check]
 pipelines:
   traces:
     receivers: [otlp]
     processors: [batch]
     exporters: [logging, jaeger]
However, if setting up a collector seems daunting, or if you want to start small using OpenTelemetry, sending data directly to a back end can offer results reasonably fast without the Collector. Let's start by installing OpenTelemetry's Jaeger exporter.
Python:
$ pip install opentelemetry-exporter-jaeger
.NET:
$ dotnet add package OpenTelemetry.Exporter.Jaeger
Again, in Python, we install the package on our host or the virtual environment, whereas for .NET, we add it directly as a project dependency. For Python, the package comes with both gRPC and Thrift protocols.
Python:
# app.cs
# ... other imports
from opentelemetry import trace
from opentelemetry.exporter.jaeger.thrift import JaegerExporter
from opentelemetry.sdk.trace.export import BatchSpanProcessor
from opentelemetry.sdk.trace import TracerProvider
from opentelemetry.sdk.resources import SERVICE_NAME, Resource

resource = Resource(attributes={SERVICE_NAME: "untranslatable-python"})

jaeger_exporter = JaegerExporter(
   agent_host_name="localhost",
   agent_port=6831,
   collector_endpoint="http://localhost:14268/api/traces?format=jaeger.thrift",
)

tracer_provider = TracerProvider(resource=resource)
jaeger_processor = BatchSpanProcessor(jaeger_exporter)
tracer_provider.add_span_processor(jaeger_processor)

trace.set_tracer_provider(tracer_provider)
tracer = trace.get_tracer(__name__)
#... rest of initializations and actions
After installing the package, you can set the exporter in the TracerProvider, which will be configured when tracing starts. Now we will do the same for .NET: After adding the NuGet package to the project, we will configure the exporter. Here we will enable instrumentation using an extension method — AddAspNetCoreInstrumentation — on IServiceCollection and binding the Jaeger exporter.
.NET:
// Program.cs
// ... other imports and initializations
var serviceName = "untranslatable-dotnet";
var serviceVersion = "1.0.0";

var resource = ResourceBuilder.CreateDefault().AddService(serviceName);
builder.Services.AddOpenTelemetryTracing(b => b
   // ...  rest of setup code
   .AddJaegerExporter(o =>
   {
              o.AgentHost = "localhost";
       o.AgentPort = 6831;
       o.Endpoint = new Uri("http://localhost:14268/api/traces?format=jaeger.thrift");
   })
).AddSingleton(TracerProvider.Default.GetTracer(serviceName));
// ...  rest of initializations and actions
Now run your APIs and make some requests. Go to Jaeger's UI, and you should be able to see traces generated by those requests by selecting the service name you specified and the operation you traced. Below, you can see all traces captured within a time window and a trace's detail and the associated spans:
Figure 11: All traces

Figure 12: Trace details
For complex systems and architectures, distributed tracing is invaluable. You can quickly start exporting directly to Jaeger's back end and adding OpenTelemetry auto-instrumentation to get the telemetry data. With Jaeger, it's easier to find where the problem occurred than through logs, allowing you to monitor transactions, perform root cause analysis, optimize performance and latency, and visualize service dependencies.
Common Pitfalls of Migrating Legacy Applications to OpenTelemetry
Your services are probably already emitting telemetry data bound to some observability back end. Changing your observability architecture can be very painful:
- Re-instrumenting is time consuming
- Data will change
- Telemetry data must continue to flow, not allowing blind stops in the system
- Traces have to remain linked
To migrate sequentially and as seamlessly as possible, you can use the OpenTelemetry Collector as a proxy between your services and the back ends you use. The Collector can replace most telemetry services, removing the need for separate services for processing and transmitting signals, making them redundant. Its telemetry pipeline's flexibility lets you configure any compatible back end or service while keeping your code agnostic.
Suppose you want to start migrating all your applications slowly. In that case, the Collector can translate any input into the output you need; you can move an application to OpenTelemetry and send data to the same back end. Note that when changing instrumentation libraries, the output produced changes, so you might have to adjust your dashboards and alerting systems.


{{ parent.title || parent.header.title}}
{{ parent.tldr }}
{{ parent.linkDescription }}
{{ parent.urlSource.name }}