When Breakpoints Don't Break
Tracepoints (AKA Logpoints) are slowly gaining some brand name recognition. But some still don't know about the whole non-breaking breakpoints family.
Join the DZone community and get the full member experience.
Join For FreeI discussed tracepoints quite a bit in my blog and videos. They are wonderful, but I feel the nuance of non-breaking is a bit lost. The true power of this amazing tool is hidden due to our debugging habits and our preconceived notions about debugging. It’s indeed difficult to make the mental shift required for these tools. The payoff for that mental shift is tremendous when dealing with “weird” bugs. Especially in large systems and with concurrency related issues.
Let’s go back to the basics. What’s a non-breaking breakpoint?
Non-Breaking Breakpoint
I don’t like the term non-breaking breakpoint. It’s an oxymoron. At Lightrun, we use the term Snapshot, but it makes more sense for something that has the level of context information that we provide. Google uses the term Capture which in this specific case makes a lot more sense.
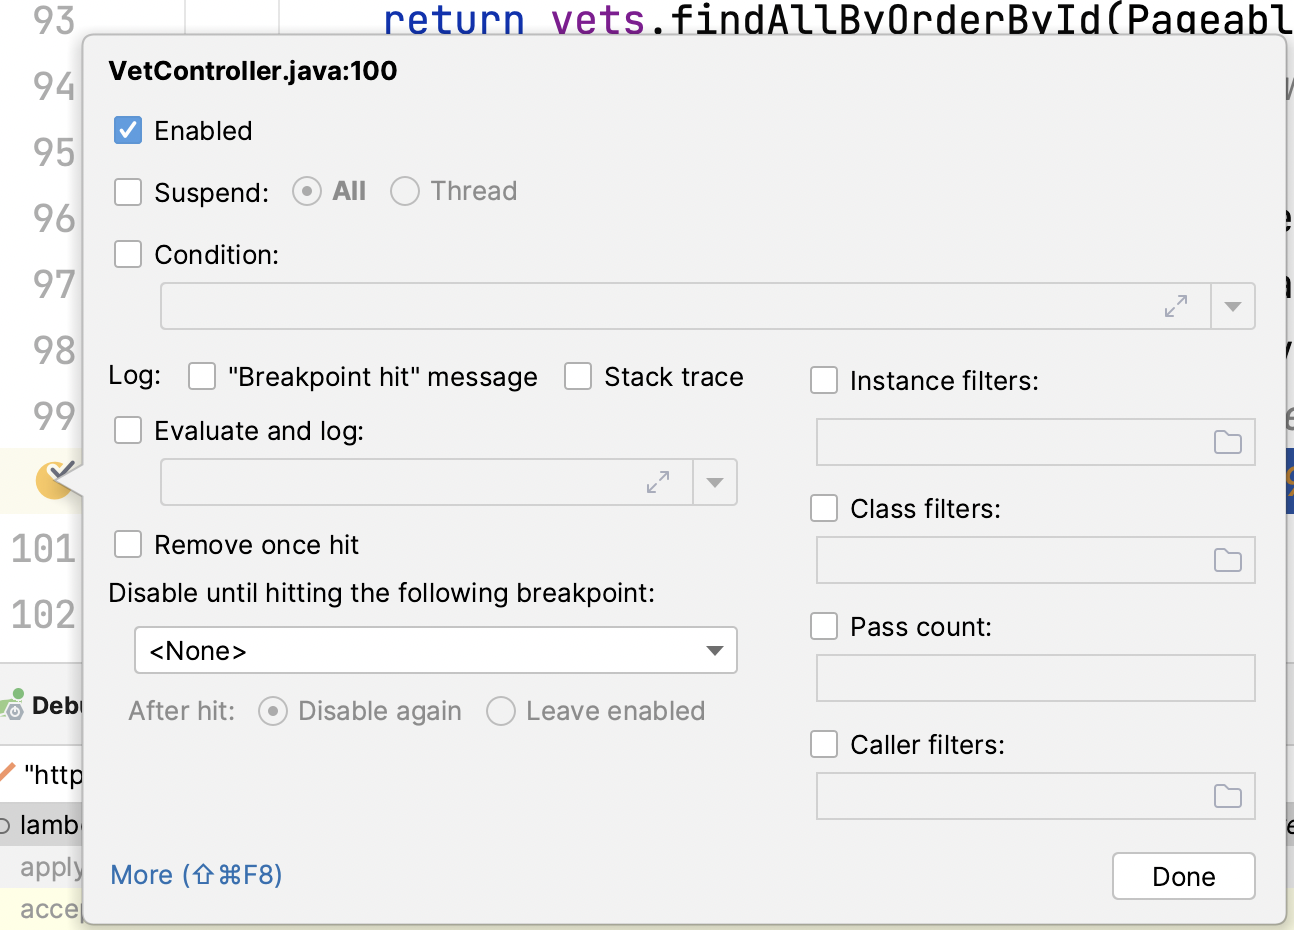
In the image below we can see a breakpoint with the suspend option unchecked which turns it into a non-breaking breakpoint. Notice the breakpoint is in yellow instead of red to show the status. This breakpoint literally does nothing since there are no additional settings. I’ll get back to that…

When we create a “normal” breakpoint it has the side effect of suspending all threads. Debuggers have the ability to disable that feature and effectively create a non-breaking breakpoint. In the interest of completeness they also have the option to suspend only the current thread, this can be helpful when debugging multithreaded code.
When we don’t suspend the current thread, we don’t get that wonderful breakpoint UI we get when suspending the application. That UI isn’t practical since the state of the application has already moved on. So we can’t use that information. Note that developer observability tools grab a snapshot of that information with their non-breaking breakpoints which is why I think the term “snapshot” used by Lightrun makes sense. The IDE doesn’t have that capability. I think that makes sense since such a behavior would differ from the IDEs default behavior and might confuse users.
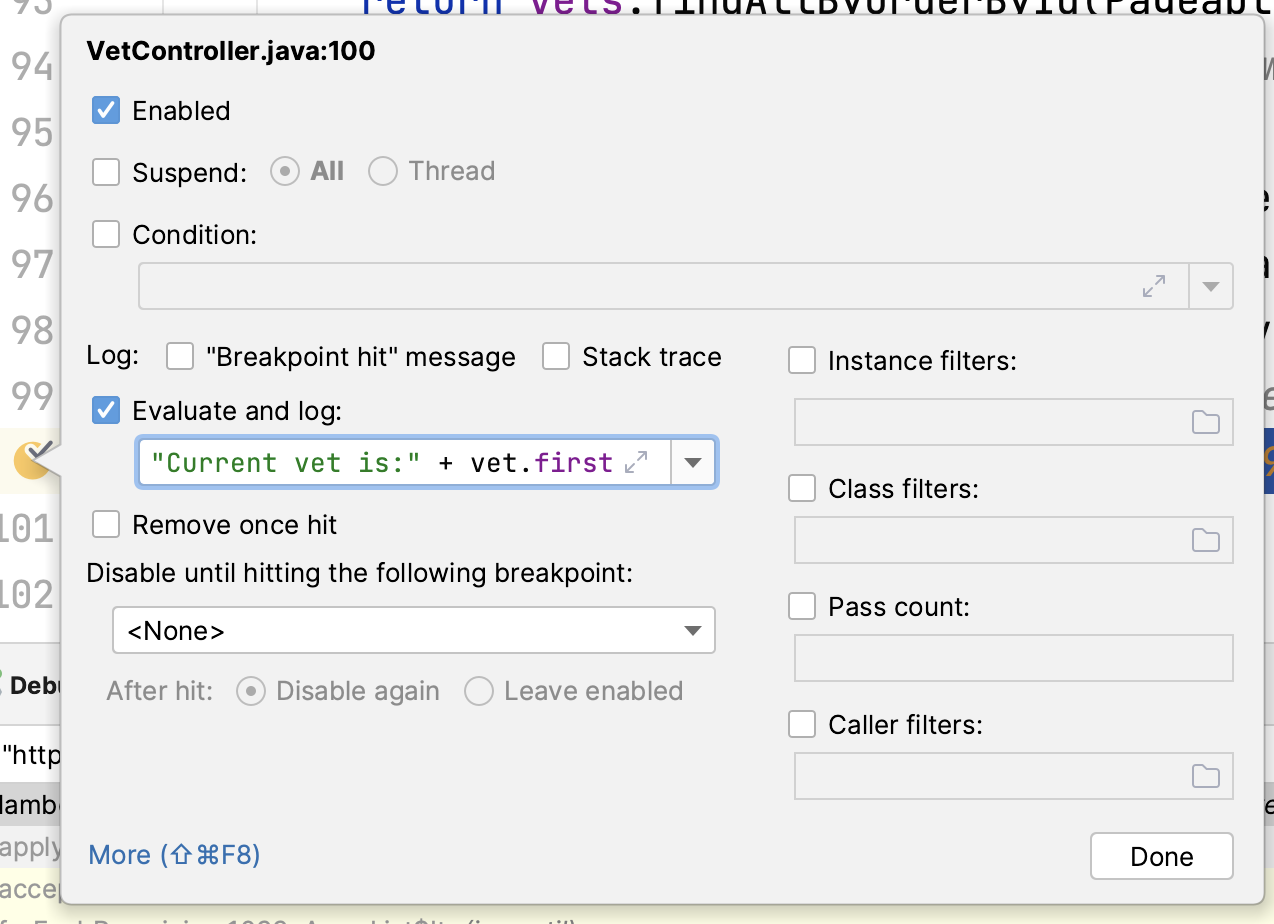
We can’t see the stack trace and the variable values in the IDE watch area. We need to find different ways to extract the information we need from these breakpoints. The most common approach is the tracepoint (AKA Logpoint). The tracepoint lets us add a log to every breakpoint, the log can be as simple as “breakpoint hit” but can also include expressions such as “Reached the method with variable: ” + variableValue. We can see an example of that in the screenshot below.

Beyond Tracepoints
Tracepoints are amazing. If you’re still using printlines when debugging you should take a moment to rethink that and look into tracepoints. Notice that this isn’t a replacement for logging. Logging is permanent and necessary. Printline debugging and tracepoints are ephemeral by default, they need to vanish. Tracepoints do it seamlessly, whereas we often forget printing in the code.
Another significant benefit of tracepoints is conditions. Adding a line of code with a print statement is “no big deal”, but adding it with an if statement sends us down a slippery slope. Tracepoints are breakpoints and breakpoints support conditions. We can define a conditional tracepoint that will only print if a condition is met. This reduces the noise we need to deal with significantly.
We can group tracepoints together, enable and disable them instead of commenting lines in and out. There are so many capabilities that we can leverage to make them more convenient.
One important feature is the stack trace. We can check that flag in the dialog and every time we hit the tracepoint we can see the path. This can get noisy fast. To reduce that noise, we can use caller filters which help us deal with that extra noise. They’re a pretty big feature that I’ll try to get into in a future blog post. The tip of the iceberg is this, you can skip the breakpoint if the call stack includes a specific method (or doesn’t include it). The syntax for the filter is the hard part since it uses JVM internal notations for method signatures with the format packageName.className(paramTypes)returnValueType. It doesn’t use spaces or commas. E.g. this is an exclusion filter for the main method of the PrimeMain class:
-PrimeMain.main([Ljava/lang/String;)V
Yes. I know, it’s tough to read. I’ll try to write about it in a future post if there’s interest. I have a second in my upcoming debugging book that covers that feature.
Disable Until
A cool feature of non-breaking breakpoints is the way in which we can scale them. A normal breakpoint is a pain. You add it and your app stops. So you need to press the continue button repeatedly. With non-breaking you no longer have that problem and you can spread them all over. Here’s a really cool example.
Say we have a process that fails in a weird way but only when the user arrives through method X. When the process is reached via a different route things work as usual. I can add a tracepoint but then I get a lot of noise that I don’t want as I set up everything. Since that process is invoked frequently.
I can add a non-breaking breakpoint to method X. Then in the problematic process I can select that non-breaking breakpoint in the “Disable until hitting the following breakpoint” combo box. This will remove the extra logging/suspending until we’re actually ready for the breakpoint. The cool thing is that we can automatically disable the breakpoint again after it was hit to keep noise to a minimum.
The one thing I wasn’t able to do is change the state easily. I would like to have a tool to count the number of times a method is invoked or the duration it took to execute a method in milliseconds. This isn’t hard with println debugging but isn’t possible with tracepoints as far as I know. It would be great to set a variable to the current time in one tracepoint and print the difference between currentTime and the variable in the second tracepoint.
Finally
The debugger has many hidden gems locked within it. Tracepoints are getting a bit more recognition in recent years. I credit VS code for that. They made it very easy to add logpoints in the IDE UI. They don’t have the other capabilities of the non-breaking breakpoints. But they helped drive the awareness of this feature.
There’s a lot we can do that goes beyond the tracepoint. I hope you keep that in mind for your next debugging session.
Published at DZone with permission of Shai Almog, DZone MVB. See the original article here.
Opinions expressed by DZone contributors are their own.

Comments