What Are Garbage Collection Logs, Thread Dumps, and Heap Dumps?
In this article, take a look at garbage collection logs, thread dumps, and heap dumps.
Join the DZone community and get the full member experience.
Join For Free
Java Virtual Machine (JVM) generates 3 critical artifacts that are useful for optimizing the performance and troubleshooting production problems. Those artifacts are:
- Garbage collection (GC) log
- Thread Dump
- Heap Dump
In this article, let's try to understand these 3 critical artifacts, where to use them, how do they look, how to capture them, how to analyze them, and their differences.
1. Garbage Collection Log
a) What Is a GC Log?
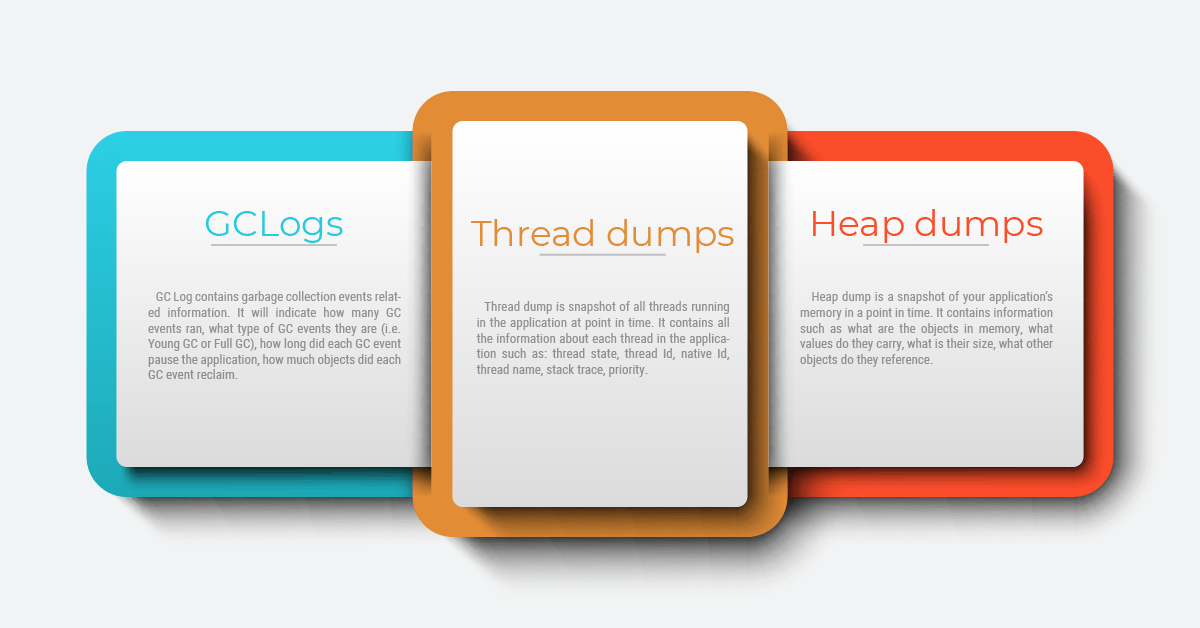
GC Log contains garbage collection events related information. It will indicate how many GC events ran, what type of GC events they are (i.e. Young GC or Full GC), how long each GC event pause the application, how much objects did each GC event reclaim.
b) What Does a GC Log Look Like?
Sample garbage collection log file can be found here.
c) Where Are GC Logs Used?
Garbage collection logs are used to study the application’s GC and memory performance. It’s used to optimize the GC pause times, it’s used to identify optimal memory size for your application, it’s also used to troubleshoot memory-related problems.
d) How to Generate a GC Log?
You can generate garbage collection logs by passing the following JVM arguments:
For Java versions until 8:
xxxxxxxxxx
-XX:+PrintGCDetails
-XX:+PrintGCDateStamps
-Xloggc:<file-path>
For Java version starting from 9:
xxxxxxxxxx
-Xlog:gc*:file=<file-path>
file-path: is the location where Garbage Collection log file will be written.
e) How to Understand a GC Log?
Garbage collection log format varies depending on who is your JVM vendor (Oracle, HP, IBM, Azul, ..), Java version (1.5, 5, 6, 7, 8, 9, 10, 11, 12,…), garbage collection algorithm (Serial, Parallel, CMS, G1, Shenandoah, Z GC) and JVM arguments you pass. Thus there is not one standardized format available. However here is a video tutorial, which attempts to help you to understand the GC log file format.
f) What Tools Are Used to Analyze a GC Log?
There are multiple Garbage collection log analysis tools. Some of the popular ones are given here: GCeasy, IBM GC & Memory visualizer, HP JMeter, Google Garbage Cat
2. Thread Dump
a) What Is a Thread Dump?
A thread dump is a snapshot of all threads running in the application at a point in time. It contains all the information about each thread in the application such as thread state, thread Id, native Id, thread name, stack trace, and priority.
b) What Does a Thread Dump Look Like?
A sample thread dump can be found here.
c) Where Is a Thread Dump Used?
Thread dumps are primarily used for troubleshooting production problems such as CPU spikes, unresponsiveness in the application, poor response time, hung threads, high memory consumption.
d) How to Generate a Thread Dump?
Thread dumps can be captured from the running application using 8 different options. The most common option to take thread dump is to use the ‘jstack’ tool. jstack tool is shipped in JDK_HOME\bin folder. Here is the command that you need to issue to capture thread dump:
jstack -l <pid> > <file-path>
where
pid: is the Process Id of the application, whose thread dump should be captured
file-path: is the file path where thread dump will be written in to.
e) How to Understand a Thread Dump?
Here is a video talk that gives a good detailed overview on how to understand the thread dumps.
f) What Tools Are Used to Analyze a Thread Dump?
Here are the most widely used thread dump analysis tools: fastThread, Samurai, IBM Thread & Monitor analyzer, Visual VM
3. Heap Dump
a) What Is a Heap Dump?
A heap dump is a snapshot of your application’s memory in a point in time. It contains information such as what are the objects in memory, what values do they carry, what is their size, what other objects do they reference.
b) What Does a Heap Dump Look Like?
A sample heap dump can be found here. (Note: It is going to be in binary format. So you actually can’t read it).
c) Where Is a Heap Dump Used?
Heap dumps are primarily used for troubleshooting memory related, OutOfMemoryError problems.
d) How to Generate a Heap Dump?
Heap dump can be captured from the running application using 7 different options. Most common option to take heap dump is to use the ‘jmap’ tool. jmap tool is shipped in JDK_HOME\bin folder. Here is the command that you need to issue to capture:
xxxxxxxxxx
jmap -dump:format=b,
file=<file-path> <pid>
where
pid: is the Java Process Id, whose heap dump should be captured
file-path: is the file path where heap dump will be written in to.
e) How to Understand a Heap Dump?
Heap dump files are in binary format and tend to be large in size. Besides that, their format heavily lacks documentation. Thus, you have to use the heap dump analysis tools (given in next question) to analyze and understand them.
f) What Tools Are Used to Analyze a Heap Dump?
Here are the most widely used heap dump analysis tools: Eclipse MAT, HeapHero, JVisualVM.
Opinions expressed by DZone contributors are their own.

Comments