Ulyp: Recording Java Execution Flow for Faster Debugging
The article introduces Ulyp, an agent that can record the Java/Kotlin app execution flow. The tool can help understand code faster and debug more efficiently.
Join the DZone community and get the full member experience.
Join For FreeThe article presents Ulyp, which is an open-source instrumentation agent that records method calls (including arguments and return values) of all third-party libraries of JVM apps. Software engineers can later upload a recording file to the UI desktop app in order to better understand the internals of libraries and even all the applications. The tool can help developers understand the internals of frameworks faster, gain deeper insights, find inefficiencies in software, and debug more effectively.
In a few words, Ulyp allows to run this code, which sets up a database source, a cache over the source, and then queries the cache:
// a database source (backed by H2 database)
DatabaseJDBCSource source = new DatabaseJDBCSource();

// build a cache
LoadingCache<Integer, DatabaseEntity> cache = Caffeine.newBuilder()
		.maximumSize(10_000)
        .expireAfterWrite(Duration.ofMinutes(5))
        .refreshAfterWrite(Duration.ofMinutes(1))
        .build(source::findById);

DatabaseEntity fromCache = cache.get(5); // get from the cache
And extract the execution flow information:
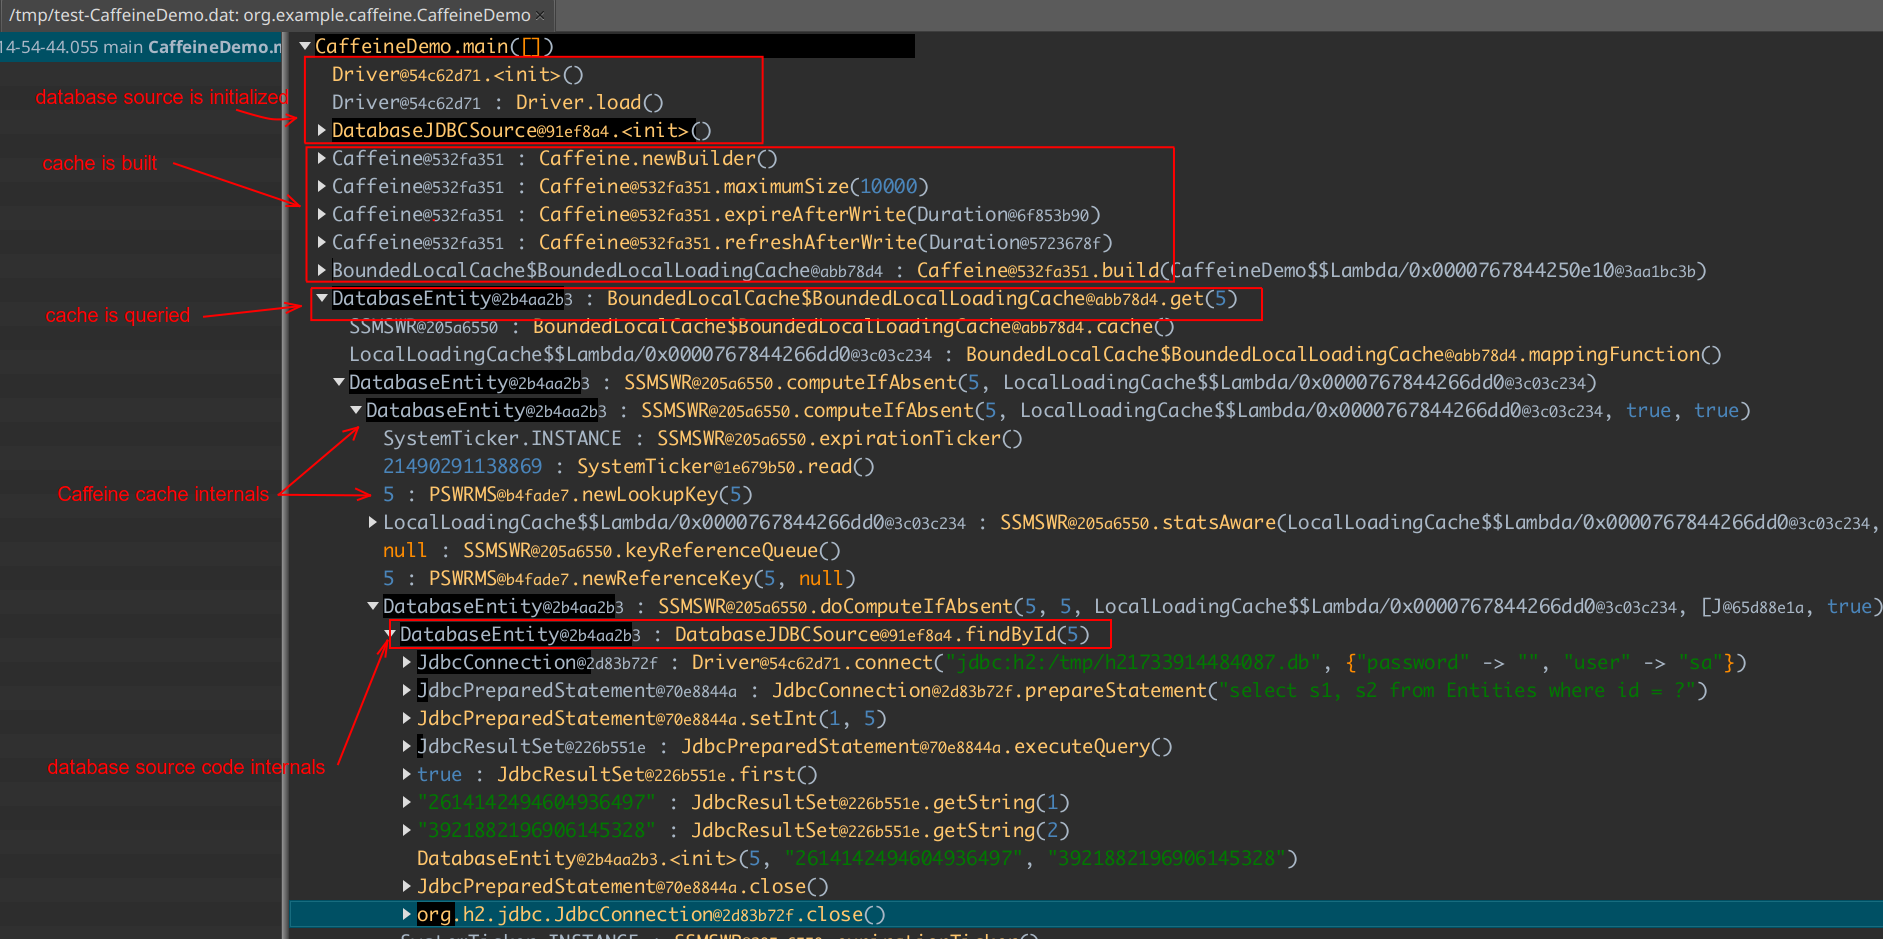
Take a minute to get an understanding of what you see. That's a call tree of all methods. We also captured object values and their identity hash codes. Read further if you want to know how Ulyp is implemented inside. The article also provides several examples of using the agent.
Challenges in Software Engineering
The scale of software solutions is nowhere near close to its state years ago. Typical apps may have hundreds of instances running across multiple availability zones. The number of frameworks and libraries used as a dependency in a typical app is also higher than it was before. That is not to say that those frameworks may be gigantic.
Working on large codebases with hundreds of thousands of lines of code is not an easy task. In many situations, such codebases have developed over a long period, and we might have access to only a few experts with a detailed understanding of the entire codebase. In enterprise applications, the absence or scarcity of developer documentation is a common issue. In such situations, onboarding a new engineer is more than challenging.
An average engineer spends way more time reading code than writing it. Understanding how libraries and frameworks work inside and what they do is extremely vital for successful Java software engineers since it allows them to write more robust and performant code.
Another problem is debugging a running instance of an application in some environment where a classic debugger might not be available. Usually, it’s possible to use logs and APM tracers, but these tools might not always suffice the needs.
One possible way to alleviate some of these problems is code execution recording. The idea is by far not new, as there are already dozens of time-travel debuggers for different languages. This effectively eliminates the need for breakpoints in certain cases, as a software engineer can just observe the whole execution flow. It’s also feasible to record the execution in several apps simultaneously via remote control. This allows us to record what happened in a distributed environment.
Technical Design
Ulyp is an instrumentation agent written specifically for this task. Recording all function calls along with return values and arguments is possible thanks to JVM bytecode instrumentation. Bytecode instrumentation is a technique used to modify the bytecode of a Java application at runtime. It essentially means we can change the code of the Java app after it has started. Currently, Ulyp uses a byte-buddy library, which does an immense job of handling all the work of instrumentation and makes it extremely easy for the entire Java community.
One thing byte-buddy allows users to do is to define an advice containing code to wire into methods. Here is an example of such advice:
public class MethodAdvice {

    @Advice.OnMethodEnter
    static void enter(
            @Advice.This(optional = true) Object callee,
            @Advice.AllArguments Object[] arguments) {
        ... agent code here
    }

    @Advice.OnMethodExit
    static void exit(
            @Advice.Thrown Throwable throwable,
            @Advice.Return Object returnValue) {
        ... agent code here
    }
}
Every bytecode instruction of the code inside methods is copied to instrumented methods. The agent is free to access references to the object being called (if the method is not static), arguments, return values as well as exceptions thrown out of the method. Our goal is to instrument all third-party library methods to capture their arguments and return values.
After instrumentation is done, the agent can essentially intercept method calls. However, we should be really careful when intercepting code. If we do something heavy, we may slow down client app threads. If we do something dangerous (which may throw an exception), the client app may even break.
That's exactly why recording most arguments and return values is done in the background thread. It works simply because most objects are either:
- Immutable; or
- We record only their class name and identity hash code.
Other objects like collections and arrays are recorded in client app threads. There are usually not so many such objects recorded, so it's not a big issue. Besides, recording collections and arrays is disabled by default and can only be enabled by a user.
When capturing argument values, Ulyp uses special recorders. Recorders encode objects into bytes, and the UI app decodes these bytes to show object values to the user. At first glance, they look like common serializers. But unlike serializers, recorders do not capture the exact state of objects. For example, Ulyp only captures the first 200 symbols of String instances (this is configurable).
Every thread gathers recording events in special thread-local buffers. Buffers are posted to the background thread, which encodes all events into bytes. Bytes are written to the file which is specified by user.
All data is dumped to the file a user-specified via system properties. There are auxiliary threads that do the job of converting objects to binary format and writing to file. The resulting file can later be opened in UI app and entire flow can be analyzed.
Enough of talk, let's dive into the examples of Ulyp usages.
Example 1: Jackson
We start from the simplest example of how we can use Ulyp by looking into Jackson, the most well-known library for JSON parsing in Java ecosystem. While this example does not provide any interesting insights, we still can see how a recording debugger can help us to look really quick into a third party library internals.
The demo is quite simple:
import com.fasterxml.jackson.core.JsonProcessingException;
import com.fasterxml.jackson.databind.ObjectMapper;

import java.util.List;

public class JacksonDemo {

    static class Person {
        private String firstName;
        private String lastName;
        private int age;
        private List<String> hobbies;
      	...
    }

    public static void main(String[] args) throws JsonProcessingException {
        ObjectMapper objectMapper = new ObjectMapper();
        String text = "{\"firstName\":\"Peter\",\"lastName\":\"Parker\",\"age\":20,\"hobbies\":[\"Photo\",\"Jumping\",\"Saving people\"]}";

        System.out.println(objectMapper.readValue(text, Person.class));
        System.out.println(objectMapper.readValue(text, Person.class));
    }
}
We call the readValue twice, since the first call is heavier, as it includes lazy initialization logic inside the object mapper. We will see it shortly.
If we want to use Ulyp, we just specify system properties as follows:
--add-opens
java.base/java.lang=ALL-UNNAMED
--add-opens
java.base/java.lang.invoke=ALL-UNNAMED
-javaagent:~/ulyp-agent-1.0.1.jar
-Dulyp.methods=**.ObjectMapper.readValue
-Dulyp.file=~/jackson-ulyp-output.dat
-Dulyp.record-constructors
-Dulyp.record-collections=JDK
-Dulyp.record-arrays
We add --add-opens props for our code to work properly on Java 21. Next, we specify the path to agent itself. ulyp.methods property allows specifying when recording should start. In this scenario, we record ObjectMapper's method, which calls for parsing text into objects.
Then, we set the output file where Ulyp should dump all recording data and props which configure Ulyp to record some collection elements (only standard library containers like ArrayList or HashMap) and arrays, as well as record constructors calls. The prop names are pretty much self-explanatory.
Once the program finishes, we can upload the output file to the UI. When we do this, we see the following picture:
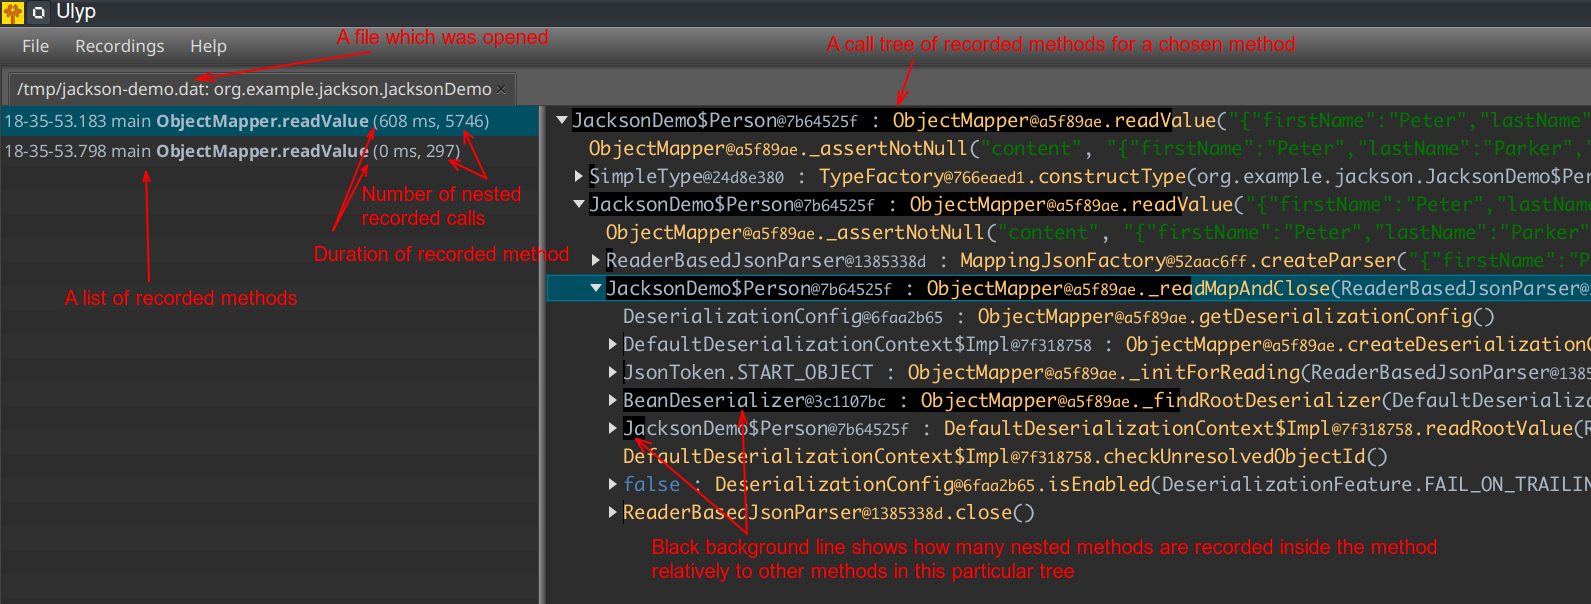
There is a list of recorded methods on the left-hand side. We are able to observe the duration and number of nested calls for every recorded method. We can see the call tree on the right side. Every recorded method call is marked with black line which hints how many nested calls are inside, so that we can dive into the heaviest methods that contain more logic.
If we choose the second method, we will see that the call tree has much fewer nested calls. In fact, it has only 300 calls, while the first method call has 5700! If we dive deep, we will soon get the idea why it's happening.

In the first call tree, _findRootDeserializer has a lot of nested calls, while in the second call tree, it doesn't. We can easily guess that this is due to the deserializer instance being cached inside.
If we dive deeper, we can observe how the framework does its job in subtle details. For example, we can spot that it processes JSON entry with key firstName and the value is Peter. StringDeserializer is used for parsing value from JSON text.
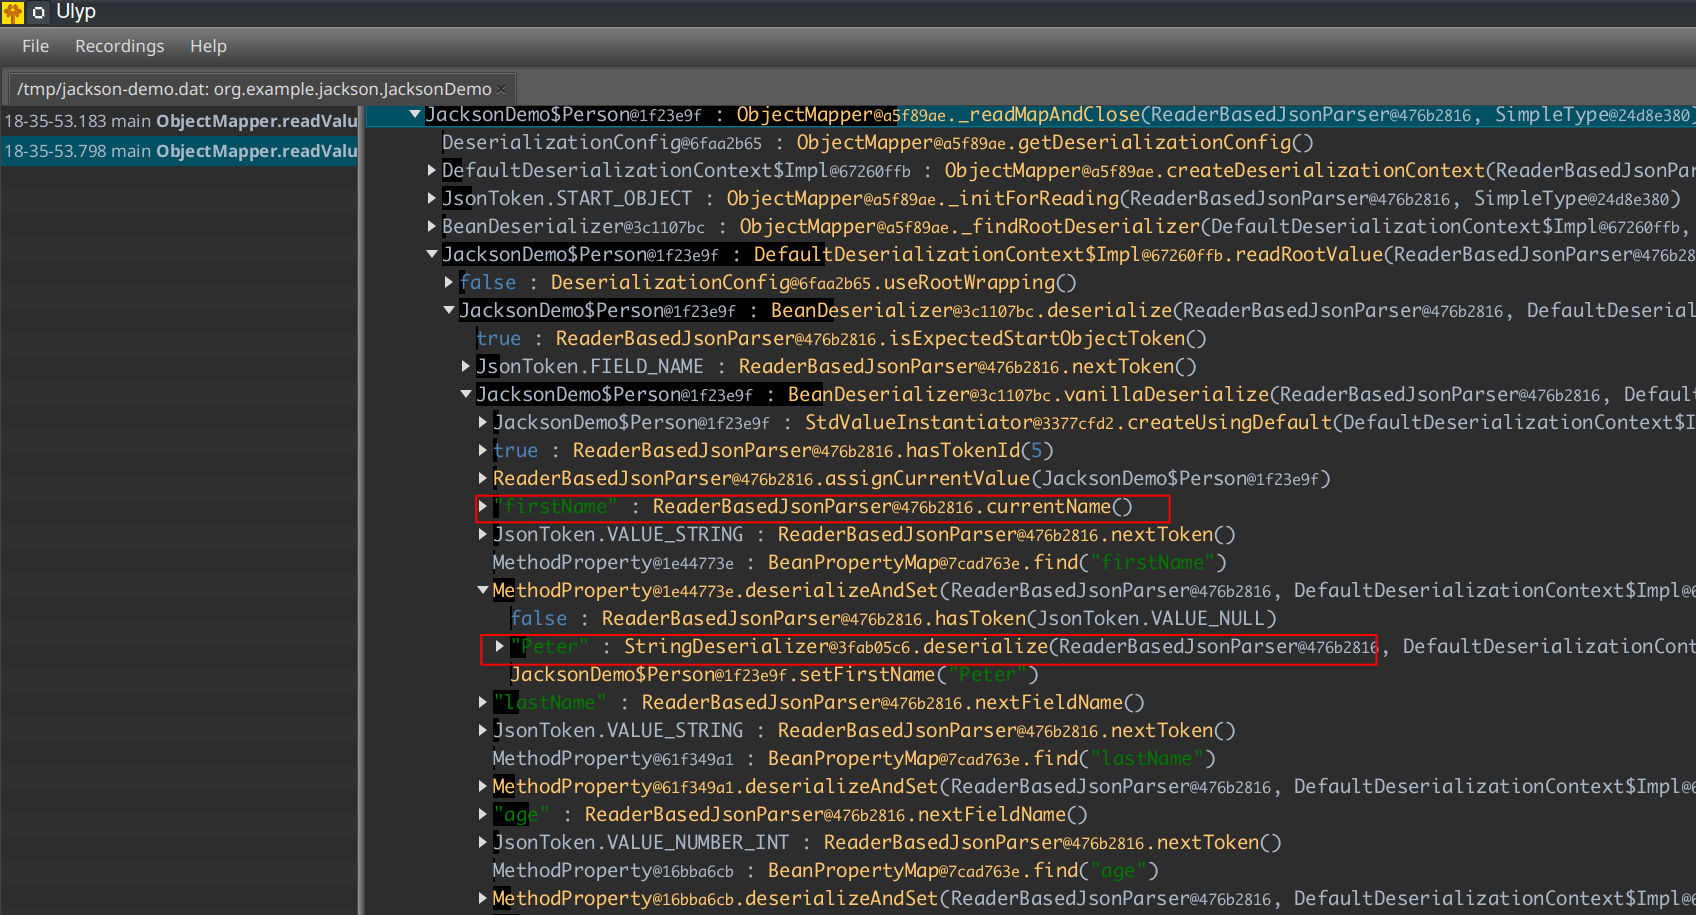
We now have some understanding of how the tool works. However, this example doesn't show anything interesting in particular. Let's now move to something more interesting then.
Example 2: Spring Proxy
In the second example, we will look into how Spring implements proxies. Spring uses Java annotations to augment the logic of desired beans. The most common example is @Transactional annotation, which allows our method to be executed inside transaction. If one doesn't know how it works, it looks like magic to them since the only thing you do is place an annotation on the class.
That's exactly what we have in our example where we have an empty method and the class is marked with the annotation:
@Component
@Transactional
public class ExampleService {

    public void test() {
        System.out.println("hello");
    }
}
But how exactly does Spring start transactions? Let's find out. We are going to setup a simple demo as follows:
public class SpringProxyDemo {

    public static void main(String[] args) {
        ApplicationContext context = new AnnotationConfigApplicationContext(Configuration.class);
        ExampleService service = context.getBean(ExampleService.class);
        service.test();
    }
}
So, we just get the bean from the context and then call the method. It should start a transaction, right? Let's find out. We are going to do exactly the same as before. We just run our code with system props that enable Ulyp. When we open the resulting file in UI, we see this:

What we see is our service class name looks weird. What is this ExampleService$$EnhancerBySpringCGLIB$$af4abd82 classname? Turns out, that's how Spring actually implements proxying. So, when we call context.getBean(...), we actually get an instance of a different class. Let's dig deeper.
If we expand the call tree, we can observe all major points that make the proxy work.
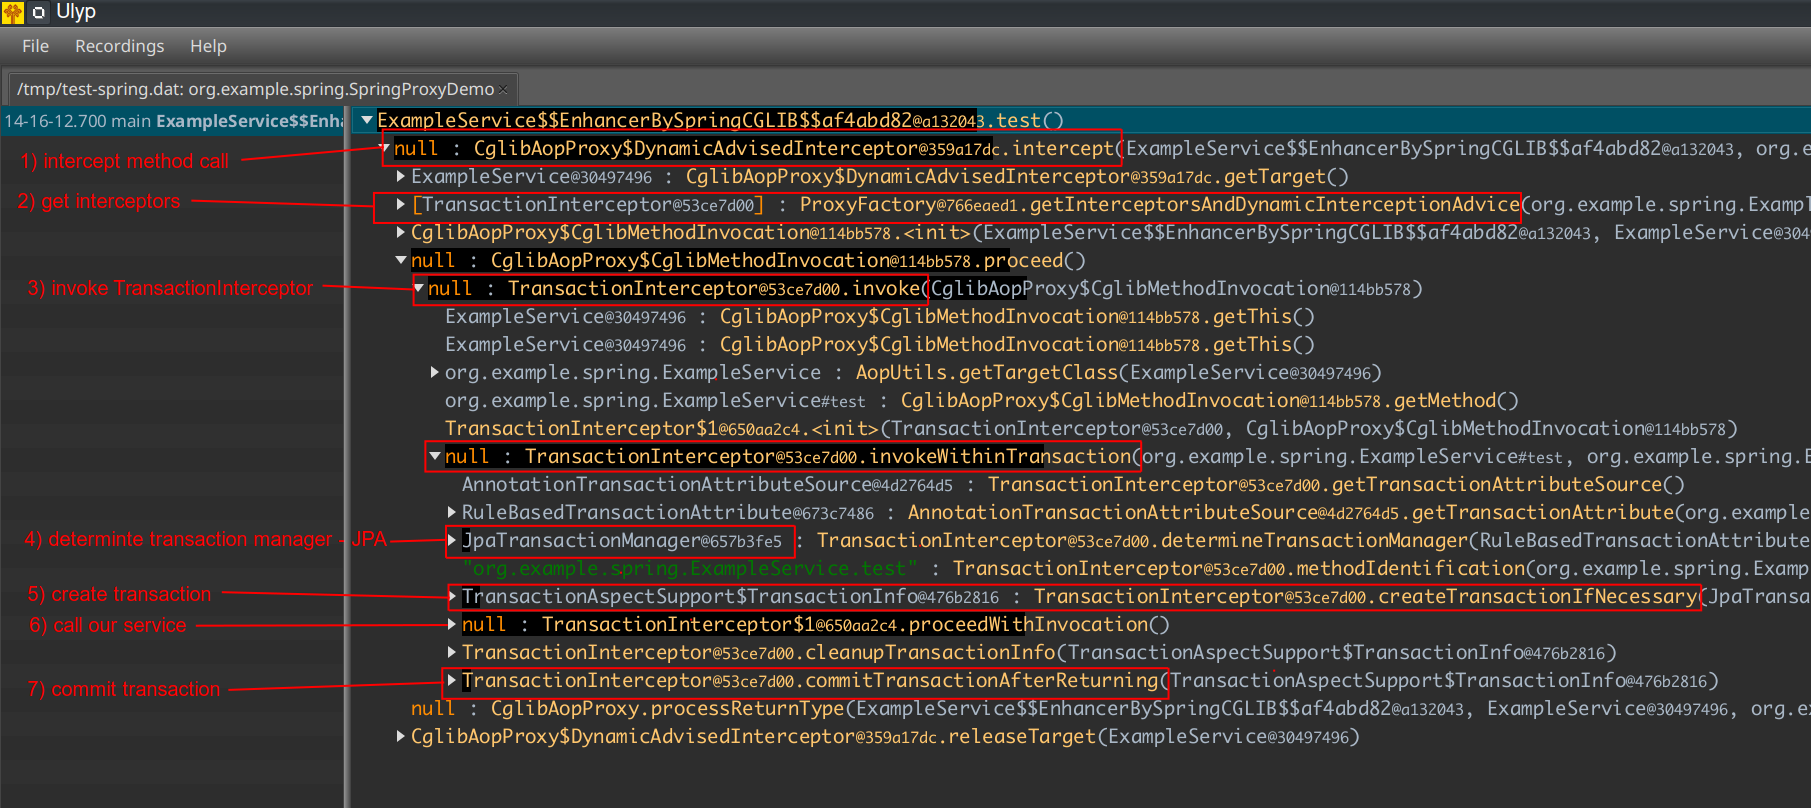
First, DynamicAdvisedInterceptor is called, which determines a set of interceptors for the method. It returns an array with one element, which is an instance of TransactionInterceptor. You can guess, TransactionInterceptor is responsible for opening and commiting a transaction. That's exactly what we see it is doing in our case. It first determines a transaction manager.
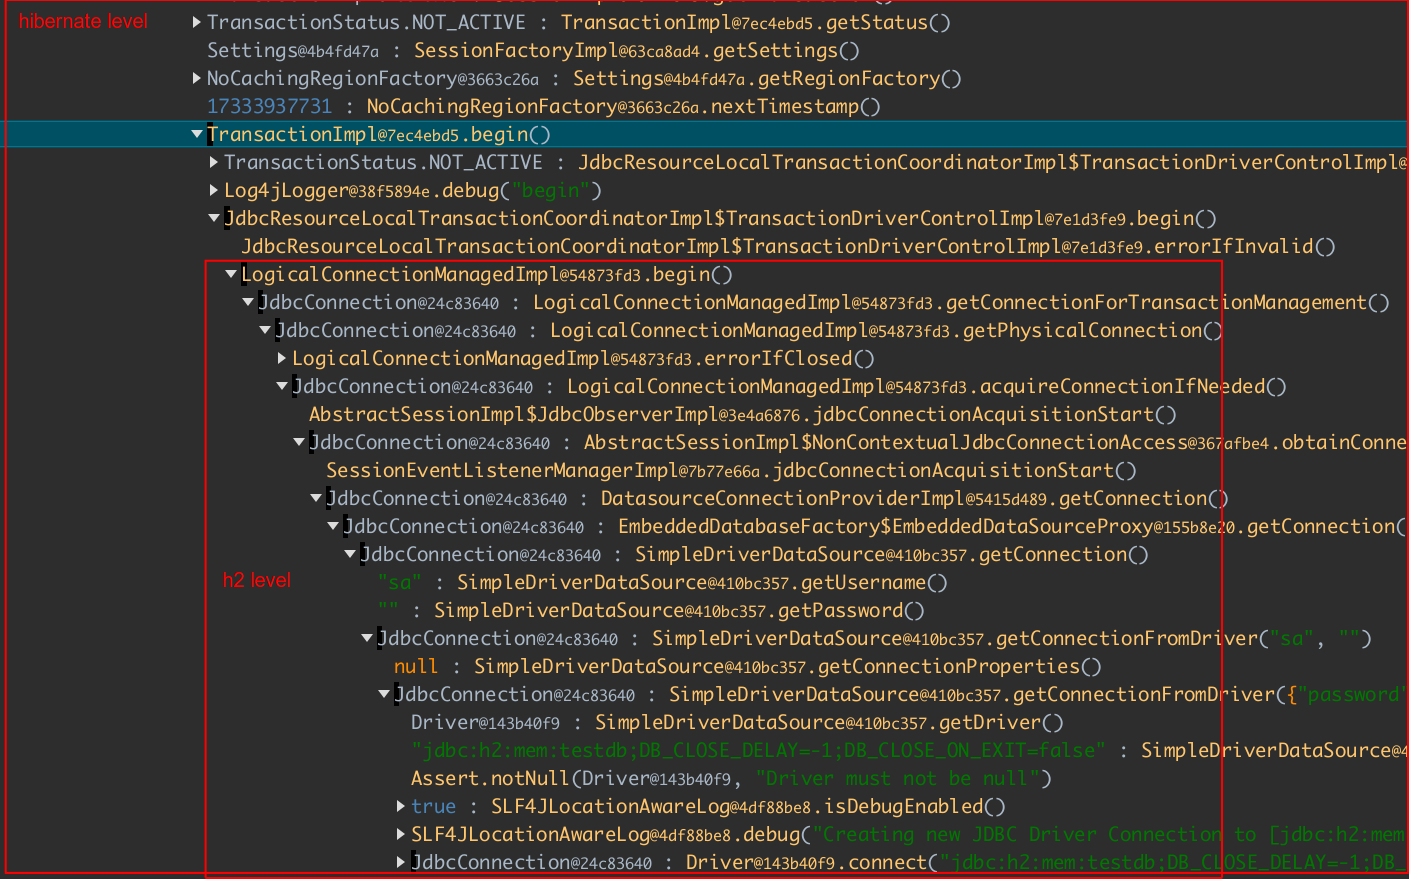
JpaTransactionManager is configured in our demo, so we are dealing with JPA transactions. We then can observe how a transaction is opened and committed. It's committed after proceedWithInvocation is called, which calls our service inside.
We could dive deeper if we wanted. Just expand a method that creates a transaction, and you can easily navigate down to the Hibernate and H2 (database) levels!
What About Kotlin?
Java is not the only JVM-based language. The other popular one would be Kotlin. It would be nice to have support for it, right? Thankfully, bytecode instrumentation is available for any JVM-based language, and byte-buddy handles Kotlin instrumentation as well. To verify this, I decided to toy around with kotlin-ktor-exposed-starter. This example repo features some popular Kotlin libraries like exposed and ktor, so we have a chance to test how recording works.
We jump straight to recorded methods of the WidgetService class, which loads widgets from the database. The call tree has a lot of calls to Kotlin standard library, which were invisible for us when we code (marked with red):
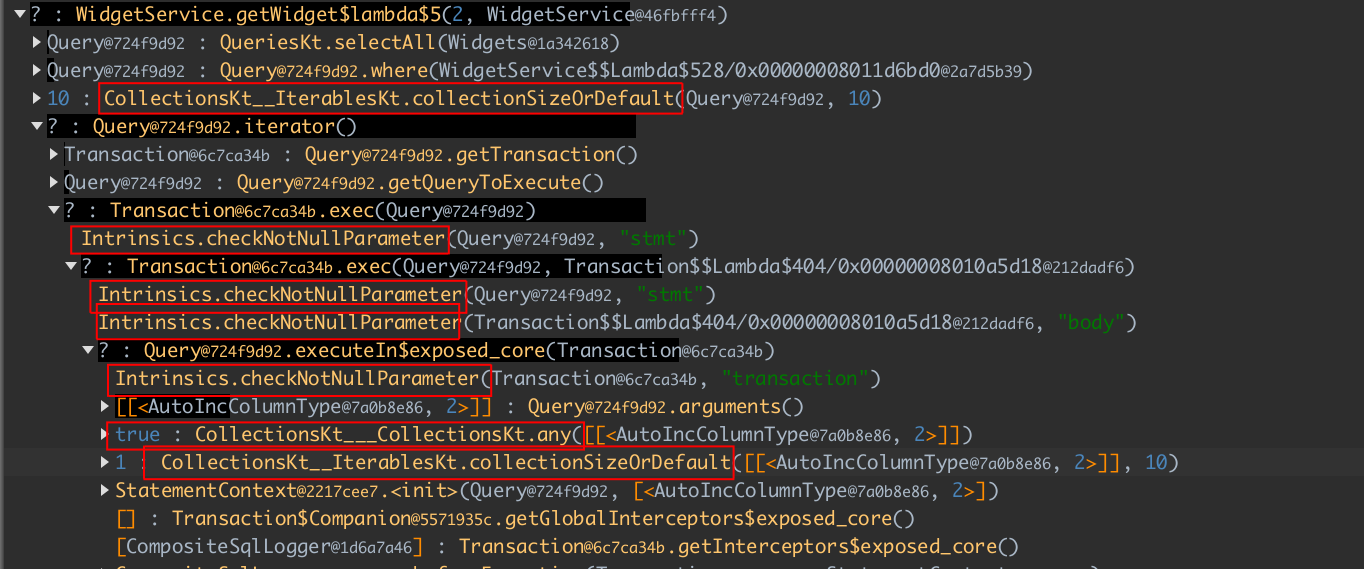
Thankfully, Ulyp comes with property ulyp.exclude-packages which can disable instrumentation for certain packages. So, if we run an app with -Dulyp.exclude-packages=kotlin, we can observe that we no longer see these methods.
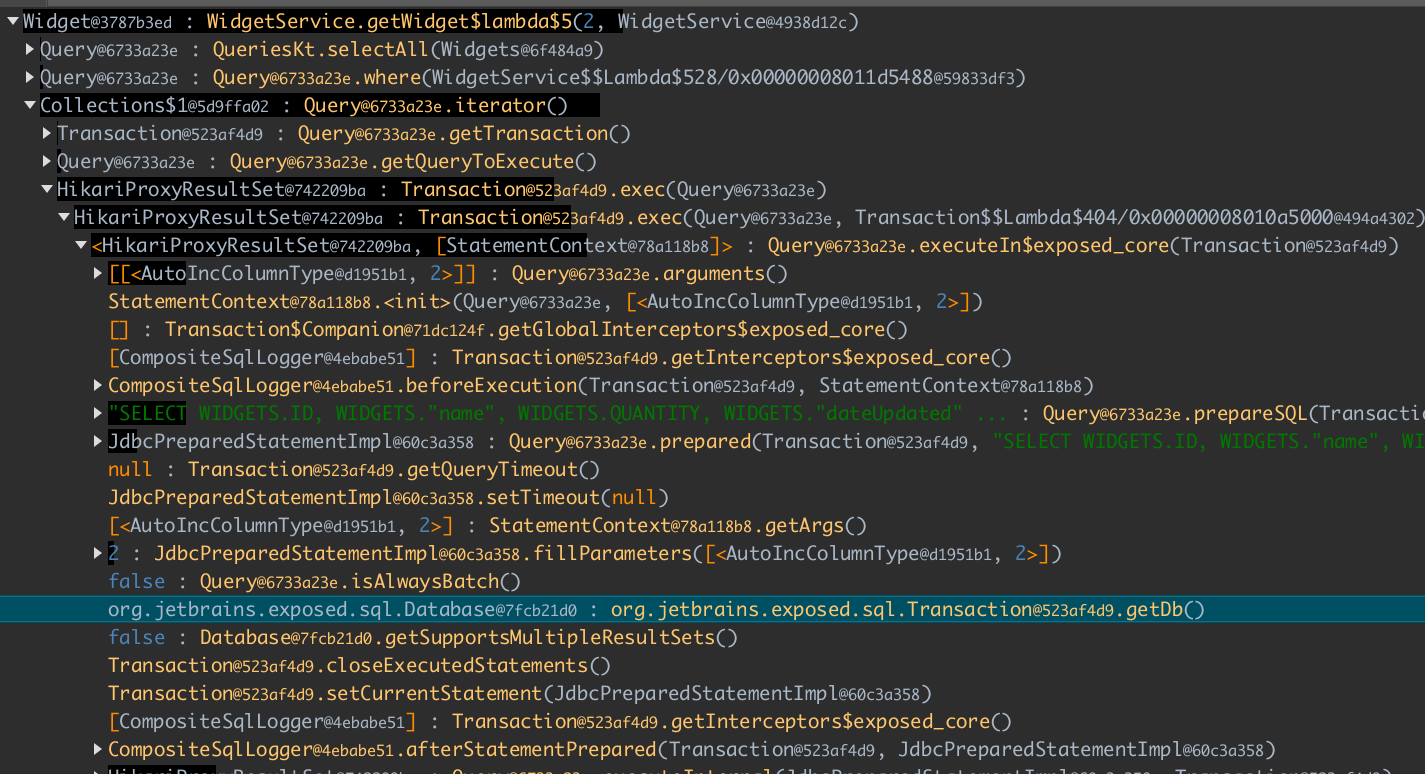
Second, we can toggle Kotlin collection recording with -Dulyp.record-collections=JDK,KT. An additional option "KT" activates recording of collections which are part of Kotlin standard library. Overall, the picture is more nice and clear now:
How Much Does It Cost?
Performance
Instrumentation overhead is quite severe, which can slow down app startup by several times. Recording overhead also slows down the execution. The overhead depends on the app type. For typical Java app, the slowdown is somewhat about x2-x5. For CPU-intensive apps, the overhead can be even larger. Overall, from my experience, it's not that scary, and you can trace and record even real-time apps provided that you run them locally or in the development environment.
Memory
Currently, Ulyp doesn't consume much memory in the heap. However, Ulyp can double-code cache usage. For gigantic apps, code cache tuning may be required. See the link above for more information on how to change the code cache size. If the software is launched locally, it's not required anyway.
Conclusion
This is the most simple demo for using Ulyp. There are also different examples of using it which may be covered in separate articles.
Ulyp doesn’t try to solve all the existing problems and it’s definitely not a silver bullet. The overhead of instrumenting could be quite high. You might now want to run it on production environment, but dev/test are usually ok. But if one can run their software app locally or on dev environment, it opens the opportunity to see things at completely different angle.
To sum it up, let's highlight cases where Ulyp can help:
- Project onboarding: A software engineer is able to record and analyze the whole execution flow for entire app.
- Debug code: A software engineer can understand what library is doing in mere minutes. This might be beneficial if an engineer works with third-party libraries.
- Tracing a set of apps running somewhere in cloud at once: I.e. debugging a distributed system. This is a tricky case which will be covered in a separate article.
Using such tool can sometimes be not so good idea. Such cases include:
- Using the tool on production environment: This is quite straightforward. Anyway, Just don't.
- Performance sensitive workload: The overhead of recording could be quite high. Typical enterprise app is several times slower while being recorded. With CPU-bound Java apps it is even worse. However, nothing really stops us from using the tool on performance sensitive app if your goal is debugging.
Thanks for reading.
Opinions expressed by DZone contributors are their own.

Comments