Understanding Root Causes of Out of Memory (OOM) Issues in Java Containers
Explore the various types of out-of-memory errors that can happen in Java container applications and discuss methods to identify their root causes.
Join the DZone community and get the full member experience.
Join For FreeOut-of-memory errors in containerized Java applications can be very frustrating, especially when happening in a production environment. These errors can happen for various reasons. Understanding the Java Memory Pool model and different types of OOM errors can significantly help us in identifying and resolving them.
1. Java Memory Pool Model
Java Heap
Purpose
Java heap is the region where memory is allocated by JVM for storing Objects and dynamic data at runtime. It is divided into specific areas for efficient memory management (Young Gen, Old Gen, etc.). Reclamation of memory is managed by the Java GC process.
Tuning Parameters
-
-Xmx -Xms
Class Loading
Purpose
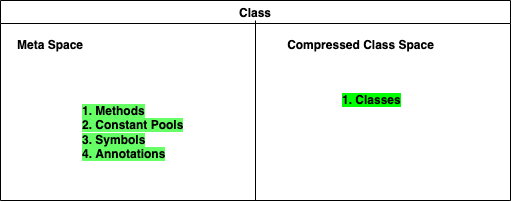
This memory space stores class-related metadata after parsing the classes. The figure below shows the two sections in the Class Related Memory pool.

These 2 commands can give the class-related stats from JVM:
jcmd <PID> VM.classloader_stats
jcmd <PID> VM.class_stats
Tuning Parameters
-XX:MaxMetaspaceSize-XX:CompressedClassSpaceSize-XX:MetaSpaceSize
Code Cache
Purpose
This is the memory region that stores compiled native code generated by the JIT compiler. This serves as a cache for frequently executed byte code that is compiled into native machine code. Frequently executed byte code is referred to as hotspot. It is for improving the performance of the Java application.
This area includes JIT-Compiled Code, Runtime Stubs, Interpreter Code, and Profiling Information.
Tuning Parameters
-XX:InitialCodeCacheSize-XX:ReservedCodeCacheSize
Threads
Purpose
Each thread has its own memory. The purpose of this memory area is to store method-specific data for each thread.
- Examples: Method Call Frames, Local Variables, Operand Stack, Return Address, etc.
Tuning Parameters
-Xss
Symbols
Purpose
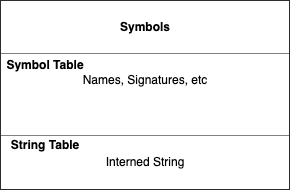
Symbols are represented as shown in the figure below:

Tuning Parameters
-XX:StringTableSize- Also, the following command will give Symbols-related statistics:
jcmd <PID> VM.stringtable | VM.symboltable
Other Section
Purpose
This is to bypass the heap to allocate faster off-heap memory. They are primarily used for efficient low-level I/O operations; mostly applications with frequent data transfers.
There are 2 ways you can access Off-Heap memory:
- Direct Byte Buffers
- Unsafe.allocateMemory
Direct ByteBuffers
ByteBuffers can be allocated through ByteBuffer.allocateDirect. Reclamation of direct ByteBuffers is through GC.
- Tuning parameter
-XX:MaxDirectMemorySize
FileChannel.map
This is used to create a memory-map file that allows direct memory access to file contents by mapping a region of a file into the memory of the Java process.
- Tuning parameter:
- Memory is not limited and not counted in NMT (Native Memory Tracking tool).
NMT is a tool available for tracking the Memory pools allocated by JVM. Below is a sample output.
-                 Java Heap (reserved=2458MB, committed=2458MB)
                            (mmap: reserved=2458MB, committed=2458MB)

-                     Class (reserved=175MB, committed=65MB)
                            (classes #11401)
                            (  instance classes #10564, array classes #837)
                            (malloc=1MB #27975)
                            (mmap: reserved=174MB, committed=63MB)
                            (  Metadata:   )
                            (    reserved=56MB, committed=56MB)
                            (    used=54MB)
                            (    free=1MB)
                            (    waste=0MB =0.00%)
                            (  Class space:)
                            (    reserved=118MB, committed=8MB)
                            (    used=7MB)
                            (    free=0MB)
                            (    waste=0MB =0.00%)

-                    Thread (reserved=80MB, committed=7MB)
                            (thread #79)
                            (stack: reserved=79MB, committed=7MB)

-                      Code (reserved=244MB, committed=27MB)
                            (malloc=2MB #8014)
                            (mmap: reserved=242MB, committed=25MB)

-                        GC (reserved=142MB, committed=142MB)
                            (malloc=19MB #38030)
                            (mmap: reserved=124MB, committed=124MB)

-                  Internal (reserved=1MB, committed=1MB)
                            (malloc=1MB #4004)

-                     Other (reserved=32MB, committed=32MB)
                            (malloc=32MB #37)

-                    Symbol (reserved=14MB, committed=14MB)
                            (malloc=11MB #140169)
                            (arena=3MB #1)
2. Types of OOM Errors and Root Cause
In Java, OOM occurs when JVM runs out of memory for Object/Data structure allocation. Below are the different types of OOM errors commonly seen in Java applications.
Java Heap Space OOM
This happens when the heap memory is exhausted.
Symptoms
java.lang.OutOfMemoryError: Java heap space
Possible Causes
- Application has genuine memory needs.
- Memory leaks because the application is not releasing the objects.
- GC tuning issues
Tools
- Jmap to collect the heap dump
- YourKit/VisualVM/Jprofiler/JFR to profile the heap dump for large Objects and non-GCed Objects
Metaspace OOM
This happens when allocated MetaSpace is not sufficient to store class-related metadata. For more information on MetaSpace, refer to the Java Memory Pool model above. From Java 8 onwards, MetaSpace is allocated on the native memory and not on the heap.
Symptoms
java.lang.OutOfMemoryError: Metaspace
Possible Causes
- There are a large number of dynamically loaded classes.
- Class loaders are not properly garbage collected, leading to memory leaks.
Tools
- Use profiling tools such as VisualVM/Jprofiler/JFR to check for excessive class loading or unloading.
- Enable GC logs.
GC Overhead Limit Exceeded OOM
This error happens when JVM spends too much time on GC but reclaims too little space. This occurs when the heap is almost full and the garbage collector can't free much space.
Symptoms
java.lang.OutOfMemoryError: GC overhead limit exceeded.
Possible Causes
- GC tuning issue or wrong GC algorithm is chosen
- Genuine application requirement for more heap space
- Memory leaks: Objects in the heap are retained unnecessarily.
- Excessive logging or buffering
Tools
-
Use the profiling tool to analyze the heap dump
- Enable GC logs
Native Memory OOM /Container Memory Limit Breach
This mostly happens when application/JNI/JVM/third-party libraries try to use native memory. This error involves native memory, which is managed by the operating system, and is used by the JVM for other than heap allocation.
Symptoms
java.lang.OutOfMemoryError: Direct buffer memoryjava.lang.OutOfMemoryError: Unable to allocate native memoryCrashes with no apparent Java OOM errorjava.lang.OutOfMemoryError: Map failedjava.lang.OutOfMemoryError: Requested array size exceeds VM limit
Possible Causes
- Excessive usage of native memory: Java applications can directly allocate native memory using
ByteBuffer.allocateDirect(). Native memory is limited by either the container limit or the operating system limit. If the allocated memory is not released, you are going to get OOM errors. - Based on the operating system configuration, each thread consumes a certain amount of memory. An excessive number of threads in the application can result in an
'unable to allocate native memory'error. There are 2 reasons the application can get into this state. Either there is not enough native memory available or there is a limit on the number of threads per process on the operating system level and the application reaches that level. - There is a limit on the size of an array. This is platform-dependent. If the application request exceeds this requirement, JVM will raise the
'Requested array size exceeds'error.
Tools
- pmap: This is a default tool available in Linux-based OS. This can be used to analyze memory. This is a utility to list the memory map of a process. It provides a snapshot of the memory segments allocated to a specific process.
- NMT (Native Memory Tracking): This is a tool that can give the memory allocation done from JVM.
- jemalloc: This tool can be used to monitor the memory allocated from outside the JVM.
3. Case Studies
These are some of the OOM issues I faced at work, and I also explain how I identified their root causes.
Container OOM Killed: Scenario A
Problem
We had a streaming data processing application in Apache Kafka/Apache Flink. The streaming application was deployed on containers managed by Kubernetes. The Java containers were periodically experiencing OOM-killed errors.
Analysis
We started analyzing the heap dump, but the heap dump didn't reveal any clues as heap space was not growing. Next, we started the containers by enabling the NMT (Native Memory Tracking tool). NMT has a feature to see the difference between 2 snapshots. It clearly reported that a sudden spike in the "Other" section (please check the sample output given in the Java Memory Pool model section) is resulting in OOM killed. Further to this, we enabled 'Async-profiler' on this Java application. This helped us to root out the problematic area.
Root Cause
This was a streaming application and we had enabled the 'checkpointing' feature of Flink. This feature periodically saves data to a distributed storage. Data transfer is an I/O operation and this requires byte buffers from native space. In this case, the native memory usage was legitimate. We reconfigured the application with the correct combination of heap and native memory. Things started running fine thereafter.
Container OOM Killed: Scenario B
Problem
This is another streaming application and the container was getting killed with an OOM error. Since the same service was running fine on another deployment, it was a little hard to identify the root cause. One main feature of this service is to write the data to underlying storage.
Analysis
We enabled jemalloc and started the Java application in both environments. Both environments had the same ByteBuffer requirements. However, we noticed that in the environment where it was running fine, the ByteBuffer was getting cleaned up after the GC. In the environment where it was throwing OOM, the data flow was less, and the GC count was way less than the other.
Root Cause
There is a YouTube video explaining the same exact problem. We had two choices here: either enable explicit GC or reduce the heap size to force earlier GC. For this specific problem, we chose the second approach, and that resolved it.
Container OOM Killed: Scenario C
Problem
Once again, a streaming application with checkpoint enabled: whenever the "checkpointing" was happening the application crashed with java.lang.OutOfMemoryError: Unable to allocate native memory.
Analysis
The issue was relatively simple to root cause. We took a thread dump and that revealed that there were close to 1000 threads in the application.
Root Cause
There is a limit on the maximum number of threads per process in the operating system. This limit can be checked by using the below command.
ulimit -u
We decided to rewrite the application to reduce the total number of threads.
Heap OOM: Scenario D
Problem
We had a data processing service with a very high input rate. Occasionally, the application would run out of heap memory.
Analysis
To identify the issue, we decided to periodically collect the heap dumps.
Root Cause
The heap dump revealed that the application logic to clear the Window (streaming pipeline Window) that collects the data was not getting triggered because of a thread contention issue.
The fix was to correct the thread contention issue. After that, the application started running smoothly.
4. Summary
Out-of-memory errors in Java applications are very hard to debug, especially if it is happening in the native memory space of a container. Understanding the Java memory model will help to root the cause of the problem to a certain extent.
- Monitor the usage of processes using tools such as
pmap,ps, andtopin a Linux environment. - Identify whether the memory issues are in the heap, JVM non-heap memory areas, or in the areas outside the JVM.
- Forcing GC will help you identify whether it is a heap issue or a native memory leak.
- Use profiling tools such as JConsole or JVisualVM.
- Use tools like Prometheus, Grafana, and JVM Metrics Exporter to monitor memory usage.
- To identify the native memory leak from inside JVM, use tools such as AsyncProfiler and NMT.
- To identify the native memory leak outside of JVM, use
jemalloc. NMT also will help here.
Opinions expressed by DZone contributors are their own.

Comments