Heap Memory In Java Applications Performance Testing
There are several different models, approaches, resources, and tips available for Java Heap to fully optimize any Java application.
Join the DZone community and get the full member experience.
Join For FreeDoes every performance engineer need to know about how memory in Java works? To completely fine-tune the java performance bottlenecks for high performance my answer is YES. Java memory management is a significant challenge for every performance engineer and Java developer, and a skill that needs to be acquired to have Java applications properly tuned.
It is the process of allocating new objects and removing unused objects (Garbage Collections) properly. Java has automatic memory management, a garbage collector that works in the background to clean up the unused/unreferenced objects and free up some memory. By not having enough knowledge and experience in Java, how the JVM and garbage collector will work, and how Java memory is built, many performance engineers fail to find and address the java bottlenecks when we execute Java application performance testing.
Understanding the Java memory model for all the Java applications has always been a technical task for any performance engineer when it comes to bottleneck analysis. With my understanding, research from various blogs, and my experience, I began to learn how the various Runtime data areas in JVM will work. When I started performance testing most of us didn't know what is java heap or heap space in Java, I was not even aware of where does object in Java gets created, how the unreferenced objects are cleared by different types of GC from different areas of Java Heap memory.
When I started doing professional performance testing for Java applications I came across several memory-related errors like java.lang.OutOfMemoryError is when I started learning more about what is the role of JVM Heap and Stack in Java Performance testing. When it comes to performance engineering job roles with some challenging opportunities, the majority of the companies/customers will check your expertise on real hands-on experience in Java development and java performance tuning so knowing how memory allocation works in Java is important, it gives you the advantage of writing high-performance and optimized applications that will never fail with an OutOfMemoryError and Memory Leaks.
Every performance engineer needs to understand how Java memory management works inside the JVM to fine-tune JVM performance problems. Anything we create in the form of classes, methods, objects, variables everything is all about memory inside the JVM. For example, If we are creating a local variable or global variable or different class objects, everything gets stored in JVM Heap Memory.
There is a huge amount of memory in JVM which is divided into two parts, one is heap memory and another one is stack memory. First, we will begin with Heap memory for all our performance potential problems wrt memory. What is the purpose and role of Heap memory in Java is everyone's question from performance testing.
This is one of the key memory areas for any Java program, for all performance issues. There are several different models, approaches, resources, and tips available for Java Heap to fully optimize any Java application.
Heap Memory
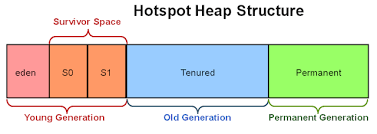
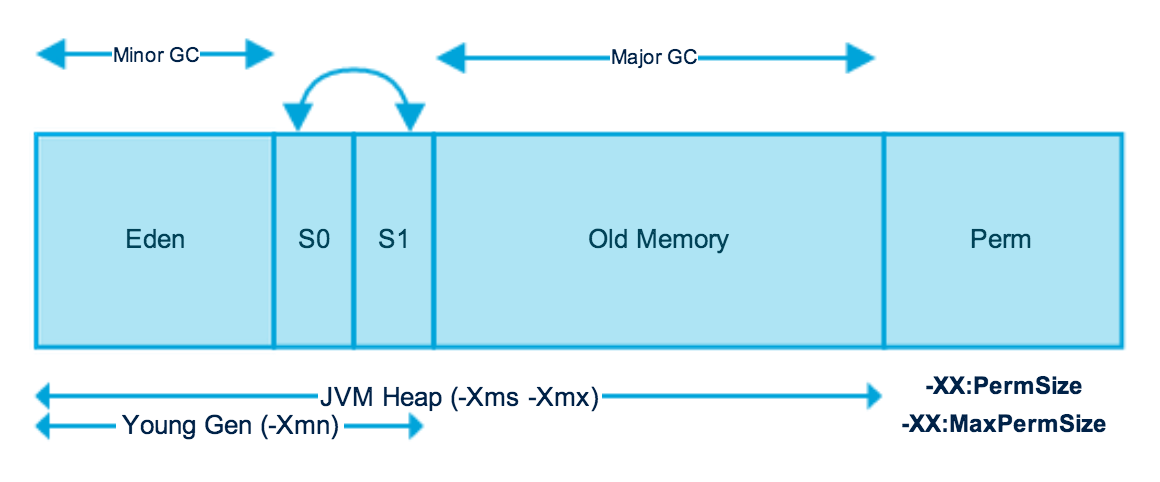
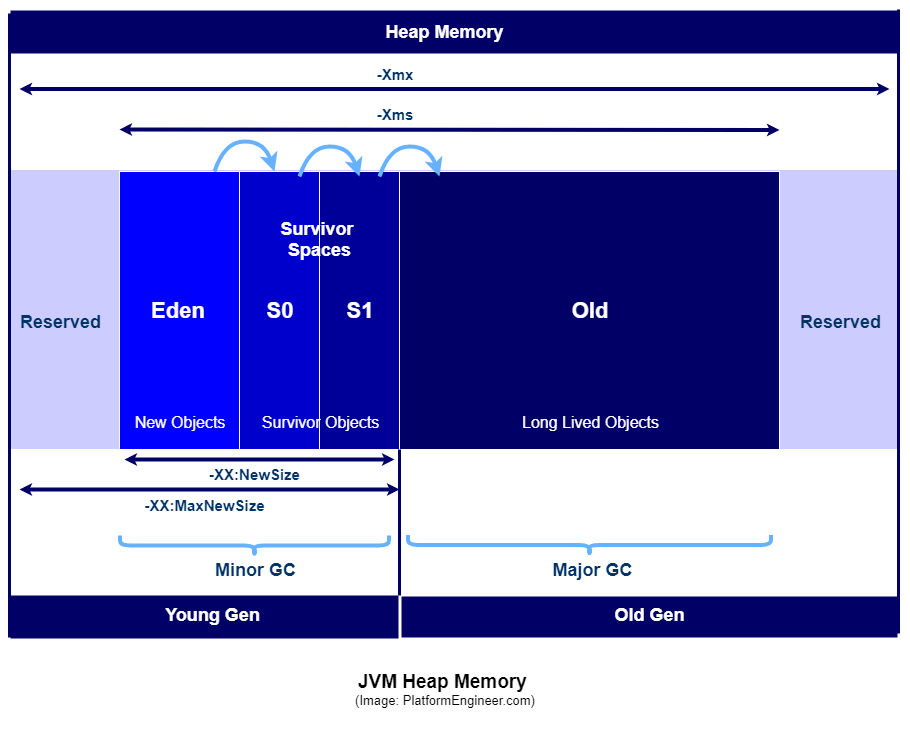
There are many different diagrams in Java that explain the design of the Heap memory in Java. Every performance engineer must understand the difference between PermGen and Metaspace from the recent JDK releases and we can refer to any of the diagrams below:


The HEAP memory is divided into two main generations, the YOUNG and the OLD generations. The first part of the YOUNG generation is called EDEN space and the second is called SURVIVOR space consisting of SURVIVOR0 and SURVIVOR1 spaces. Now let’s understand the purpose of each space in the YOUNG generation. Whenever we create new objects, all of these objects are stored in EDEN space first. In JVM, there's an automatic memory management feature called the Garbage collection (Concepts of the GC are not detailed here).
If the application is heavy and creates thousands of objects, the EDEN memory will be filled with objects, then the Garbage Collector will kick in and delete all unused/unreferenced objects and this process will be called Minor GC. This Minor GC will shift/move all the survivor objects into SURVIVOR memory space. Minor GC has performed automatically on the YOUNG generation to free up the memory. The Minor GC will perform very fast for a short period.
There are so many objects created for different classes so when the number of objects increases the memory in EDEN space increases. Let's assume that the GC1, GC2, GC3 and so on are triggered up to GCN and when many garbage collector operations are automatically called up by JVM then the Minor GC keeps checking all the different objects that are ready for Survivor and immediately the JVM shifts all of these objects to SURVIVOR memory.
The objects that are survived in YOUNG Generation are moved to the OLD generation and when the OLD generation is getting filled with objects the Major GC is triggered. When Major GC is performed? When the OLD generation memory is FULL with objects the Major GC is performed. Major GC takes a lot of time to happen. When the teams develop any Java application or java automation framework and if the developers are creating so many objects they have to be careful about young and old generation concepts.
The developers should not create any unnecessary objects and if they create any objects, the Garbage Collector should destroy them once they complete their tasks. Minor GC will be on the YOUNG generation, and the OLD generation will be performed on Major GC. For example, if we take Amazon or Walmart, we realize there would be so many requests and hits coming to the website, and we see timeout exceptions, high traffic, and timeout exceptions most of the time in any online e-commerce sale because the Major GC will be busy taking a large amount of memory to destroy the objects and obviously as a side effect the CPU and memory utilization be high on the servers.
This indicates that they are internally creating so many objects of that particular class. In this scenario, the Major GC will try to destroy all the unused objects continuously in high numbers. The Major GC will take a longer time as compared to Minor GC.
PermGen (Permanent Generation) — Available Till JDK7
Perhaps every performance engineer seems to have different questions about what's this Permgen all about?
- What will a Permgen contain?
- What happens in PermGen?
- What kind of data is stored here?
- What kind of attributes will be stored inside Permanent Generation?
PermGen is a special heap space, separated from the main memory heap. This Permgen is not part of heap memory, it's called Non-heap memory. All static variables and constant variables that you define will be stored inside the method area and the remember method area is a part of Perm Generation. The only disadvantage of this Permgen is its limited memory size which will generate the famous OutOfMemoryError.
The class loaders in Perm Gen are not garbage collected adequately and it generates a memory leak as a result. The default maximum memory size for 32-bit JVM is 64 MB and 82 MB for the 64-bit version. The support for the JVM arguments -XX:PermSize and -XX:MaxPermSize for Permgen has been removed from JDK 8
Metaspace — Available From Java JDK8
Metaspace is a new memory space starting from the Java JDK 8 and it has replaced the older PermGen memory space in Java JDK 7. The most significant difference is how it handles memory allocation. Specifically, this native memory region grows automatically by default. The advantage of metaspace from JDK 8 is the garbage collector automatically triggers the removal of the dead classes once the class metadata usage reaches its maximum metaspace size.
With new improvements and changes, JVM reduces the chance to get the OutOfMemoryError from metaspace. We have some JVM flags to tune the memory from Metaspace XX:MetaspaceSize and XX:MaxMetaspaceSize
Stack Memory — A Little About Stack
Java stack memory is used for thread execution, and it contains specific method values. Uses the data structure of LIFO or Last In First Out. Stack in java is a memory section containing methods, local variables, and reference variables. Objects stored in the heap are accessible globally whereas other threads can not access stack memory. When a method is invoked, it creates a new block in the stack for that particular method.
The new block will have all the local values, as well as references to other objects that are being used by the method. When the method ends, the new block will be erased and will be available for use by the next method. The objects you find here are only accessible to that particular function and will not live beyond it. Stack memory is size is very less when compared to heap memory.
If there is no memory left in the stack for storing function call or local variable, JVM will throw java.lang.StackOverFlowError and we can use -Xss to define the stack memory size.
Memory Related Errors
What you need to completely understand is that these outputs can only indicate the impact the JVM has, not the actual error. The actual error and its root cause conditions can occur somewhere in your code such as memory leakage, GC problem, synchronization issue, resource allocation, or perhaps even hardware setting. To solve the problem, the simple solution to all of these errors is to increase the affected resource size.
We will need to monitor resource usage from a performance testing and engineering context, profile each category, take multiple heap dumps, go through heap dumps, check and debug/optimize your code, etc and if none of your fixes appear to work, and it indicates that you need more resources and we need to go for it.
java.lang.StackOverFlowError — This error indicates that Stack memory is full.
java.lang.OutOfMemoryError — This error indicates that Heap memory is full.
java.lang.OutOfMemoryError: GC Overhead limit exceeded — This error indicates that GC has reached its overhead limit
java.lang.OutOfMemoryError: Permgen space — This error indicates that Permanent Generation space is full
java.lang.OutOfMemoryError: Metaspace — This error indicates that Metaspace is full (since Java JDK 8)
java.lang.OutOfMemoryError: Unable to create new native thread — This error indicates that JVM native code can no longer create a new native thread from the underlying operating system because so many threads have been already created and they consume all the available memory for the JVM
java.lang.OutOfMemoryError: request size bytes for reason — This error indicates that swap memory space is fully consumed by application
java.lang.OutOfMemoryError: Requested array size exceeds VM limit — This error indicates that our application uses an array size more than the allowed size for the underlying platform
How To Set Initial and Maximum Heap
Initial Heap Size — XMS
Larger than 1/64th of the physical memory of the machine on the machine, or some reasonable minimum. Before J2SE 5.0, a reasonable minimum was the default initial heap size which varies by platform. This default can be overridden by using the command-line option -Xms.
Maximum Heap Size — XMX
Smaller of 1/4th of the physical memory or 1GB. Before J2SE 5.0, the default maximum heap size was 64MB. You can override this default using the -Xmx command-line option. According to Oracle JVM ergonomic page, the maximum heap size should be 1/4 of the physical memory. This threshold is also extended when Jenkins is running inside a VM and/or Docker Container (maximum heap size limits are aggregated when there is more than one Java application running on the same host).
Set your minimum heap size (-Xms) to the same value as maximum size (-Xmx). As a JVM Administrator, you should know the needs of the application based on current usage if you are following Best Practices and collecting Garbage Collection logs.
Recommended JVM Settings
The following example JVM settings are recommended for most production engine tier servers:
-server -Xms24G -Xmx24G -XX:PermSize=512m -XX:+UseG1GC -XX:MaxGCPauseMillis=200 -XX:ParallelGCThreads=20 -XX:ConcGCThreads=5 -XX:InitiatingHeapOccupancyPercent=70
For production replica servers, use the example settings:
-server -Xms4G -Xmx4G -XX:PermSize=512m -XX:+UseG1GC -XX:MaxGCPauseMillis=200 -XX:ParallelGCThreads=20 -XX:ConcGCThreads=5 -XX:InitiatingHeapOccupancyPercent=70
For standalone installations, use the example settings:
-server -Xms32G -Xmx32G -XX:PermSize=512m -XX:+UseG1GC -XX:MaxGCPauseMillis=200 -XX:ParallelGCThreads=20 -XX:ConcGCThreads=5 -XX:InitiatingHeapOccupancyPercent=70
The Above JVM Options Have the Following Effect
-Xms, -Xmx: Places boundaries on the heap size to increase the predictability of garbage collection. The heap size is limited in replica servers so that even Full GCs do not trigger SIP retransmissions. -Xms sets the starting size to prevent pauses caused by heap expansion.
-XX:+UseG1GC: Use the Garbage First (G1) Collector.
-XX:MaxGCPauseMillis: Sets a target for the maximum GC pause time. This is a soft goal, and the JVM will make its best effort to achieve it.
-XX:ParallelGCThreads: Sets the number of threads used during parallel phases of the garbage collectors. The default value varies with the platform on which the JVM is running.
-XX:ConcGCThreads: Number of threads concurrent garbage collectors will use. The default value varies with the platform on which the JVM is running.
-XX:InitiatingHeapOccupancyPercent: Percentage of the (entire) heap occupancy to start a concurrent GC cycle. GCs that trigger a concurrent GC cycle based on the occupancy of the entire heap and not just one of the generations, including G1, use this option. A value of 0 denotes 'do constant GC cycles'. The default value is 45.
Conclusion
There are 600+ arguments that you can pass to JVM to fine-tune the garbage collection and memory. If you include other aspects, the number of JVM arguments will easily cross 1000+. We have explained only a few JVM arguments that are the most problematic when it comes to performance testing Java applications. Thanks for reading the article.
Happy Learning :)
Opinions expressed by DZone contributors are their own.

Comments