Topology-Based Event Correlation With Apache Spark Streaming
We look at a use case from the telecom industry in which Apache Kafka is used to analyze streaming data from cell towers and edge devices.
Join the DZone community and get the full member experience.
Join For FreeLet’s consider a network of devices emitting real-time events. It could be a telecommunication network with equipment sending health signals, or it could be an IoT network sending telemetry data. The question is: how can we enrich the information delivered in the events with the knowledge about topological relations between the devices? This is the area of the topology-based event correlation.
In this article, we will consider a rather simple but realistic scenario from the telecom area. We will correlate events sent by base transceiver stations. We will pay special attention to the problem of late event arrival, when events occurred at the same moment may come to the correlation engine at different moments. We will also consider the problem of event deduplication. By the end of this article, we will have our own simple yet functional event correlation engine based on Apache Spark Structured Streaming and Apache Kafka.
Telecom Network: Stations and Controllers
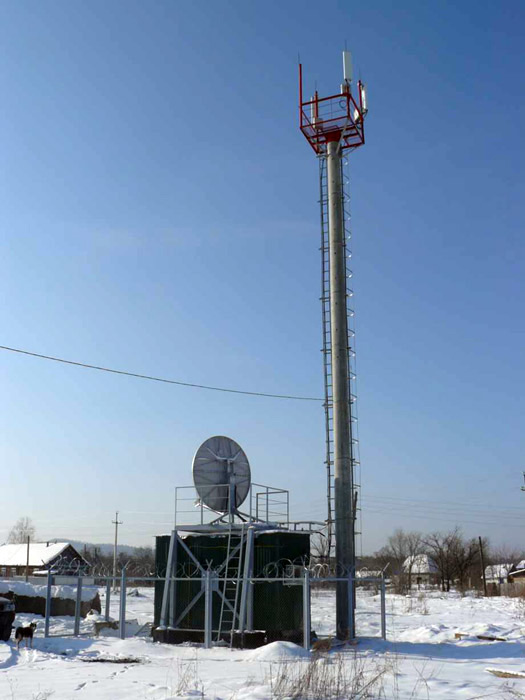
Base transmitter station (BTS) is a piece of equipment that communicates with our mobile phones using radio waves. You should have seen a BTS, even if you live in tundra or on an island. Usually it looks like a lattice mast with a nearby cabin. The mast is the BTS antenna and the cabin has the BTS equipment inside.
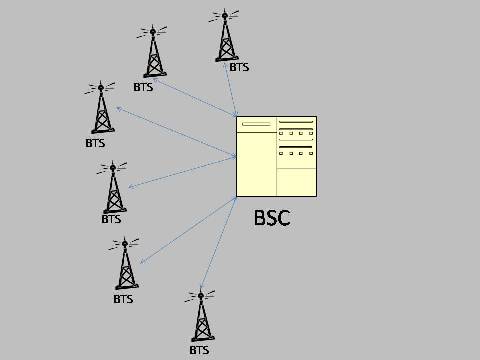
Base station controller (BSC) controls multiple base transceiver stations. BSC connects all its BTSs with the rest of the telecom network. BSC is also responsible for complex activities like handovers from BTS to BTS when a phone moves through areas covered by different BTSs.
Stating the Problem
Now we know that a BTS communicates with the rest of the telecom network via its BSC. This means that if the connection with a controller is lost, then connections with all underlying stations are also unavailable. If we have received a burst of “Communication Lost” events for all stations managed by the very same controller, we can conclude that the issue should be rather in the communication with the controller itself. We can locate the misbehaving equipment faster, we need less time to repair the equipment and to recover the affected services.
Well, let’s formulate the problem to solve:
For all stations, process events in the streaming mode, as they arrive.
For any controller, if we have “Communication Lost” events for all stations of this controller created within a narrow timeframe, we should generate an alarm “Communication Lost” on the controller.
Introducing the Event
For simplicity, we assume that we have only one type of event: “Communication Lost.” Of course, this is not the case for a real telecom network, but here we do not want to spend efforts on event filtering by type.
In our simplistic case, an event has at least the following attributes:
- timestamp - the moment of time when the event has been generated.
- siteId - the identifier of the device, in our case the BTS.
An event may also have other attributes, like severity or textual information, but they are not important for the problem of topology correlation that we are about to solve.
Note, that events do not have unique identifiers. In general, the element management system sending the events may not have the function to generate unique event identifiers. This means, that each event is identified by a pair (timestamp, siteId). Two events having same timestamp and same siteId should be considered as a duplicate of the same event. In a real case, the list of attributes uniquely identifying an event may also contain other fields, like severity and event type, but for our simplistic scenario two attributes are enough.
Introducing the Topology
The topology data that we need is just a table of associations between controllers and stations. A controller may have more than one station. A station is connected to strictly one controller.
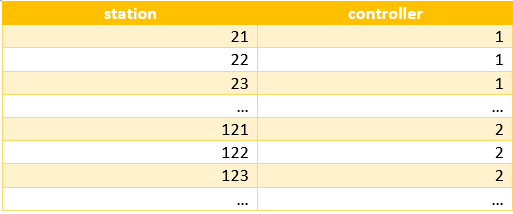 Here we do not touch the problem of extracting the above table from the network topology data. In practice, the network topology may be stored in a graph database or in a set of CSV files. We just assume that the preparation work to extract the relations between stations and controllers is already done, and we have the above table stored in a Parquet file: station_controller.parquet.
However, we have some more work to do with the topology. We need to know: how many stations are connected to each controller? Just make it with a trivial Spark aggregation:
val totalStationCounts = topology
      .groupBy("controller")
      .agg(count("station") as "total_station_count")
The totalStationCounts data set will look like:

Now we can advance to the next topic: receiving the events in the correlation engine.
Receiving Events
Before implementing the correlation logic, let’s decide about how to consume the event stream. In this article we are using Apache Kafka as a messaging system. The element management system sends all events as JSON strings to a special Kafka topic: events. This topic is split into several partitions in order to distribute the load across several Kafka brokers.
One important consideration about the event ordering: Kafka keeps the message order only for the messages sent through the same partition. This means that the Kafka producer has to partition events by the siteId attribute when sending them to the events topic. Thus, two events on the same station will come to the correlation engine in the same order as they were sent.
The following code creates a Spark Streaming data set of records consumed from the Kafka topic:
val kafkaEvents = spark.readStream
    .format("kafka")
    .option("kafka.bootstrap.servers", "kafkabroker:9092")
    .option("subscribe", "events")
    .option("startingOffsets", "latest")
    .load()
We instruct Spark to subscribe to the events Kafka topic and to start consuming from the latest available offsets in order to skip outdated events. Note that this code does not start actually receiving the data, because we did not start the streaming query yet.
Event Correlation: The First Attempt
The next step in our processing pipeline is event parsing: from JSON strings to a Spark data set. This can be done easily thanks to Spark native support for JSON data. You can find the code on GitHub, just follow the link specified at the end of this article. For now, let’s omit this parsing code and go to the main point of this article: the event correlation.
First, we need to determine the controller for each received event. This can be done by joining the events data set with the topology data set:
events
    .join(topology, col("siteId") === col("station"), "inner")
With inner join, we discard all events having unknown siteId. In a real system, however, we might want to send such events to a special processing service.
The goal is to detect the situation, when all stations of a controller are inaccessible. In other words, all stations of the same controller have produced “Communication Lost” events within a narrow time window. In terms of Spark, we have to make an aggregation on the time window and on the controller:
events
    .join(topology, col("siteId") === col("station"), "inner")
    .groupBy(
        window(col("timestamp"), "1 minute", "30 seconds"),
        col("controller")
     )
In this example, we consider sliding windows of 1-minute size and 30-seconds sliding interval. If all stations belonging to the same controller reported the problem in a 1-minute interval, then we will be able to catch them by such aggregation.
We wanted the above aggregation in order to count the affected stations:
val affectedStationCounts = events
    .join(topology, col("siteId") === col("station"), "inner")
    .groupBy(
        window(col("timestamp"), "1 minute", "30 seconds"),
        col("controller")
    )
    .agg(collect_set("siteId") as "affected_stations")
    .withColumn("affected_station_count", size(col("affected_stations")))
A reader familiar with Spark SQL API may ask: why we count stations in so complicated way? Why don’t use the countDistinct() function provided by Spark instead? The reason is that distinct operations on streaming data sets are not yet supported (as of Spark 2.4.0).
So far, we have the number of affected stations on each controller. Now we have to compare this number with the total stations count for the controller. Here we use the totalStationCounts data set that we have calculated from the topology data:
val controllerAlarms = affectedStationCounts
    .join(totalStationCounts, Seq("controller"), "inner")
    .where(col("affected_station_count") === col("total_station_count"))
If the number of affected stations has reached the total number of stations, then we can tell that there is an alarm on the controller.
The only remaining thing is to send the generated alarms to the downstream service. As with events from stations, we send alarms as JSON strings to a Kafka topic. Let’s skip the transformation to JSON and advance to the code sending alarms to the alarms Kafka topic:
val query = kafkaAlarms
    .writeStream
    .outputMode(OutputMode.Update())
    .format("kafka")
    .option("kafka.bootstrap.servers", "kafkabroker:9092")
    .option("topic", "alarms")
    .option("checkpointLocation", "/checkpoint")
    .start()
query.awaitTermination()
The start() call makes all the pipeline working: the Spark Streaming engine starts to consume events from Kafka, to perform transformations on them and to send the result to the output Kafka topic.
There is one piece of code unclear for the moment: outputMode(OutputMode.Update()). But we will explain it a bit later.
Well, we have just implemented our event correlation engine. Still there are some important points to discuss.
Handling Late Events
When talking about streaming event processing, it is important to make the difference between two event timestamps:
the timestamp when an event has been created.
the timestamp when an event has been received in the processing engine.
Suppose we have two events emitted within a 1-minute timeframe. Can we expect that their processing timestamps will also fit a 1-minute timeframe? Generally speaking, no.
Only if we have an ideal messaging system that delivers all messages with a constant delay, then we can expect events coming at the same time intervals as they have been sent.
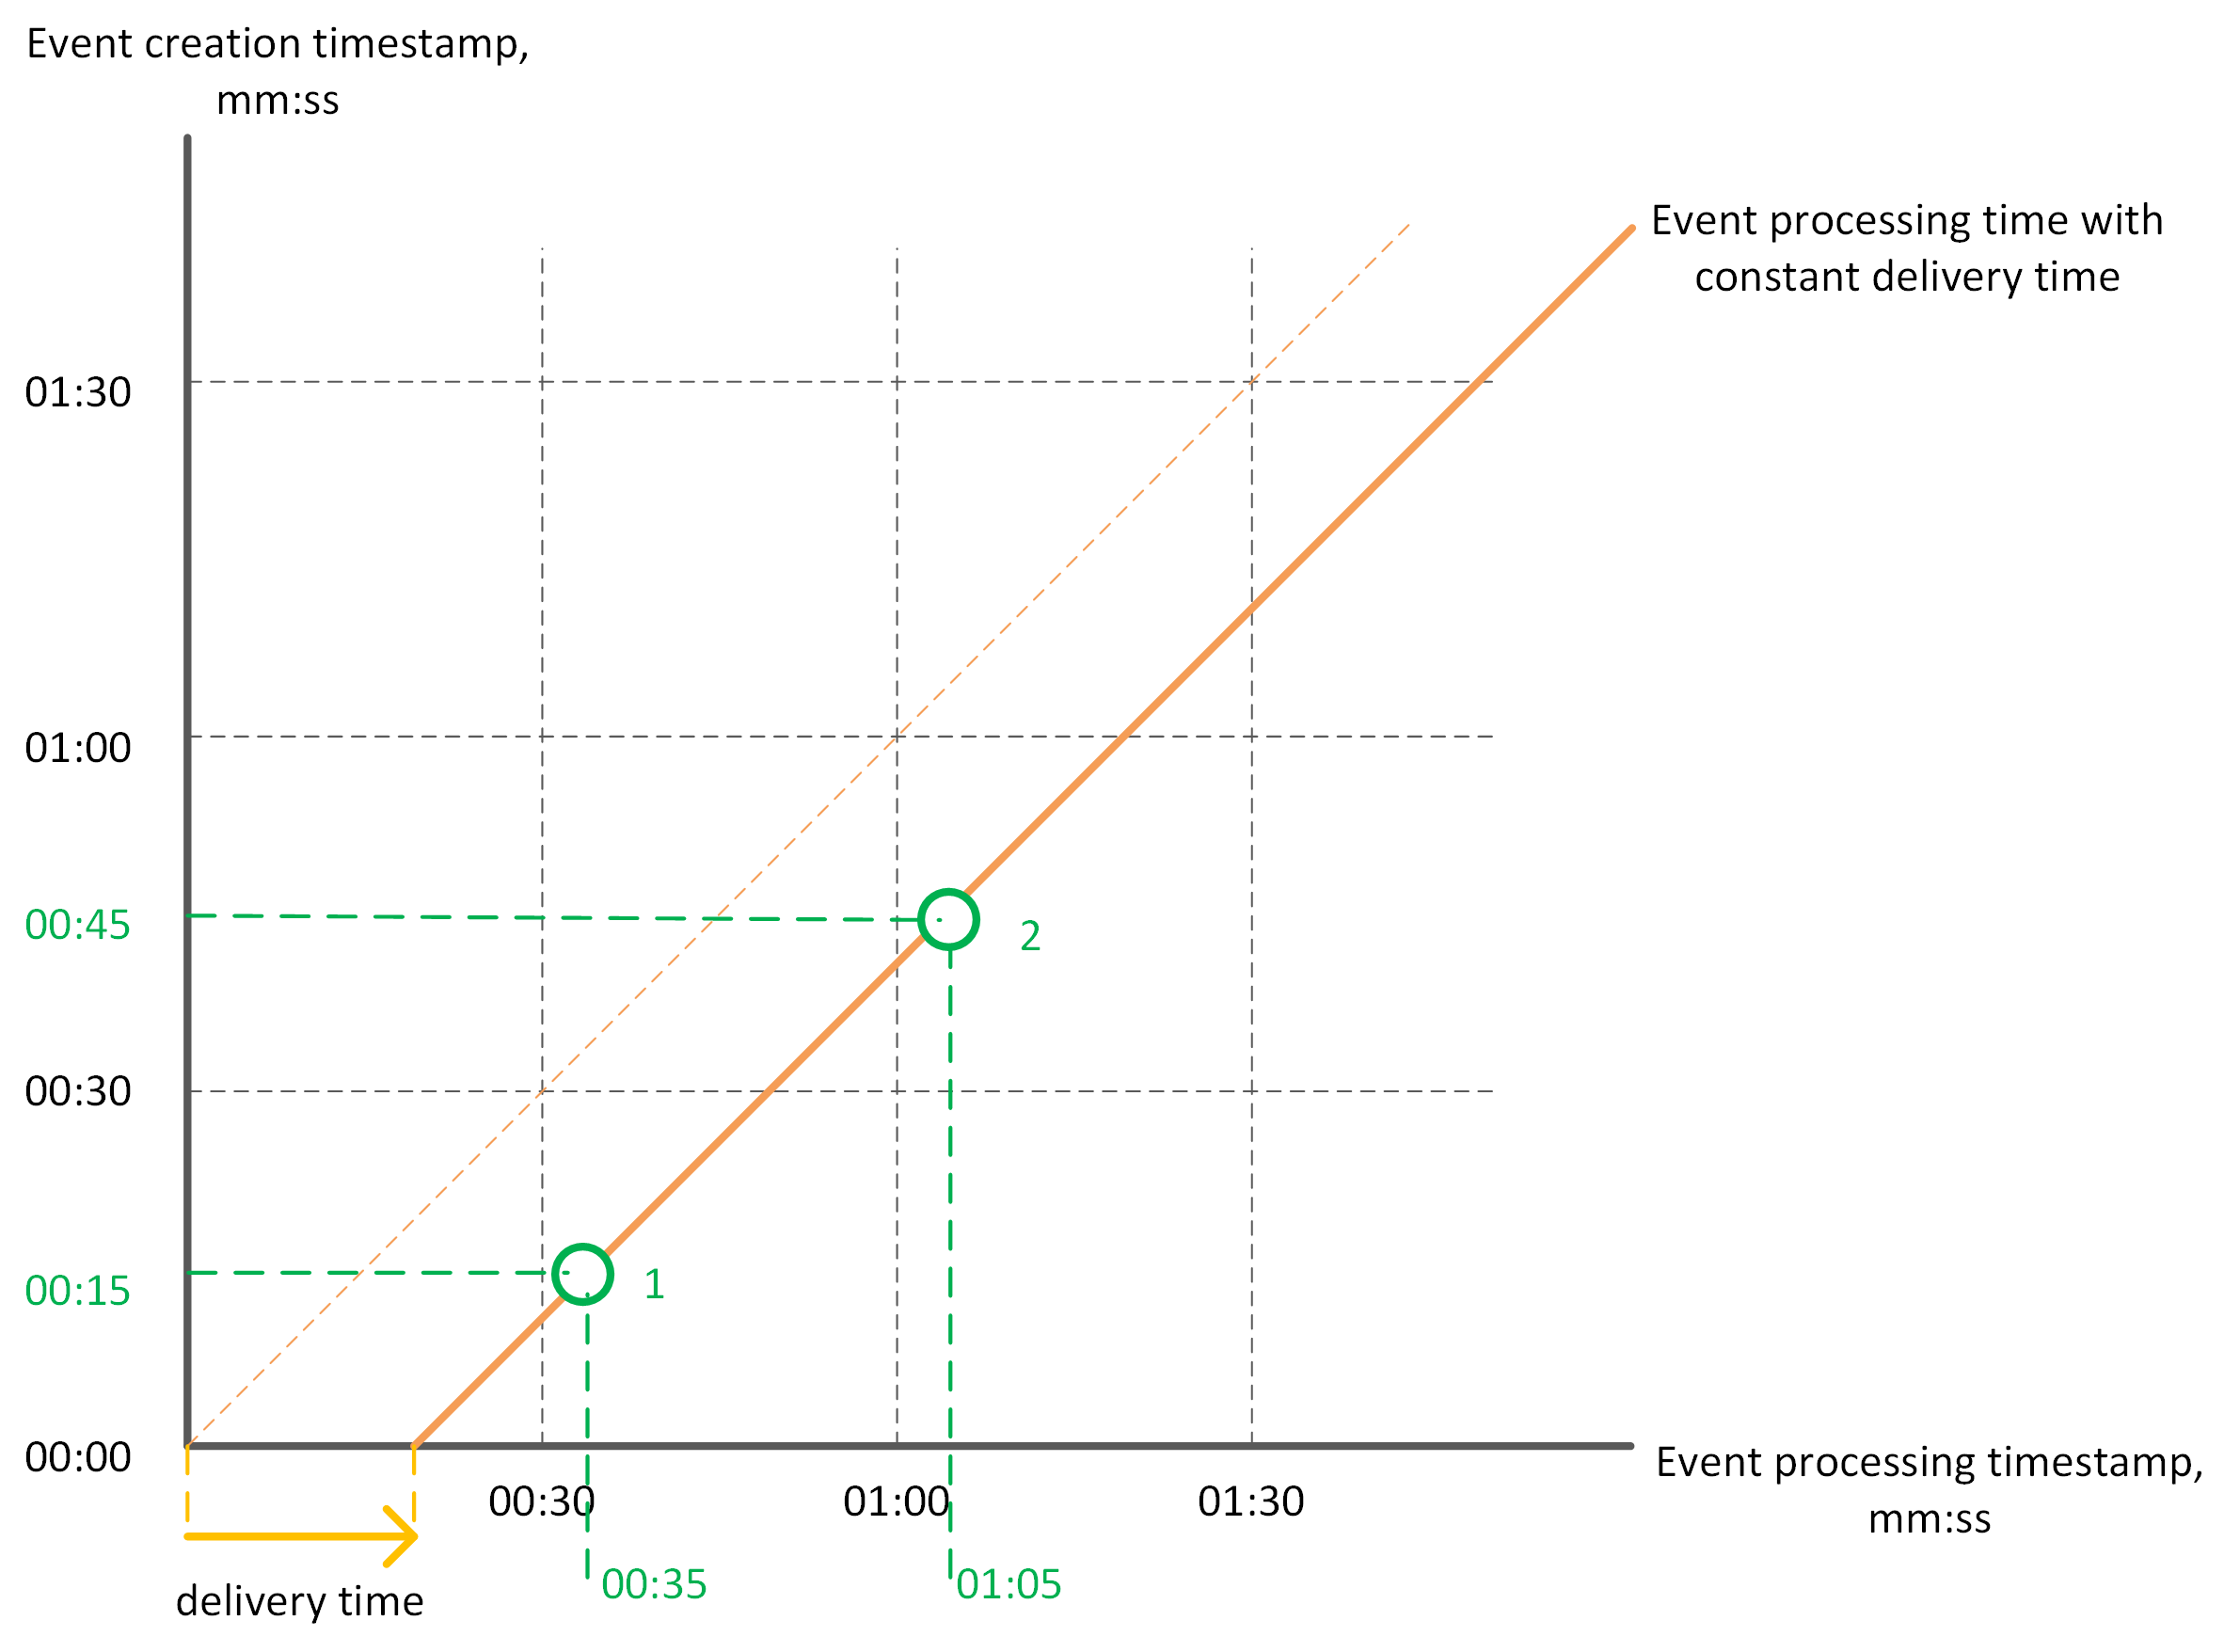
However, events from different stations may travel through different partitions of the Kafka topic and have different delivery times. In the example displayed on the picture below, we see how events 1 and 2 come to the consumer in the reverse order and they do not fit the 1-minute timeframe anymore!
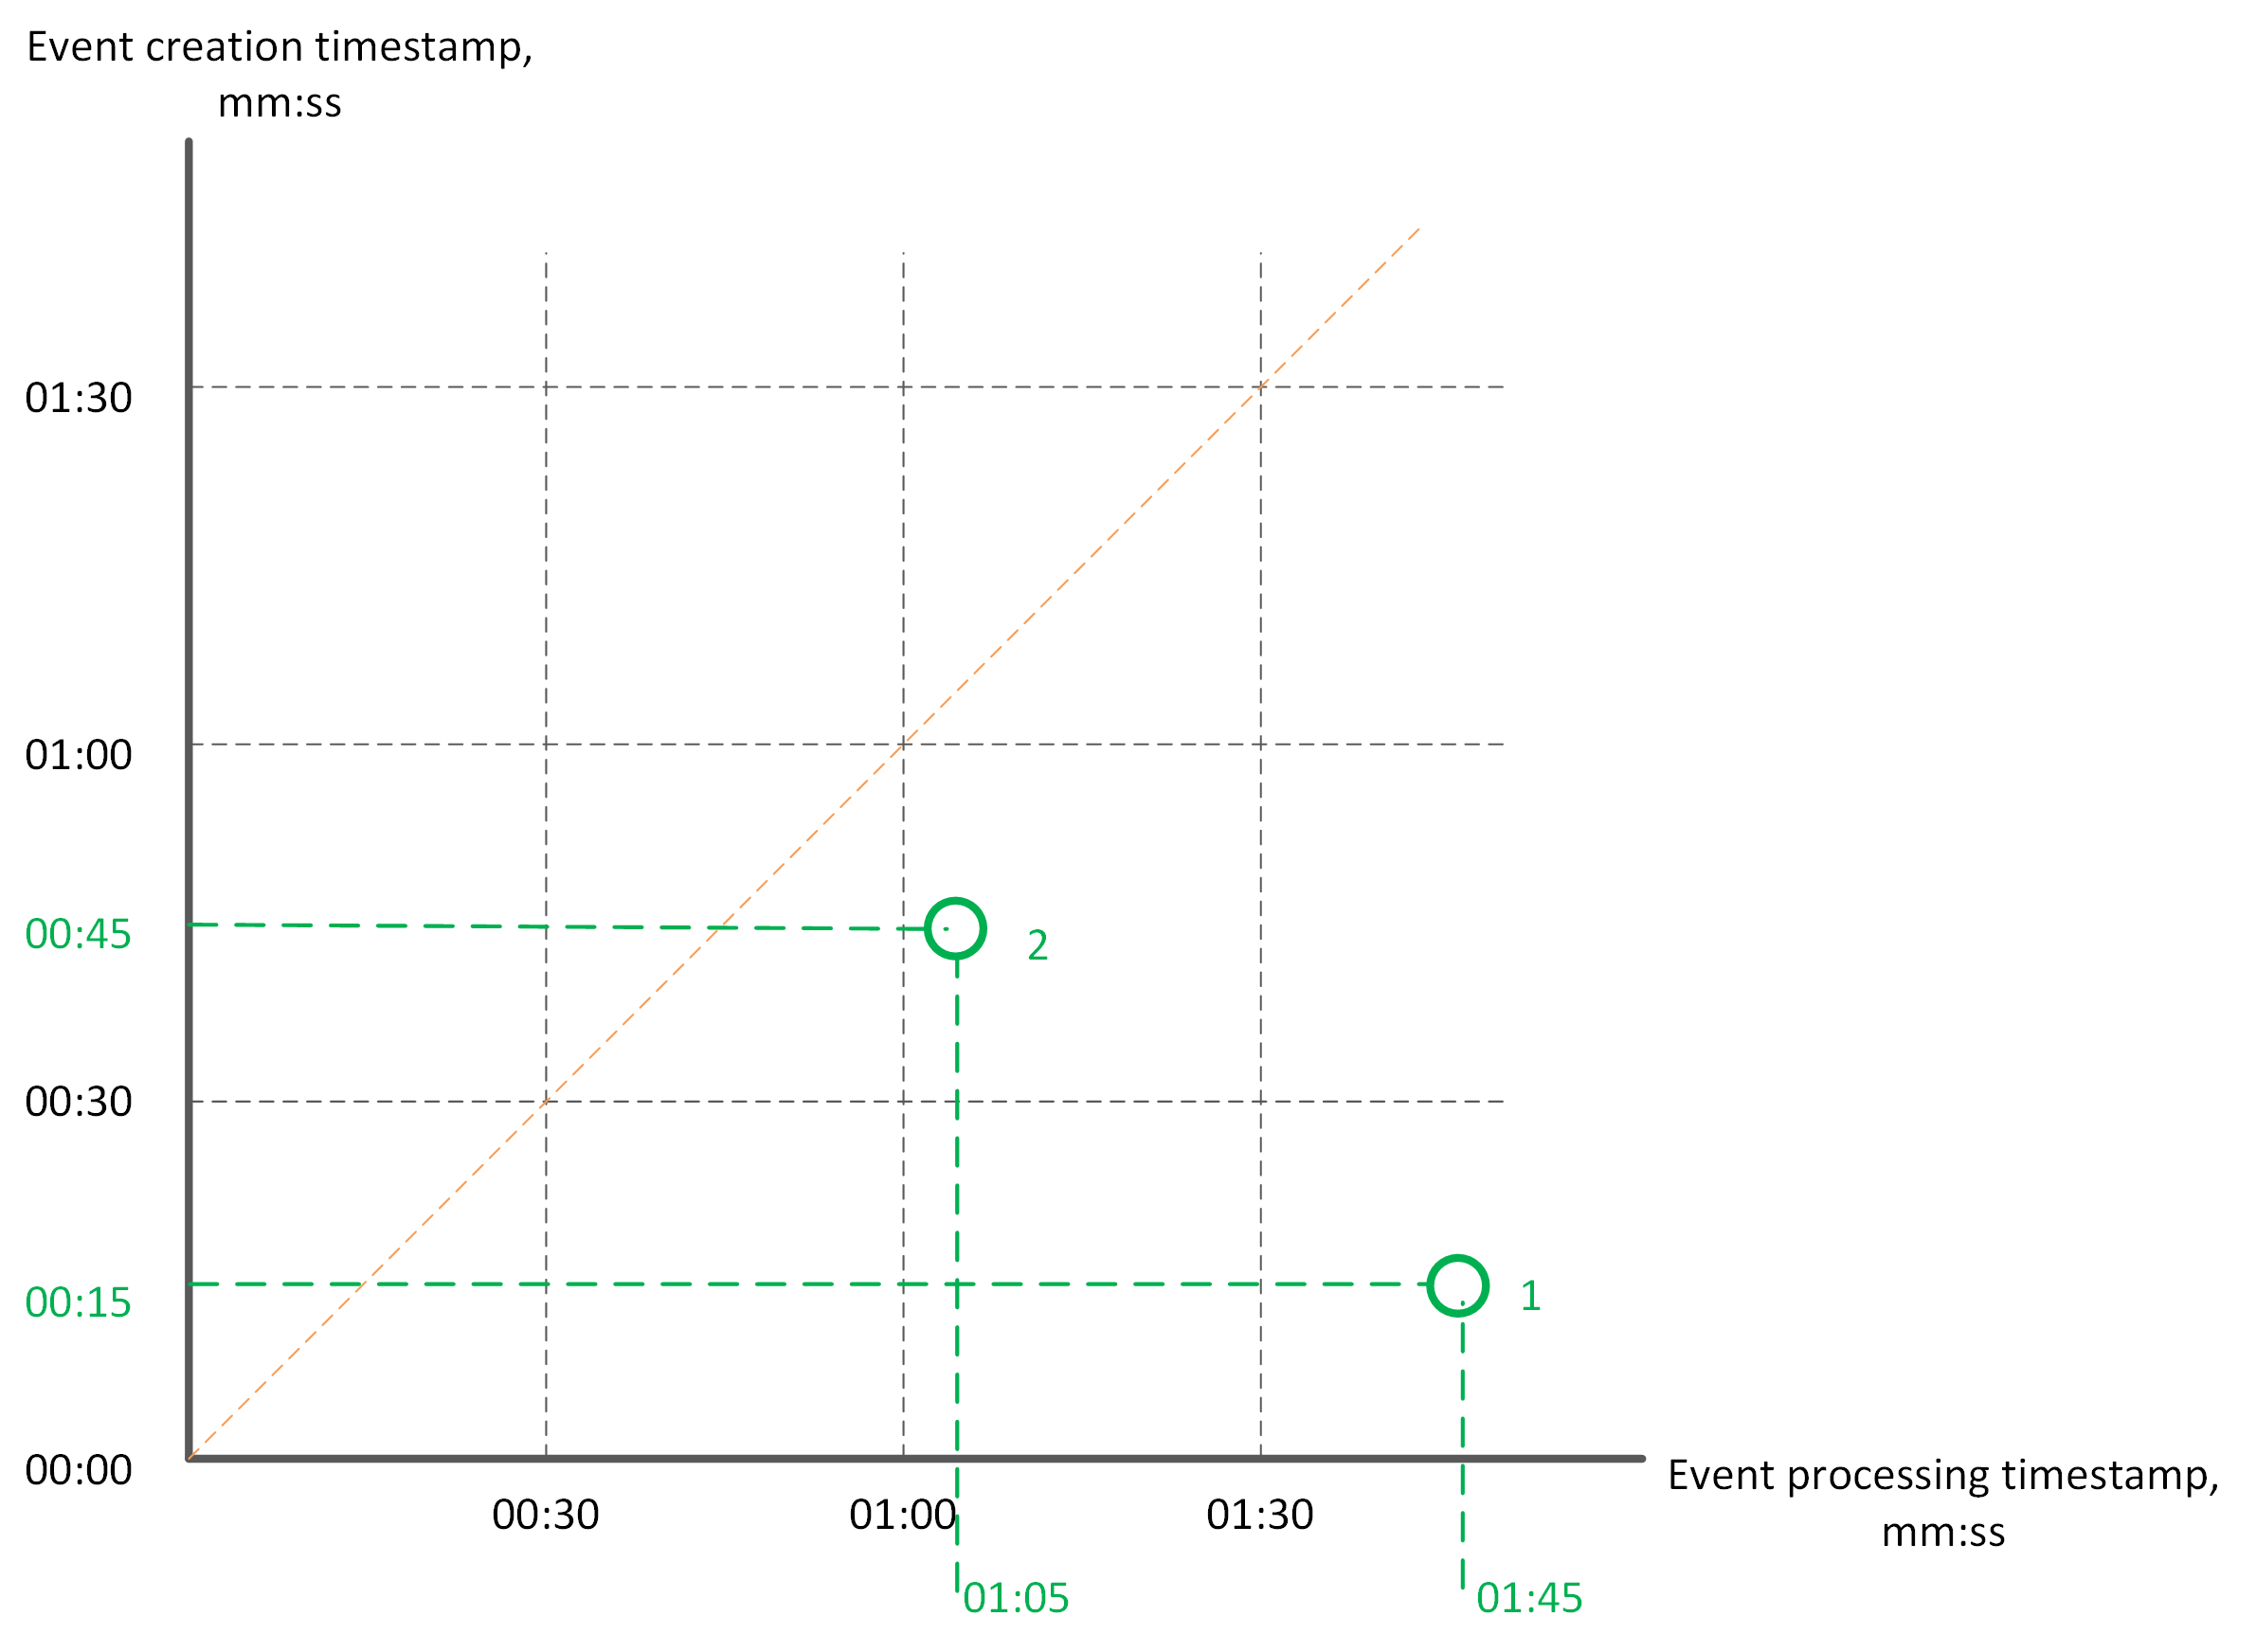
So we have a problem. How can we aggregate over a time window? It seems that our correlation engine does not have the right notion of the event timestamp. But wait, our events have the timestamp attribute, and we specified the timestamp column as a parameter to the window() aggregation function. Does Spark Streaming correctly perform aggregations on the event timestamp?
Indeed, Spark Structured Streaming aggregates on the event timestamp, as we specified. Aggregations over an event timestamp window are very similar to “usual” grouped aggregations. However, there is one important difference: Spark is able to update the result of the aggregation with the late data. In the above example, both events 1 and 2 belong to the time window 00:00 - 01:00. Both events come late, but Spark Streaming aggregates them over the correct time window.
We have to instruct Spark how long it should wait for a late event before completing the aggregation over a sliding window. We use watermarking for this purpose:
val affectedStationCounts = events
    .withWatermark("timestamp", "10 minutes")
    .join(topology, col("siteId") === col("station"), "inner")
    .groupBy(
        window(col("timestamp"), "1 minute", "30 seconds"),
        col("controller")
    )
    .agg(collect_set("siteId") as "affected_stations")
    .withColumn("affected_station_count", size(col("affected_stations")))
With the above query, Spark will update event counts for each sliding window with events arrived not earlier than 10 minutes before the latest event seen for this window.
Once we have a clear understanding about late events handling with a watermark, we can bring some clarity on this statement: outputMode(OutputMode.Update()). The Update output mode means, in our case, that Spark should send to the alarms topic only updated results of the computation. Each time an alarm has been updated with some late events, this alarm will be sent again. For each sliding window, Spark will continue re-computing alarms until the deadline specified by the watermark has passed.
Instead of Update we could set the output mode to Append. In this case, Spark will send each alarm only once, but with additional delay. In the Append output mode, the result of aggregation is finalized only after the deadline specified by the watermark has passed.
Event Deduplication
Is it probable that some event is delivered more than once? Generally speaking, yes. For example, the element management system sending events is not flawless, it may generate duplicates. Another case, specific to Kafka: the producer sends a message but doesn’t receive an acknowledgment in time, so it repeats the message.
As we remember, events in our case do not have unique identifiers, an event can be identified by a pair: (siteId, timestamp). Spark is able to deduplicate events using event timestamps, but it needs a watermark:
kafkaEvents
    .withWatermark("timestamp", "10 minutes")
    .dropDuplicates("timestamp", "siteId")
In the code above we ask Spark to deduplicate events using both event timestamp and event siteId. Two events received from the same station within a 10-minute interval will be considered as the same event if they have the same timestamp.
Can We Make it Better?
Once we have a prototype of the event correlation engine, it’s time to think about real production usage. There are certainly some points of improvement.
Let’s start with the event deduplication function. We have embedded it into the correlation engine. All duplicates travel through the entire data pipeline and get eliminated only at the final processing stage. I would say that this is a poor solution design, at least if this is the only place where duplicates are dropped.
Deduplication function should run close to the event source. In our case, if the element management system produces duplicates, then we can embed deduplication function into the Kafka producer. If the Kafka producer repeats messages, then we can drop duplicates in a Kafka compacted topic. The purpose is to prevent the excessive data from flooding the data pipeline and from introducing additional latencies.
Now let’s count how many joins we have:
val affectedStationCounts = events
    .join(topology, col("siteId") === col("station"), "inner")
    ...

val controllerAlarms = affectedStationCounts
    .join(totalStationCounts, Seq("controller"), "inner")
    ...
The first join enriches events with the information about controllers, the second join brings the station counters for all controllers. When performing the first join, Spark repartitions the events data set on the siteId column. However, for the second join Spark has to repartition the data set on the controller column, causing data re-shuffling and data transfer between executors. Can we avoid this excessive and costly operation?
We can de-normalize the topology table and include station counters:
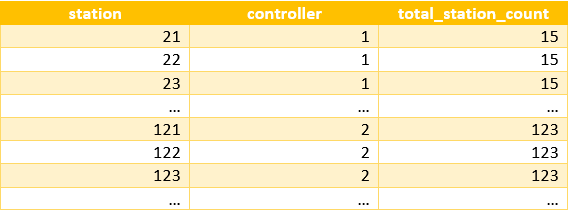
When aggregating over the sliding window, we can retain values from the total_station_counts column:
val affectedStationCounts = events
    .join(denormalizedTopology, col("siteId") === col("station"), "inner")
    .groupBy(
        window(col("timestamp"), "1 minute", "30 seconds"),
        col("controller")
    )
    .agg(
        collect_set("siteId") as "affected_stations",
        first("total_station_count") as "total_station_count"
    )
    .withColumn("affected_station_count", size(col("affected_stations")))
Thus, we have excluded the second join by introducing a de-normalized topology table and a simple aggregation operation: first().
In order to minimize the network traffic, we can also use a more compact serialization technique. In this implementation events are serialized as Java strings in the JSON format. Instead we could use Avro serialization.
Conclusion
In this article, we discussed a simple case of the topology-based event correlation. Of course, a real event correlation engine should implement more sophisticated scenarios. For example, what the engine has to do when the problem is fixed and stations stop sending “Communication Lost” events? Should it generate a “clearance” notification?
Nevertheless, Spark Structured Streaming provides a good foundation thanks to the following features:
- Scalable parallel processing on multiple executors.
- Built-in access to the distributed file system — HDFS.
- Easy integration with Kafka messaging system.
- Aggregations on streaming data sets.
- Support of event timestamps.
- Event deduplication.
You were told that event correlation is a complex job that can be performed only by expensive software from a limited set of vendors, weren’t you? Now you know how to make event correlation with easy to use open source components.
Getting the Code
You can find the code along with the build and run instructions at the GitHub project: telecom-streaming.
Published at DZone with permission of Arseniy Tashoyan. See the original article here.
Opinions expressed by DZone contributors are their own.

Comments