The Best Way To Diagnose a Patient Is To Cut Him Open
Explore modern debugging beyond print statements, highlighting tools like tracepoints and object marking for efficient problem-solving.
Join the DZone community and get the full member experience.
Join For Free"The most effective debugging tool is still careful thought, coupled with judiciously placed print statements." — Brian Kernighan.
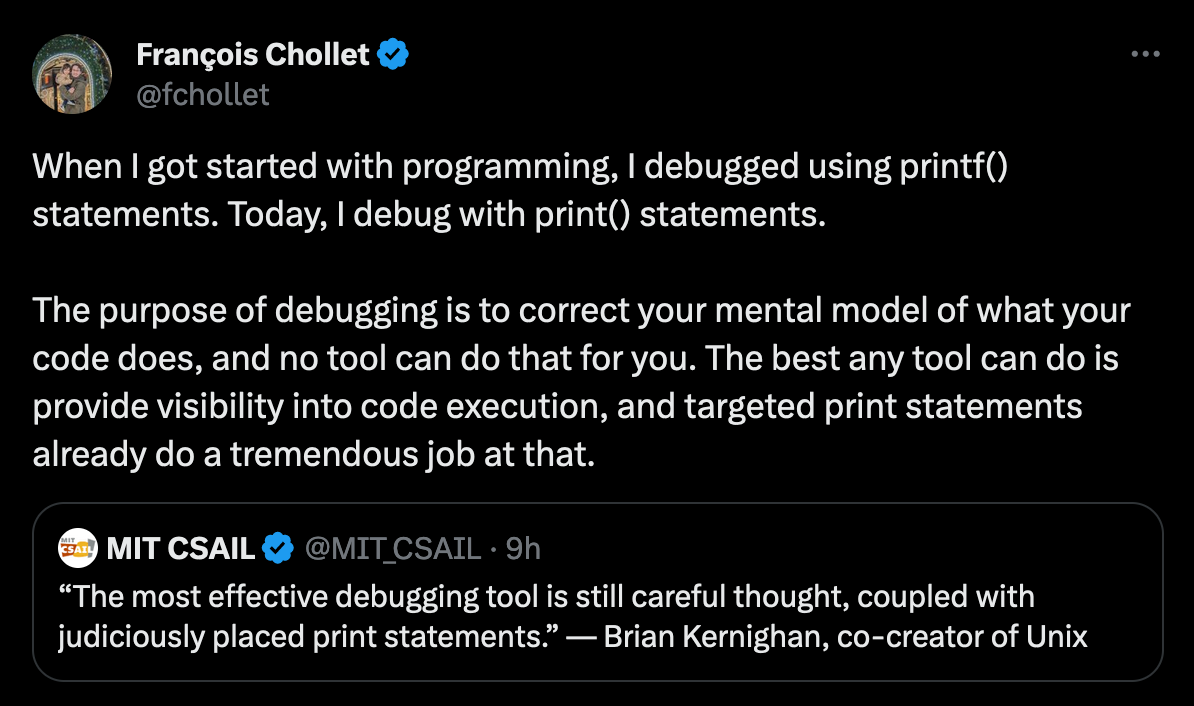
Cutting a patient open and using print for debugging used to be the best way to diagnose problems. If you still advocate either one of those as the superior approach to troubleshooting, then you're either facing a very niche problem or need to update your knowledge. This is a frequent occurrence, e.g., this recent tweet:

This specific tweet got to the HN front page, and people chimed in with that usual repetitive nonsense. No, it’s not the best way for the vast majority of developers. It should be discouraged just as surgery should be avoided when possible.
Fixating on print debugging is a form of a mental block; debugging isn’t just stepping over code. It requires a completely new way of thinking about issue resolution. A way that is far superior to merely printing a few lines.
Before I continue, my bias is obvious. I wrote a book about debugging, and I blog about it a lot. This is a pet peeve of mine.
I want to start with the exception to the rule, though: when do we need to print something...
Logging Is NOT Print Debugging!
One of the most important debugging tools in our arsenal is a logger, but it is not the same as print debugging in any way:
| Logger | ||
|---|---|---|
Permanence of output |
Permanent |
Ephemeral |
Permanence in code |
Permanent |
Should be removed |
Globally Toggleable |
Yes |
No |
Intention |
Added as part of the design |
Added ad-hoc |
A log is something we add with forethought; we want to keep the log for future bugs and might even want to expose it to the users. We can control its verbosity often at the module level and can usually disable it entirely. It’s permanent in code and usually writes to a permanent file we can review at our leisure.
Print debugging is code we add to locate a temporary problem. If such a problem has the potential of recurring, then a log would typically make more sense in the long run. This is true for almost every type of system. We see developers adding print statements and removing them constantly instead of creating a simple log to track frequent problems.
There are special cases where print debugging make some sense: in mission-critical embedded systems, a log might be impractical in terms of device constraints. Debuggers are awful in those environments, and print debugging is a simple hack. Debugging system-level tools like a kernel, compiler, debugger, or JIT can be difficult with a debugger. Logging might not make sense in all of these cases, e.g., I don’t want my JIT to print every bytecode it’s processing and the metadata involved.
Those are the exceptions, not the rules. Very few of us write such tools. I do, and even then, it’s a fraction of my work. For example, when working at Lightrun, I was working on a production debugger. Debugging the agent code that’s connected to the executable was one of the hardest things to do. A mix of C++ and JVM code that’s connected to a completely separate binary... Print debugging of that portion was simpler, and even then, we tried to aim towards logging. However, the visual aspects of the debugger within the server backend and the IDE were perfect targets for the debugger.
Why Debug?
There are three reasons to use a debugger instead of printouts or even logs:
- Features: Modern debuggers can provide spectacular capabilities that are unfamiliar to many developers. Sadly, there are very few debugging courses in academia since it’s a subject that’s hard to test.
- Low overhead: In the past, running with the debugger meant slow execution and a lot of overhead. This is no longer true. Many of us use the debug action when launching an application instead of running, and there’s no noticeable overhead for most applications. When there is overhead, some debuggers provide means to improve performance by disabling some features.
- Library code: A debugger can step into a library or framework and track the bug there. Doing this with print debugging will require compiling code that you might not want to deal with.
I dug into the features I mentioned in my book and series on debugging (linked above), but let’s pick a few fantastic capabilities of the debugger that I wrote about in the past.
For the sake of positive dialog, here are some of my top features of modern debuggers.
Tracepoints
Whenever someone opens the print debugging discussion, all I hear is, “I don’t know about tracepoints.” They aren’t a new feature in debuggers, yet so few are aware of them. A tracepoint is a breakpoint that doesn’t stop; it just keeps running. Instead of stopping, you can do other things at that point, such as print to the console. This is similar to print debugging; only it doesn’t suffer from many of the drawbacks: no runtime overhead, no accidental commit to the code base, no need to restart the application when changing it, etc.
Grouping and Naming
The previous video/post included a discussion of grouping and naming. This lets us group tracepoints together, disable them as a group, etc. This might seem like a minor feature until you start thinking about the process of print debugging. We slowly go through the code, adding a print and restarting. Then suddenly, we need to go back, or if a call comes in and we need to debug something else...
When we package the tracepoints and breakpoints into a group, we can set aside a debugging session like a branch in version control. It makes it much easier to preserve our train of thought and jump right back to the applicable lines of code.
Object Marking
When asked about my favorite debugging feature I’m always conflicted, Object Marking is one of my top two features... It seems like a simple thing; we can mark an object, and it gets saved with a specific name.
However, this is a powerful and important feature. I used to write down the pointers to objects or memory areas while debugging. This is valuable as sometimes an area of memory would look the same but would have a different address, or it might be hard to track objects with everything going on. Object Marking allows us to save a global reference to an object and use it in conditional breakpoints or for visual comparison.
Renderers
My other favorite feature is the renderer. It lets us define how elements look in the debugger watch area. Imagine you have a sophisticated object hierarchy but rarely need that information... A renderer lets you customize the way IntelliJ/IDEA presents the object to you.
Tracking New Instances
One of the often overlooked capabilities of the debugger is memory tracking. A Java debugger can show you a searchable set of all object instances in the heap, which is a fantastic capability that can expose unintuitive behavior But it can go further, it can track new allocations of an object and provide you with the stack to the applicable object allocation.
Tip of the Iceberg
I wrote a lot about debugging, so there’s no point in repeating all of it in this post. If you’re a person who feels more comfortable using print debugging, then ask yourself this: why?
Don’t hide behind an out-of-date Brian Kernighan quote. Things change. Are you working in one of the edge cases where print debugging is the only option?
Are you treating logging as print debugging or vice versa?
Or is it just that print debugging was how your team always worked, and it stuck in place? If it’s one of those, then it might be time to re-evaluate the current state of debuggers.
Published at DZone with permission of Shai Almog, DZone MVB. See the original article here.
Opinions expressed by DZone contributors are their own.

Comments