The Art of Full Stack Debugging
Tired of frustrating bugs? Discover practical, real-world strategies for full-stack debugging to effortlessly track down issues from frontend to backend.
Join the DZone community and get the full member experience.
Join For FreeFull stack development is often likened to an intricate balancing act, where developers are expected to juggle multiple responsibilities across the front end, back end, database, and beyond. As the definition of full-stack development continues to evolve, so too does the approach to debugging. Full stack debugging is an essential skill for developers, as it involves tracking issues through multiple layers of an application, often navigating domains where one’s knowledge may only be cursory. In this blog post, I aim to explore the nuances of full-stack debugging, offering practical tips and insights for developers navigating the complex web of modern software development.
Notice that this is an introductory post focusing mostly on the front-end debugging aspects. In the following posts, I will dig deeper into the less familiar capabilities of front-end debugging.
Full Stack Development: A Shifting Definition
The definition of full stack development is as fluid as the technology stacks themselves. Traditionally, full-stack developers were defined as those who could work on both the front end and back end of an application. However, as the industry evolves, this definition has expanded to include aspects of operations (OPS) and configuration. The modern full-stack developer is expected to submit pull requests that cover all parts required to implement a feature — backend, database, frontend, and configuration. While this does not make them an expert in all these areas, it does require them to navigate across domains, often relying on domain experts for guidance.
I've heard it said that full-stack developers are:
Jack of all trades, master of none.
However, the full quote probably better represents the reality:
Jack of all trades, master of none, but better than a master of one.
The Full Stack Debugging Approach
Just as full-stack development involves working across various domains, full-stack debugging requires a similar approach. A symptom of a bug may manifest in the front end, but its root cause could lie deep within the backend or database layers. Full stack debugging is about tracing these issues through the layers and isolating them as quickly as possible. This is no easy task, especially when dealing with complex systems where multiple layers interact in unexpected ways. The key to successful full-stack debugging lies in understanding how to track an issue through each layer of the stack and identifying common pitfalls that developers may encounter.
Frontend Debugging: Tools and Techniques
It Isn't "Just Console.log"
Frontend developers are often stereotyped as relying solely on Console.log for debugging. While this method is simple and effective for basic debugging tasks, it falls short when dealing with the complex challenges of modern web development. The complexity of frontend code has increased significantly, making advanced debugging tools not just useful, but necessary. Yet, despite the availability of powerful debugging tools, many developers continue to shy away from them, clinging to old habits.
The Power of Developer Tools
Modern web browsers come equipped with robust developer tools that offer a wide range of capabilities for debugging front-end issues. These tools, available in browsers like Chrome and Firefox, allow developers to inspect elements, view and edit HTML and CSS, monitor network activity, and much more. One of the most powerful, yet underutilized, features of these tools is the JavaScript debugger.
The debugger allows developers to set breakpoints, step through code, and inspect the state of variables at different points in the execution. However, the complexity of frontend code, particularly when it has been obfuscated for performance reasons, can make debugging a challenging task.
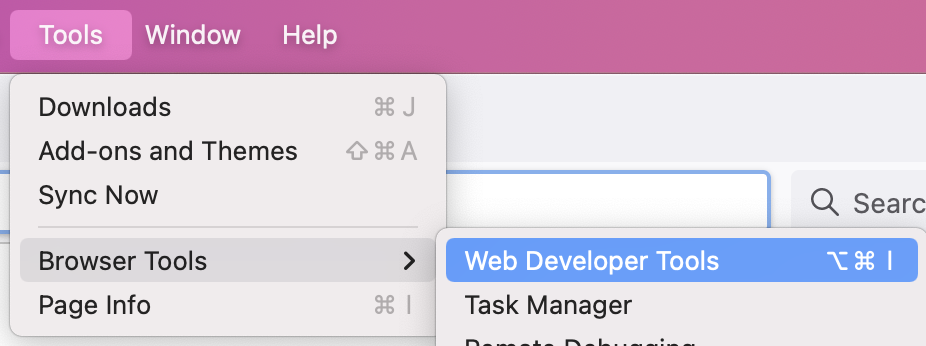
We can launch the browser tools on Firefox using this menu:

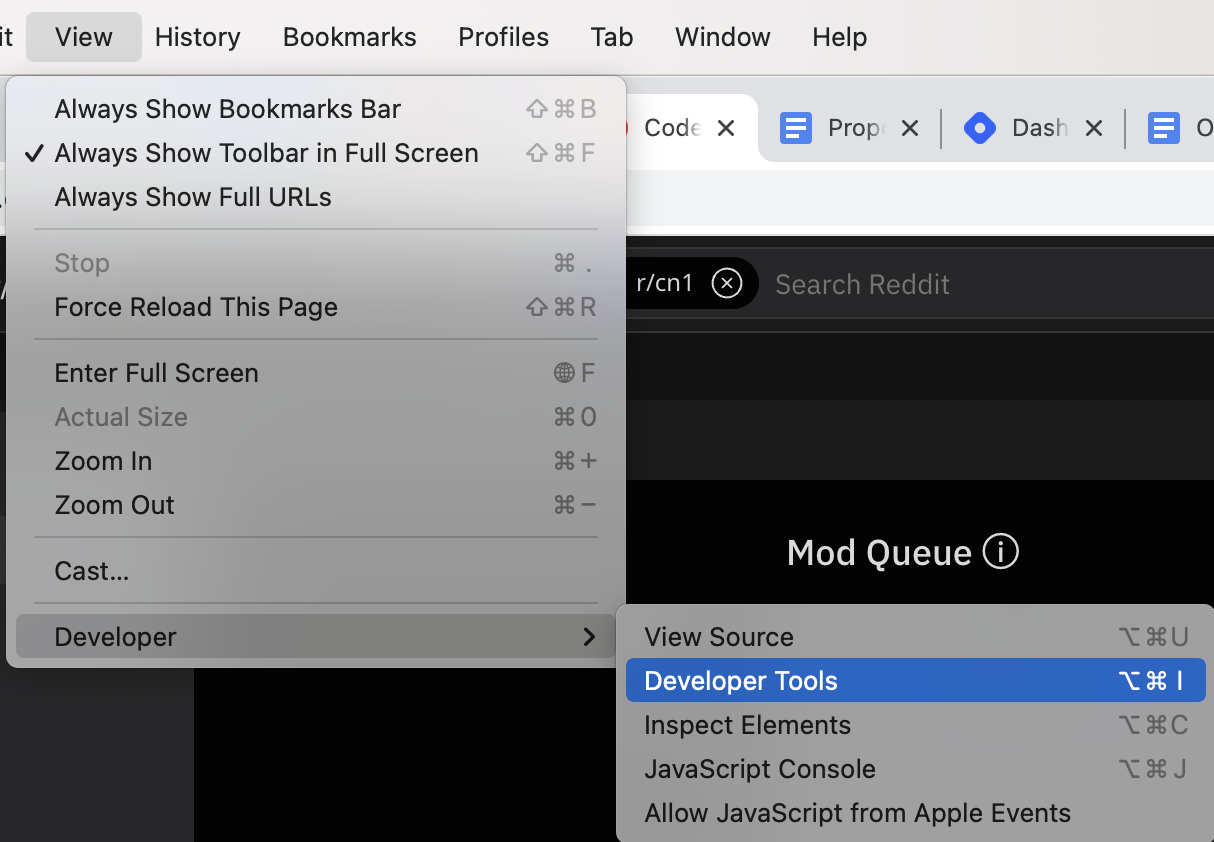
On Chrome we can use this option:

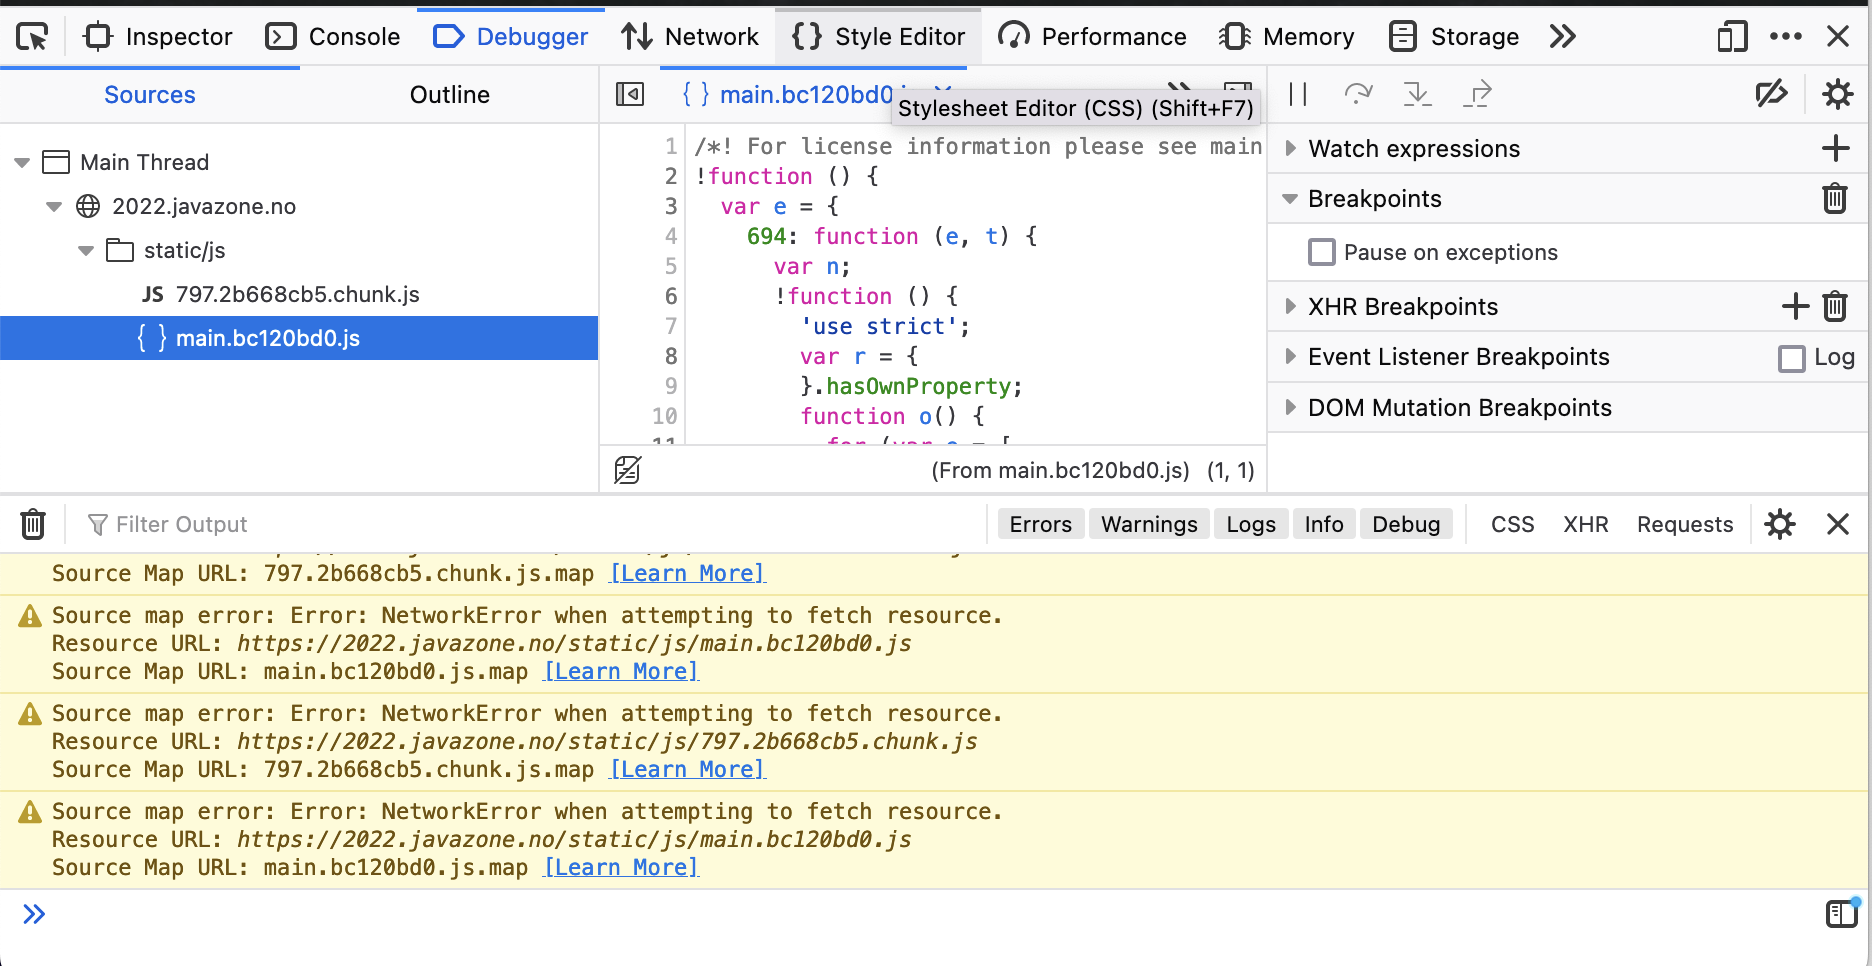
I prefer working with Firefox, I find their developer tools more convenient but both browsers have similar capabilities. Both have fantastic debuggers (as you can see with the Firefox debugger below); unfortunately, many developers limit themselves to console printing instead of exploring this powerful tool.

Tackling Code Obfuscation
Code obfuscation is a common practice in frontend development, employed to protect proprietary code and reduce file sizes for better performance. However, obfuscation also makes the code difficult to read and debug. Fortunately, both Chrome and Firefox developer tools provide a feature to de-obfuscate code, making it more readable and easier to debug. By clicking the curly brackets button in the toolbar, developers can transform a single line of obfuscated code into a well-formed, debuggable file.
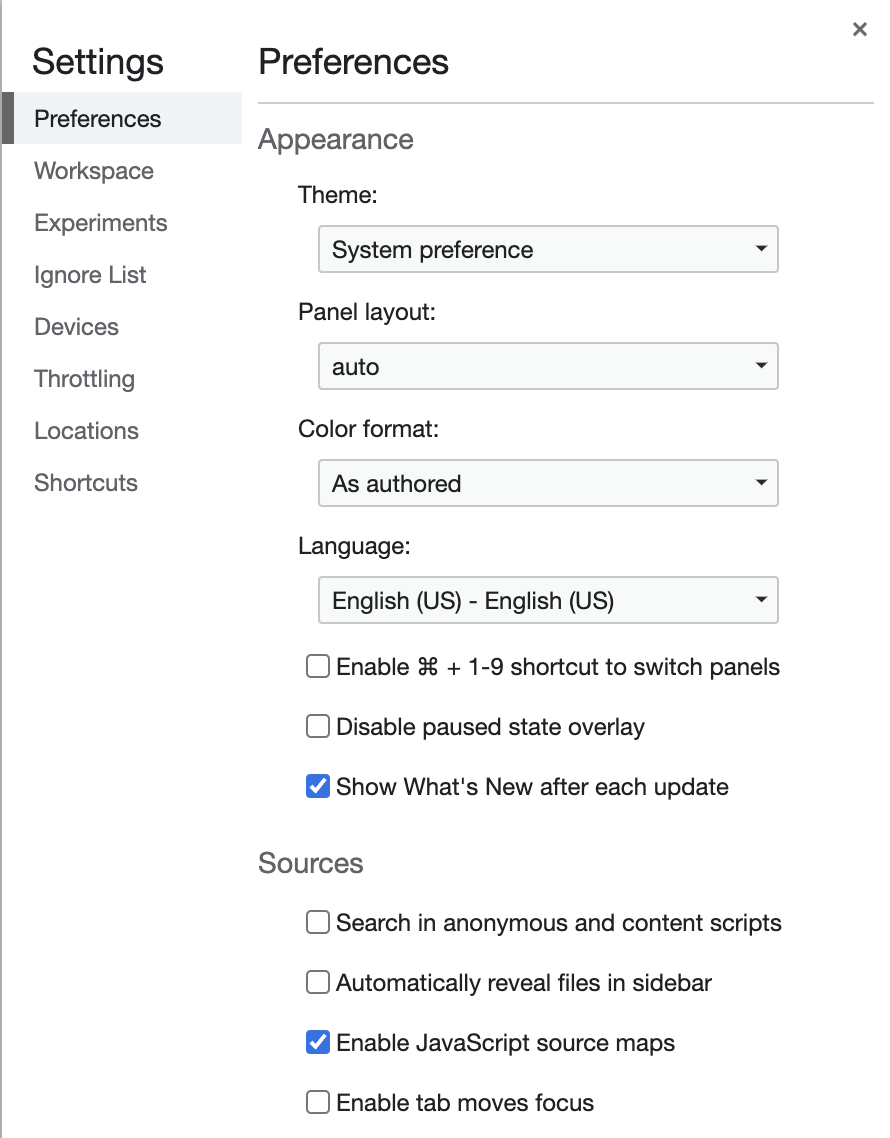
Another important tool in the fight against obfuscation is the source map. Source maps are files that map obfuscated code back to its original source code, including comments. When generated and properly configured, source maps allow developers to debug the original code instead of the obfuscated version. In Chrome, this feature can be enabled by ensuring that “Enable JavaScript source maps” is checked in the developer tools settings.
You can use code like this in the JavaScript file to point at the sourcemap file:
//@sourceMappingURL=myfile.js.map
For this to work in Chrome we need to ensure that “Enable JavaScript source maps” is checked in the settings. Last I checked it was on by default, but it doesn’t hurt to verify:

Debugging Across Layers
Isolating Issues Across the Stack
In full-stack development, issues often manifest in one layer but originate in another. For example, a frontend error might be caused by a misconfigured backend service or a database query that returns unexpected results. Isolating the root cause of these issues requires a methodical approach, starting from the symptom and working backward through the layers.
A common strategy is to reproduce the issue in a controlled environment, such as a local development setup, where each layer of the stack can be tested individually. This helps to narrow down the potential sources of the problem. Once the issue has been isolated to a specific layer, developers can use the appropriate tools and techniques to diagnose and resolve it.
The Importance of System-Level Debugging
Full stack debugging is not limited to the application code. Often, issues arise from the surrounding environment, such as network configurations, third-party services, or hardware limitations. A classic example of this that we ran into a couple of years ago was a production problem where a WebSocket connection would frequently disconnect. After extensive debugging, Steve discovered that the issue was caused by the CDN provider (CloudFlare) timing out the WebSocket after two minutes — something that could only be identified by debugging the entire system, not just the application code.
System-level debugging requires a broad understanding of how different components of the infrastructure interact with each other. It also involves using tools that can monitor and analyze the behavior of the system as a whole, such as network analyzers, logging frameworks, and performance monitoring tools.
Embracing Complexity
Full stack debugging is inherently complex, as it requires developers to navigate multiple layers of an application, often dealing with unfamiliar technologies and tools. However, this complexity also presents an opportunity for growth. By embracing the challenges of full-stack debugging, developers can expand their knowledge and become more versatile in their roles.
One of the key strengths of full-stack development is the ability to collaborate with domain experts. When debugging an issue that spans multiple layers, it is important to leverage the expertise of colleagues who specialize in specific areas. This collaborative approach not only helps to resolve issues more efficiently but also fosters a culture of knowledge sharing and continuous learning within the team.
As tools continue to evolve, so too do the tools and techniques available for debugging. Developers should strive to stay up-to-date with the latest advancements in debugging tools and best practices. Whether it’s learning to use new features in browser developer tools or mastering system-level debugging techniques, continuous learning is essential for success in full-stack development.
Video
Conclusion
Full stack debugging is a critical skill for modern developers, we mistakenly think it requires a deep understanding of both the application and its surrounding environment. I disagree: By mastering the tools and techniques discussed in this post/upcoming posts, developers can more effectively diagnose and resolve issues that span multiple layers of the stack. Whether you’re dealing with obfuscated frontend code, misconfigured backend services, or system-level issues, the key to successful debugging lies in a methodical, collaborative approach.
You don't need to understand every part of the system, just the ability to eliminate the impossible.
Published at DZone with permission of Shai Almog, DZone MVB. See the original article here.
Opinions expressed by DZone contributors are their own.

Comments