Stepping Backwards while Debugging: Move To Line
Join the DZone community and get the full member experience.
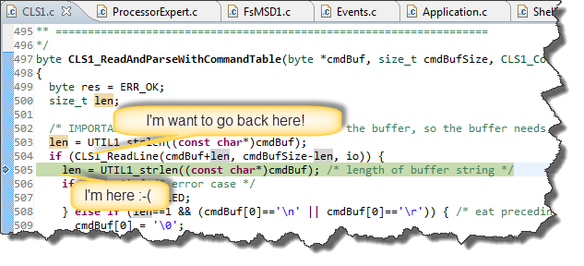
Join For Freeit happens to me many times: i’m stepping with the debugger through my code, and ups! i made one step too far!
what now? restart the whole debugging session?
actually, there is a way to go ‘backwards’
![]()
gdb has a ‘reverse debugging’ feature, described here . i’m using the eclipse based codewarrior debugger, and this debug engine is not using gdb.
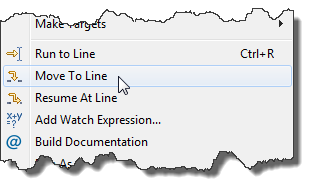
the codewarrior debugger in mcu10.3 supports an eclipse feature: i select a code line in the editor view and use move to line :
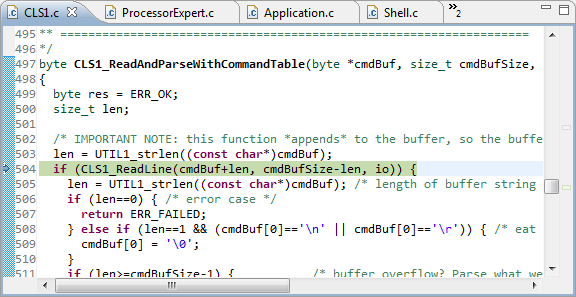
what it does: it changes the current pc (program counter) of the program to that line:
now i can continue debugging from that line, e.g. stepping into that function call.
yes, this is not true backward debugging. but it is simple and very effective. to perform true backward stepping, the debugger would need to reverse all operations, typically with a rather heavy state machine and data recording. but for the usual case where i simply need to go back a few lines, the ‘move to line’ is perfect.
of course there are a few points to consider:
- this only changes the program counter. any variable changes/etc are not affected or reverted.
- in case of highly optimized code, there might be multiple sequence points per source line. so doing this for highly optimized code might not work correctly.
- it works ok within a function. it is not recommended to use it e.g. to set the pc outside of a function. because the context/stack frame is not set up.
i use the ‘move to line’ frequently to ‘advance’ the program execution. e.g. to bypass some long sequences i’m not interested in, or to get out of an ‘endless’ loop.
the same ‘move to line’ as available while doing assembly stepping too. see this post for details.
happy line moving
![]()
Published at DZone with permission of Erich Styger, DZone MVB. See the original article here.
Opinions expressed by DZone contributors are their own.


Comments