Snowflake Performance Tuning: Top 5 Best Practices
Though there may not be many ways to directly tune Snowflake, using best practices can take you a long way.
Join the DZone community and get the full member experience.
Join For FreeHow do you tune the Snowflake data warehouse when there are no indexes, and few options available to tune the database itself?
Snowflake was designed for simplicity, with few performance tuning options. This article summarizes the top five best practices to maximize query performance.

Separate Query Workloads
The single most important method to maximize throughput and minimize latency on Snowflake is to segment query workloads. The diagram below illustrates what should be common design pattern of every Snowflake deployment – separation of workloads.

Unlike other database systems, Snowflake was built for the cloud, and supports an unlimited number of Virtual Warehouses – effectively, independently-sized compute clusters, that share access to a common data store. This EPP architecture (Elastic Parallel Processing) means it’s possible to run complex data science operations, ELT loading and business intelligence queries against the same data without contention for resources.
There is often a temptation to separate workloads by department or team, for example, by giving each team their own virtual warehouses to help track usage by team. However, it’s typically best practice to separate workloads by the type of workload rather than user group. This means running business intelligence queries from marketing users on one warehouse, while running a separate virtual warehouse to support ultra-fast finance dashboard queries on another.
In one case, I had a customer who planned to run fifteen extra-small warehouses to give each team their own dedicated compute resources. However, after analyzing usage, we reduced this to four much larger VWHs, which was both cheaper to run, and provided a better user experience with hugely improved performance.
Maximize Use of the Snowflake Cache
The diagram below illustrates how Snowflake automatically caches data in the Virtual Warehouse (the local disk cache) and in the Result Cache.

While this is automatic behavior, there are two best practices you can implement to maximize cache usage and speed query performance.
Firstly, when segmenting query workload you should place users querying the same data on the same virtual warehouse. This maximizes the chances that data retrieved to the cache by one user will also be used by others.
You should also avoid being too hasty in suspending a virtual warehouse when it’s not in use. By default, any warehouse will automatically suspend after 10 minutes, and auto-resume when a SQL statement is executed. You could set the auto-suspend to as little as a few seconds to save money, but should be aware, when resumed, the virtual warehouse cache may be clean, which means you lose the performance benefits of caching.
Finally, be aware that the result cache is completely independent of virtual warehouse, and any query executed by any user on the account will be served from the result cache, provided the SQL text is exactly the same.
Scale up For Large Workloads

Although not strictly database tuning, it’s important to exploit the power of the Snowflake virtual warehouse to scale up for large workloads.

The SQL code snippet above illustrates how easily a warehouse size can be adjusted, in this case to a 32-node cluster capable of handling a huge processing workload. In testing, this took milliseconds to deploy as Snowflake maintains a pool of resources available, although it may take several minutes during particularly busy times.
Once the processing is complete, it is possible to simply let the cluster automatically suspend, in this case after 300 seconds (five minutes), or the cluster can be suspended immediately the task is complete. If needed, it can automatically resume when another query is executed. The entire process is transparent to the end-user application.
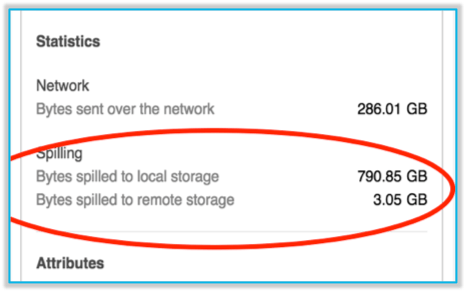
The screenshot below shows one possible indicator of poor warehouse sizing. This indicates the data volume spilled to Local Storage (virtual warehouse SSD), and Remote Storage.

In virtual warehouses, local storage is always fast SSD, but any large sort operations which are unable to complete in memory will inevitably spill to local storage. If, however, you see a large amount of data spilled to external storage, this indicates even the SSD storage has been used up, and data is being written to S3 or Blob storage which is much slower. Both of these are clear indicators you should consider adjusting to a larger virtual warehouse which has both more memory and local SSD storage.
Scale Out For Concurrency
Unlike the scale up option described above, this technique is used to deploy additional clusters of same-sized nodes for concurrency – increasing numbers of users rather than task size or complexity.

The SQL Snippet above shows the statement needed to deploy a Multi-Cluster Scale-out Architecture. Using this method, instead of deploying a cluster of larger machines, this instructs Snowflake to add additional same size clusters, as needed, up to a fixed limit.
The diagram below illustrates the situation whereby the business intelligence virtual warehouse has been configured to automatically add clusters to the existing configuration as additional users execute queries.
This compares markedly to the ELT Warehouse which has been sized as a much larger single cluster to process massive data volumes on a complex task.
This tuning method was used successfully at UK-based food delivery service Deliveroo who, in 2017, ran over 7,000 queries per hour over nearly 20 Terabytes of data, and used Snowflake to automatically scale out the resources to match the end-user query demands.
As the number of concurrent users varies during the day, the clusters are automatically suspended, so you are only charged for the compute resources you actually need. The diagram below illustrates how this happens, with additional clusters automatically added up to the user selected limit, and automatically suspended when not needed.

Tuning Snowflake Using Data Clustering
For very large tables, typically over a terabyte in size, designers should consider defining a cluster key to maximize query performance. Using a cluster key maximizes partition elimination, and therefore improves query performance.
To illustrates the performance benefits of tuning Snowflake using clustering, I set up a benchmark test against the TCP (Transaction Processing Council) table STORE_SALES which held nearly 30 billion rows of sales data in a 1.3Tb table. I then ran the same query against both a clustered and unclustered version of the table, and the results below illustrate the improvement.

By placing a cluster key on the SS_SOLD_DATE_SK column, the queries that filtered by date ran 14 times faster, and scanned nearly 1/30th of the data.
To illustrate the effect of Snowflake Clustering, consider the diagram below in which data is frequently filtered in the query WHERE clause by DATE.
As data is loaded by date, it tends to be naturally clustered, with all data for the same day falling into the same micro-partition. However, if the following SQL is executed, Snowflake will attempt to keep all sale dates in the same micro-partition. When needed, a background task will automatically re-cluster the data, and this compute processing will be charged as a separate item.
Since Snowflake holds the minimum and maximum value of every column in each micro-partition, it can skip over micro-partitions that don’t match the query criteria. To demonstrate the incredible performance benefits of clustering, I created a table with 600 million rows with 16Gb of compressed data, identified by a unique key (ORDER_KEY) which I indicated as the cluster key.
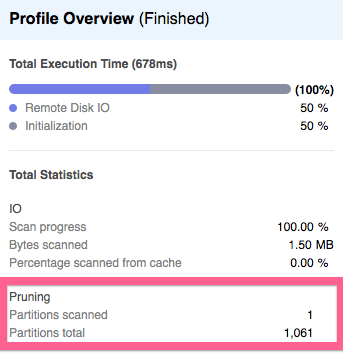
I then executed the query above, to find a record exactly half way through the 600 million rows, and it returned in 88 milliseconds. The screen-shot below from the Snowflake Query Profiler indicates why the query was so fast, it scanned just 1.5Mb of the entire 16Gb of compressed data, as it was able to skip over all but one micro-partition.
This means, simply by using a cluster key, Snowflake was able to skip over 99.91% of the data, but without any of the performance or data management overheads associated with maintaining traditional indexes.
Conclusion
In conclusion, although there are few (if any) options to tune Snowflake for performance, there are some best practices which may be used to maximize query performance and throughput.
Disclaimer: The opinions expressed in my articles are my own, and will not necessarily reflect those of my employer (past or present) or indeed any client I have worked with.
This article was first published on Tuning Snowflake - Top 5 Best Practices
Published at DZone with permission of John Ryan, DZone MVB. See the original article here.
Opinions expressed by DZone contributors are their own.

Comments