Scaling CockroachDB to 200k Writes Per Second
In this article, see how to scale CockroachDB to 200k writes per second using RockDB and Pebble.
Join the DZone community and get the full member experience.
Join For FreeI really like my job, I get to work with interesting use cases. The following investigation is the result of one of these conversations. A customer was evaluating a write-heavy use case with a KV workload, where row is very small consisting of a key and a value. CockroachDB has an equivalent workload conveniently named kv.
The gist of the challenge was scaling the writes to 200,000 rows/sec. I've seen good performance with CockroachDB on various workloads but never evaluated write-heavy and write-only workloads. I decided to investigate the feasibility of this and set out to scale CRDB to reach my target. After several attempts, I settled on the following architecture:
- AWS
us-east-2region - 30
c5d.4xlCockroachDB nodes - 1
c5d.4xlclient machine - CockroachDB
20.1.8
I conducted this test using RocksDB storage engine as well as our new engine called Pebble. I will present both results below.
Our docs linked above have a good overview of getting kv workload up and running. My tests did not include any special tunings, all tests were conducted on the same cluster using default configuration.
There are only two steps to execute the benchmark, initialize and then run the workload.
Run the Initialization Step
./cockroach workload init kv 'postgres://root@10.12.20.73:26257?sslmode=disable'
Run the Workload
xxxxxxxxxx
./cockroach workload run kv \
--duration=2h \
--concurrency 384 \
--read-percent 0 \
'postgres://root@10.12.20.73:26257?sslmode=disable' 'postgres://root@10.12.30.27:26257?sslmode=disable' 'postgres://root@10.12.28.114:26257?sslmode=disable' 'postgres://root@10.12.27.8:26257?sslmode=disable' 'postgres://root@10.12.25.31:26257?sslmode=disable' 'postgres://root@10.12.21.61:26257?sslmode=disable' 'postgres://root@10.12.26.5:26257?sslmode=disable' 'postgres://root@10.12.20.67:26257?sslmode=disable' 'postgres://root@10.12.28.204:26257?sslmode=disable' 'postgres://root@10.12.21.92:26257?sslmode=disable' 'postgres://root@10.12.18.247:26257?sslmode=disable' 'postgres://root@10.12.19.193:26257?sslmode=disable' 'postgres://root@10.12.27.156:26257?sslmode=disable' 'postgres://root@10.12.18.211:26257?sslmode=disable' 'postgres://root@10.12.25.181:26257?sslmode=disable' 'postgres://root@10.12.16.199:26257?sslmode=disable' 'postgres://root@10.12.20.70:26257?sslmode=disable' 'postgres://root@10.12.30.36:26257?sslmode=disable' 'postgres://root@10.12.21.249:26257?sslmode=disable' 'postgres://root@10.12.17.226:26257?sslmode=disable' 'postgres://root@10.12.19.163:26257?sslmode=disable' 'postgres://root@10.12.22.90:26257?sslmode=disable' 'postgres://root@10.12.20.184:26257?sslmode=disable' 'postgres://root@10.12.19.158:26257?sslmode=disable' 'postgres://root@10.12.25.21:26257?sslmode=disable' 'postgres://root@10.12.29.191:26257?sslmode=disable' 'postgres://root@10.12.16.45:26257?sslmode=disable' 'postgres://root@10.12.19.142:26257?sslmode=disable' 'postgres://root@10.12.24.80:26257?sslmode=disable' 'postgres://root@10.12.21.150:26257?sslmode=disable'
Let me step through the run command. I was planning to run the benchmark for two hours because I already knew (spoiler alert) that I can get to 200k using the same hardware. I tested it earlier but I did not have confidence in sustained writes as my previous tests were only 10 minutes. The current benchmark was supposed to be the validation of achieving the set goal. Earlier, I tested with three client machines and both with and without a load balancer. Knowing I can get upwards of 400 concurrent connections to CRDB landed me on 384 mark for concurrency, the client machine was not pegged so in retrospect I could've pushed it further but I was quite satisfied with my test and left it alone.
Finally, using --read-percent flag with 0, will keep inserts at 100%. Also, you may be wondering why my URL strings are separated by white space. Good question and I also found out with help from my colleagues that given the separate URLs will load balance the connections to the database across each node, whereas using a single Postgres URL would only connect to the first node in the connection string and cause hotspotting. That is, the workload will connect to the first URL in the string and only that node will be utilized, while other nodes will remain idle. I filed a docs issue to make it clear in our docs.
The other option is to stand up a load balancer and run the benchmark against the load balancer URL. It does add a bit of complexity and introduces another layer to the formula. All that said, given the command above, you can get comparable results while maintaining simplicity.
I ran the test for two hours using the Pebble storage engine first, it is available starting with 20.1 release using COCKROACH_STORAGE_ENGINE=pebble environment variable during cluster startup. In 20.2, it becomes the default storage engine, but you can switch back to RocksDB using the same environment variable with rocksdb for the value.
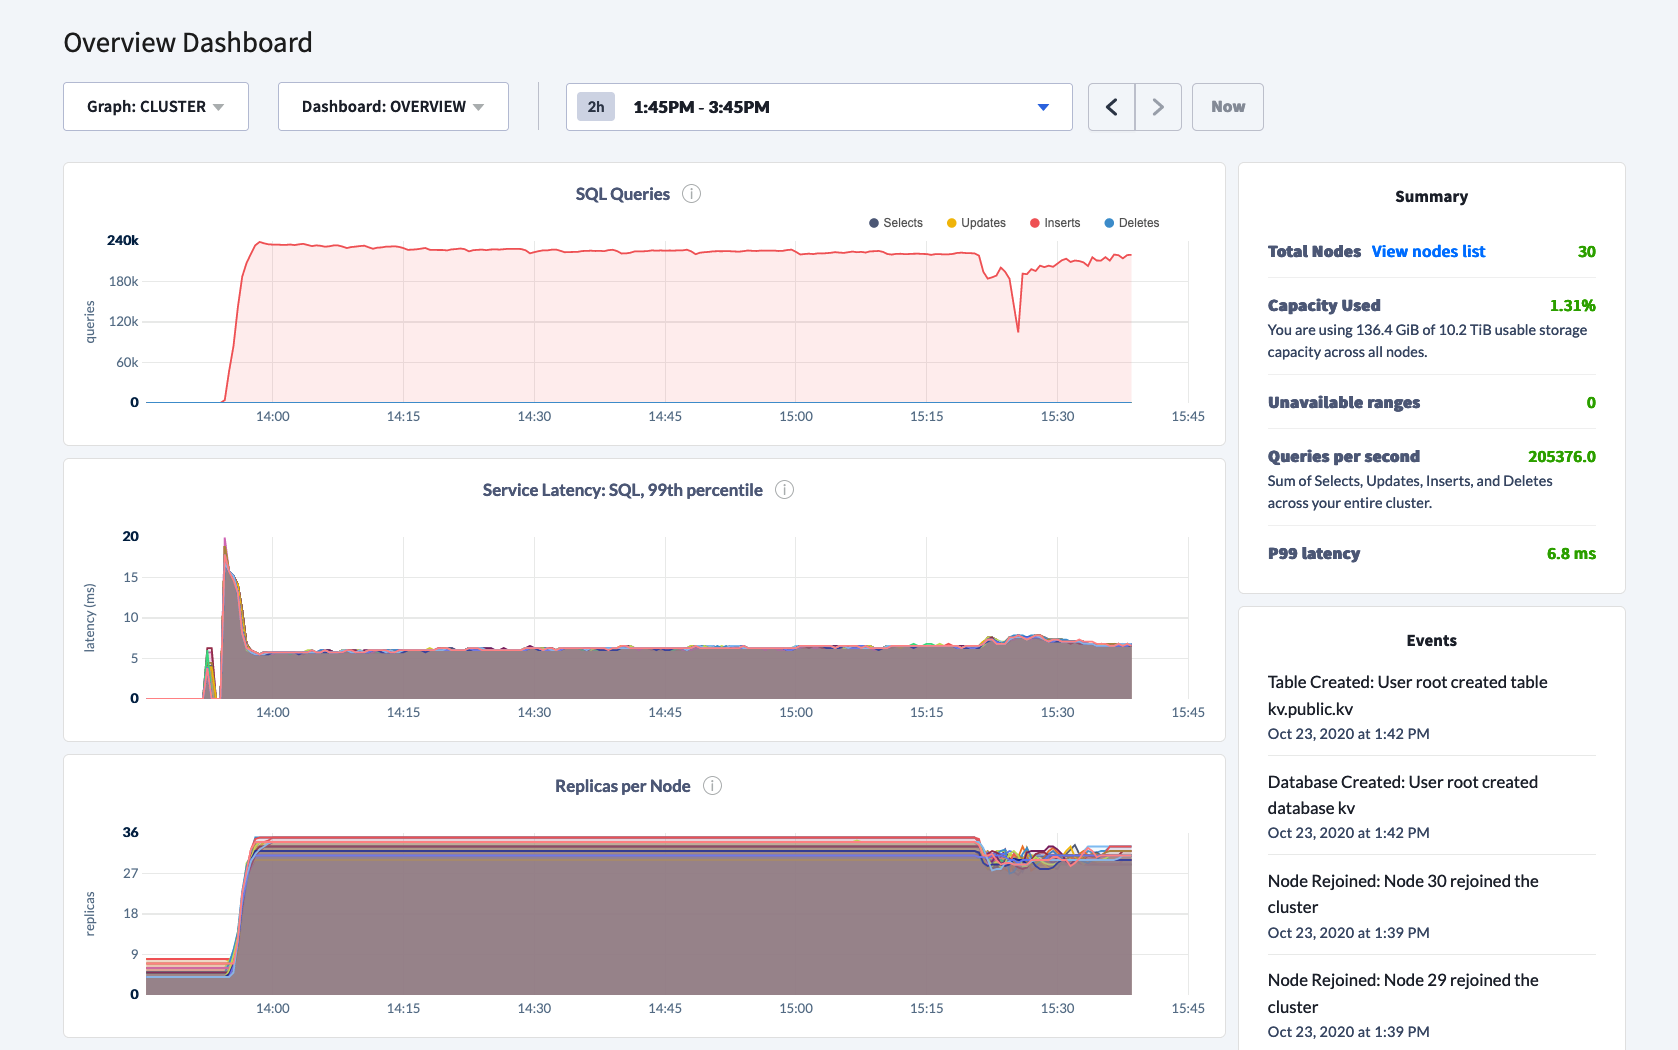
In the two-hour span, writes averaged 230k/sec with an average 99th percentile latency of 6ms. I was pleasantly surprised to see performance stay in the range of 210k-240k/sec and 99th percentile SQL latency within 5-7ms range.
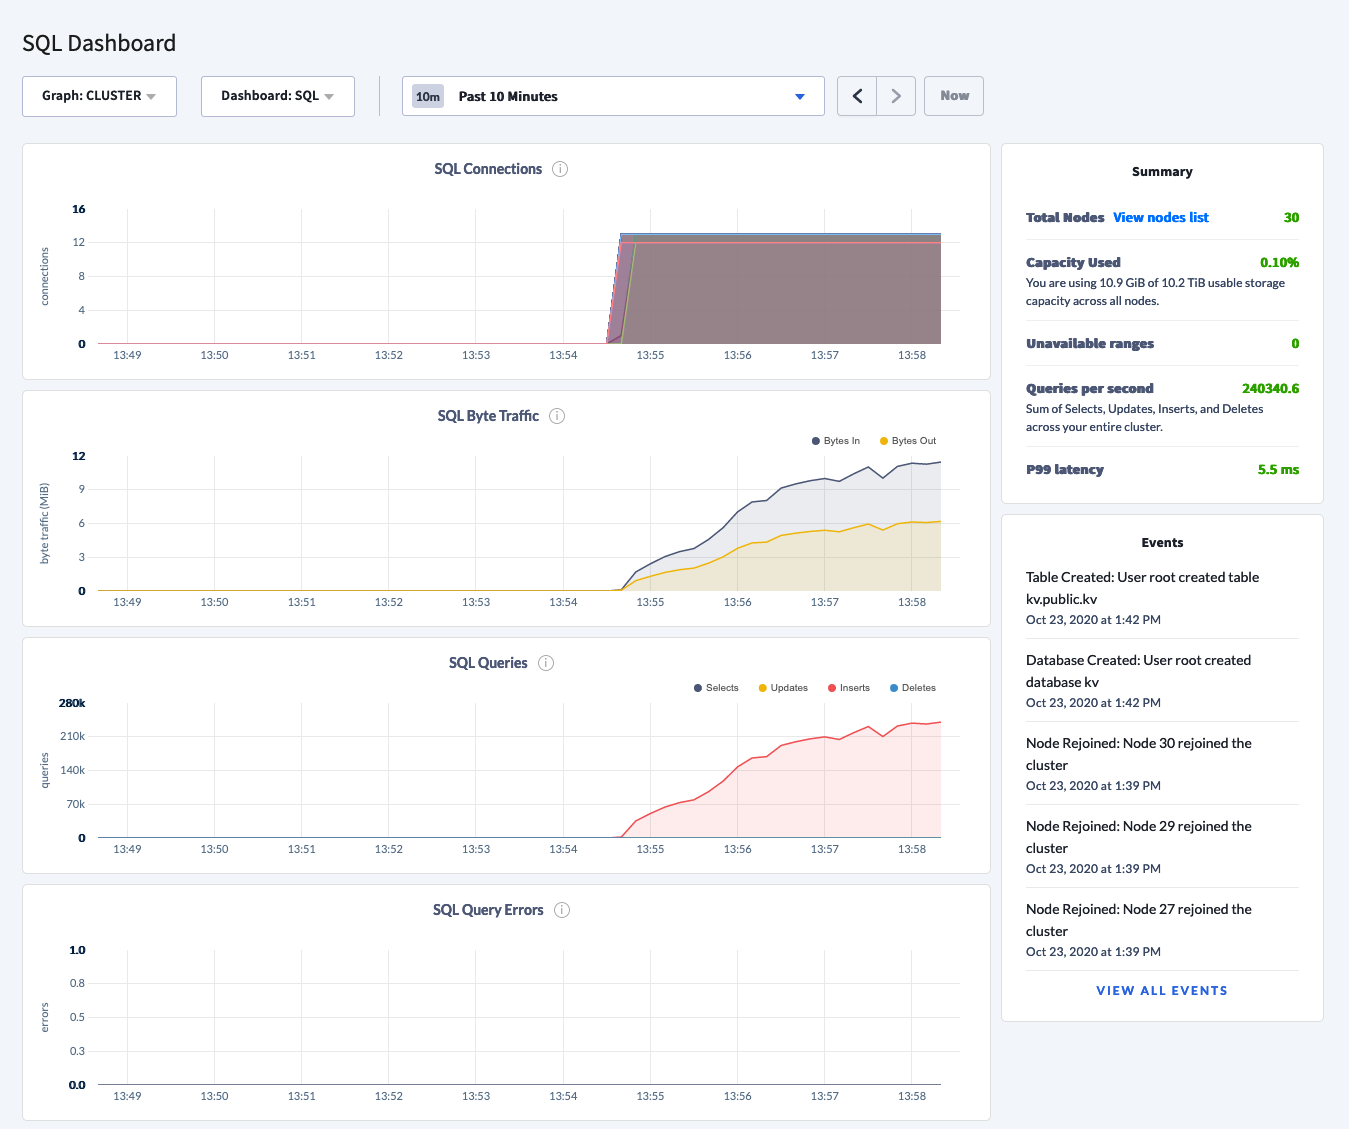
The inserts peaked at 240k
It then leveled off at about 230k
After two hours, the throughput stayed consistently over 200k except for that single dip
SQL connections stayed consistent for the entirety of the test
CPU averaged 65% for each node
It bottomed out at 210k
99th percentiled stayed consistent
Switching to RocksDB
I restarted the cluster with COCKROACH_STORAGE_ENGINE=rocksdb environment variable, initialized the workload again passing --drop flag and ran the same exact command for workload.
View of the RocksDB run
View of the CPU utilization with RocksDB
99th percentile latency using RocksDB
I was surprised to see the variable performance with multiple dips where writes fell to 0. I will reach out to engineering for guidance, but for my test, the writing was on the wall. Pebble can sustain heavy write throughput for a long duration, (we will ignore the small dip at the end pictured above), the performance was on par.
Given the drastic variability in results, I decided to not run the benchmark for two hours using RocksDB. I will give it benefit of a doubt as there may be garbage collection that I didn't account for when I dropped the workload table after the Pebble run.
The goal of this post is not to emphasize the differences in performance between Pebble and RocksDB, it did serve CockroachDB well for so many years after all. The goal really is to show whether CockroachDB can sustain heavy write traffic and for sustained periods of time. Achievement unlocked!
Published at DZone with permission of Artem Ervits. See the original article here.
Opinions expressed by DZone contributors are their own.


Comments