Reshaping the Data Engineer’s Experience With Declarative Engineering
Revolutionizing data engineering through declarative engineering by simplifying pipelines and allowing engineers to focus on modeling and optimization.
Join the DZone community and get the full member experience.
Join For FreeData is widely considered the lifeblood of an organization; however, it is worthless—and useless—in its raw form. Help is needed to turn this data into life-giving information. Part of this help is to move this data from its source to its destination via data pipelines. However, managing the end-to-end data pipeline lifecycle is not easy: some are challenging to scale on demand, and others can result in delays in detecting and addressing issues or be difficult to control. These and the other problems may be solved in the declarative programming paradigm, and in this article, we will see it on Terraform.
Where Does This Data Come From?
The data in these extensive datasets come from multiple disparate sources and are typically loaded into datasets in data storage like ClickHouse via data pipelines. These pipelines play a critical role in this process by efficiently moving, transforming, and processing the data.
For instance, imagine you own a data analytics startup that provides organizations with real-time data analytics. Your client owns an eBike hire startup that wants to integrate weather data into its existing data to inform its marketing messaging strategies. Undoubtedly, your data engineers will set up many different data pipelines, pulling data from many sources. The two we are concerned with are designed to extract data from your client’s CRM and the local weather station.
The Layers of the Modern Data Stack
A data stack is a collection of different technologies, logically stacked on top of each other, that provide end-to-end data processing capabilities.
As described here, a data stack can have many different layers. The modern data stack consists of ingestion (data pipelines), storage (OLAP database), and business intelligence (data analytics) layers. Lastly, there is an orchestration layer—for example, Kubernetes or Docker Compose—that sits on top of these layers, orchestrating everything together so that the stack does what it is supposed to do; ergo, ingest raw data and egest advanced predictive analytics.
Data Pipelines are typically structured either as Extract, Transform, Load (ETL) or Extract, Load Transform (ELT) pipelines. However, developing, monitoring, and managing these data pipelines, especially in international enterprises with many branches worldwide, can be highly challenging, especially if the end-to-end data pipeline monitoring process is manual.
Developing Data Pipelines, the Traditional Way
Data pipelines are broadly categorized into two groups: code-based and deployed in a Direct Acyclic Graph or DAG-like tools such as Airflow and Apache Fink or non-code-based, which are often developed in a SaaS-based application via a drag-and-drop UI. Both have their own problems.
Code-based data pipelines are challenging to scale on demand. The development/test/release cycle is typically too long, especially in critical environments with thousands of pipelines, loading petabytes of data into data stores daily. Additionally, they are typically manually implemented, deployed, and monitored by human data engineers, allowing the risk of errors creeping in and significant downtime.
With non-code-based data pipelines, engineers don’t have access to the backend code; there can be limited visibility and monitoring, resulting in delays in detecting and addressing issues and failures. Moreover, it is challenging to reproduce errors, as making an exact copy of the pipeline is impossible. Lastly, version control using a tool like Git is complex. It is harder to control the evolution of a pipeline as the code is not stored in a repository such as a GitHub repo.
The Solution: Improving Your Data Pipelines With Declarative, Reproducible, Modular Engineering
The good news is that there is a sustainable solution to these challenges.
It is important to remind ourselves of the difference between imperative and declarative programming. In imperative programming, you control how things happen. In declarative programming, you express the logic without specifying the control flow.
The answer to the end-to-end data pipeline development, deployment, monitoring, and maintenance challenges is to utilize the declarative programming paradigm, that is, abstracting the computation logic. In practice, this is best achieved by using Terraform by HashiCorp — an open-source project that is an infrastructure-as-code development tool.
Because modern world data-intensive application architecture is very similar to the data stack the applications run on, Terraform provides the framework that will make your data stack declarative, reproducible, and modular.
Let’s return to our data analytics startup example described above to elucidate these concepts further. Imagine your data analytics app is a web application that executes inside Terraform. As expected, the most significant part of the application is the ClickHouse database.
We must build two data pipelines to ETL data from the CRM system—stored in a PostgreSQL database—into the ClickHouse database, transforming and enriching the data before loading it into ClickHouse. The second pipeline extracts real-time weather data from the local weather service—through an API and transforms it—ensuring there are no errors and enriching it—before loading it into ClickHouse.
Using Terraform to Code the Data Pipelines
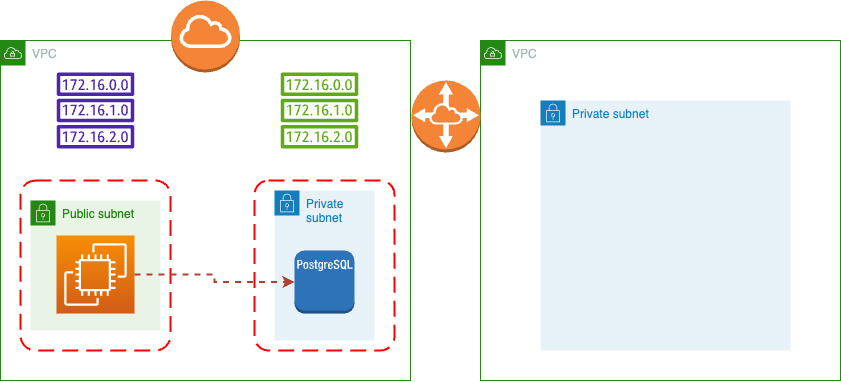
Classic infrastructure for modern cloud-based applications looks like:

This is an oversimplification but a more or less solid way of building applications.
You have a public subnet with a user facing API/UI, which is connected to a private subnet where data is stored.
To simplify things, let’s look at how to use Terraform to build the first data pipeline—to ETL data from your RDBMS (in this case, PostgreSQL) system into the ClickHouse database.

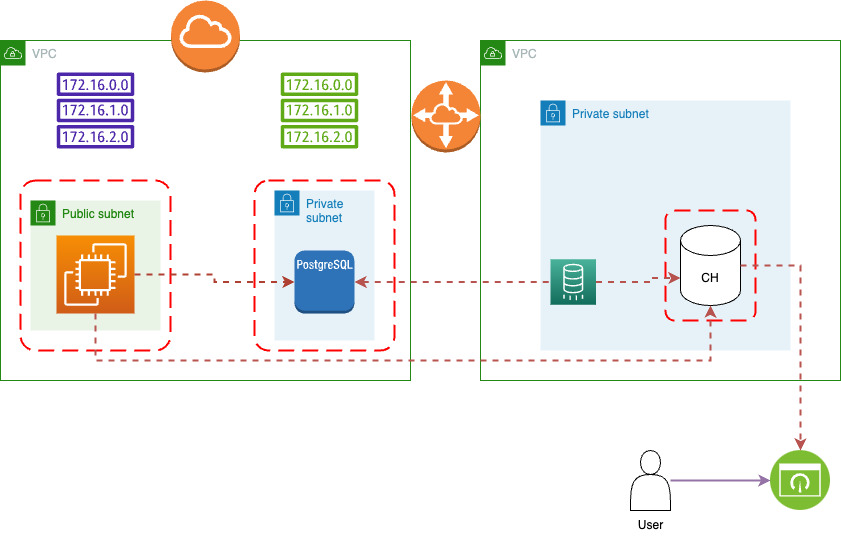
This diagram visualizes the data pipeline that ELTs the data from the RDBMS database into the ClickHouse database and then exposes as a connection to Visualization service.
This workflow must be reproducible as your company’s information technology architecture has at least three environments: dev, QA, and prod.
Enter Terraform. Let’s look at how to implement this data pipeline in Terraform.
Note: it is best practice to develop modular code, distilled down to the smallest unit, which can be reused many times.
The first step is to start with a main.tf file, containing nothing more than the provider’s definition.
provider "doublecloud" {
  endpoint       = "api.double.cloud:443"
  authorized_key = file(var.dc-token)
}
provider "aws" {
  profile = var.profile
}
The second step is to create a BYOA network:
data "aws_caller_identity" "self" {}

data "aws_region" "self" {}

# Prepare BYOC VPC and IAM Role
module "doublecloud_byoc" {
  source  = "doublecloud/doublecloud-byoc/aws"
  version = "1.0.2"
  providers = {
    aws = aws
  }
  ipv4_cidr = var.vpc_cidr_block
}

# Create VPC to peer with
resource "aws_vpc" "peered" {
  cidr_block                       = var.dwh_ipv4_cidr
  provider                         = aws
}

# Get account ID to peer with
data "aws_caller_identity" "peered" {
  provider = aws
}

# Create DoubleCloud BYOC Network
resource "doublecloud_network" "aws" {
  project_id = var.dc_project_id
  name       = "alpha-network"
  region_id  = module.doublecloud_byoc.region_id
  cloud_type = "aws"
  aws = {
    vpc_id          = module.doublecloud_byoc.vpc_id
    account_id      = module.doublecloud_byoc.account_id
    iam_role_arn    = module.doublecloud_byoc.iam_role_arn
    private_subnets = true
  }
}

# Create VPC Peering from DoubleCloud Network to AWS VPC
resource "doublecloud_network_connection" "example" {
  network_id = doublecloud_network.aws.id
  aws = {
    peering = {
      vpc_id          = aws_vpc.peered.id
      account_id      = data.aws_caller_identity.peered.account_id
      region_id       = var.aws_region
      ipv4_cidr_block = aws_vpc.peered.cidr_block
      ipv6_cidr_block = aws_vpc.peered.ipv6_cidr_block
    }
  }
}

# Accept Peering Request on AWS side
resource "aws_vpc_peering_connection_accepter" "own" {
  provider                  = aws
  vpc_peering_connection_id = time_sleep.avoid_aws_race.triggers["peering_connection_id"]
  auto_accept               = true
}

# Confirm Peering creation
resource "doublecloud_network_connection_accepter" "accept" {
  id = doublecloud_network_connection.example.id

  depends_on = [
    aws_vpc_peering_connection_accepter.own,
  ]
}

# Create ipv4 routes to DoubleCloud Network
resource "aws_route" "ipv4" {
  provider                  = aws
  route_table_id            = aws_vpc.peered.main_route_table_id
  destination_cidr_block    = doublecloud_network_connection.example.aws.peering.managed_ipv4_cidr_block
  vpc_peering_connection_id = time_sleep.avoid_aws_race.triggers["peering_connection_id"]
}

# Sleep to avoid AWS InvalidVpcPeeringConnectionID.NotFound error
resource "time_sleep" "avoid_aws_race" {
  create_duration = "30s"

  triggers = {
    peering_connection_id = doublecloud_network_connection.example.aws.peering.peering_connection_id
  }
}
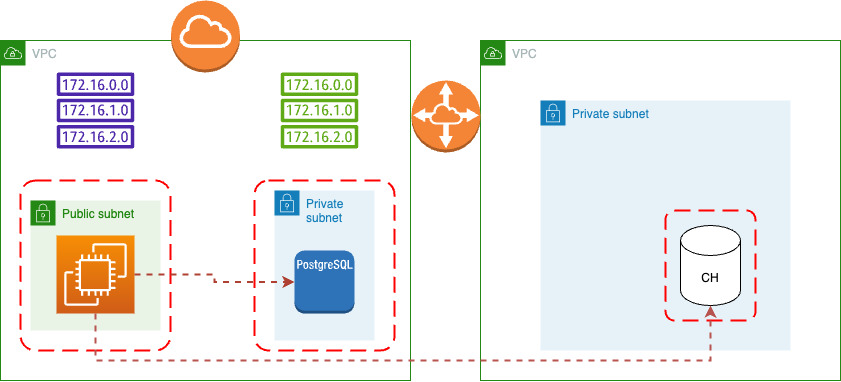
This is preparing our Stage for later clusters. Architecture after terraform apply looks follows:

Once we prepare a stage, we can create a cluster in this private-subnet:
resource "doublecloud_clickhouse_cluster" "alpha-clickhouse" {
  project_id = var.dc_project_id
  name       = "alpha-clickhouse"
  region_id  = var.aws_region
  cloud_type = "aws"
  network_id = doublecloud_network.aws.id

  resources {
    clickhouse {
      resource_preset_id = "s1-c2-m4"
      disk_size          = 34359738368
      replica_count      = 1
    }
  }

  config {
    log_level       = "LOG_LEVEL_TRACE"
    max_connections = 120
  }

  access {
    ipv4_cidr_blocks = [
      {
        value       = doublecloud_network.aws.ipv4_cidr_block
        description = "DC Network interconnection"
      },
      {
        value       = aws_vpc.tutorial_vpc.cidr_block
        description = "Peered VPC"
      },
      {
        value       = "${var.my_ip}/32"
        description = "My IP"
      }
    ]
    ipv6_cidr_blocks = [
      {
        value       = "${var.my_ipv6}/128"
        description = "My IPv6"
      }
    ]
  }
}
This is added to our Stage for simple Clickhouse Cluster.

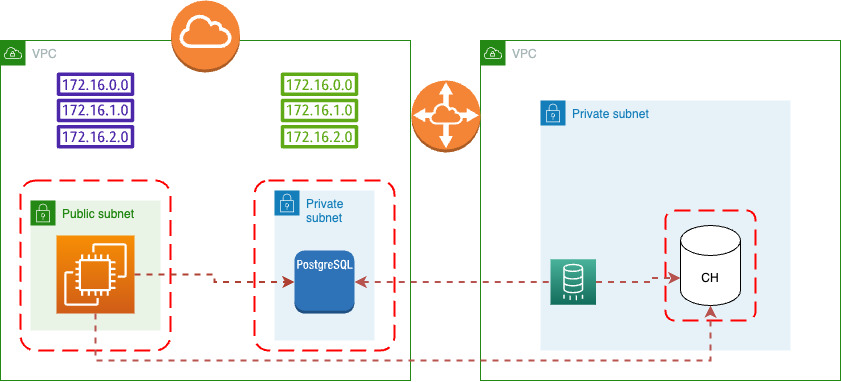
But this cluster is still empty, so we must enable transfer between PostgreSQL and ClickHouse:
resource "doublecloud_transfer_endpoint" "pg-source" {
  name       = "chinook-pg-source"
  project_id = var.dc_project_id
  settings {
    postgres_source {
      connection {
        on_premise {
          tls_mode {
            ca_certificate = file("global-bundle.pem")
          }
          hosts = [
            aws_db_instance.tutorial_database.address
          ]
          port = 5432
        }
      }
      database = aws_db_instance.tutorial_database.db_name
      user     = aws_db_instance.tutorial_database.username
      password = var.db_password
    }
  }
}

data "doublecloud_clickhouse" "dwh" {
  name       = doublecloud_clickhouse_cluster.alpha-clickhouse.name
  project_id = var.dc_project_id
}

resource "doublecloud_transfer_endpoint" "dwh-target" {
  name       = "alpha-clickhouse-target"
  project_id = var.dc_project_id
  settings {
    clickhouse_target {
      connection {
        address {
          cluster_id = doublecloud_clickhouse_cluster.alpha-clickhouse.id
        }
        database = "default"
        user     = data.doublecloud_clickhouse.dwh.connection_info.user
        password = data.doublecloud_clickhouse.dwh.connection_info.password
      }
    }
  }
}

resource "doublecloud_transfer" "pg2ch" {
  name       = "postgres-to-clickhouse-snapshot"
  project_id = var.dc_project_id
  source     = doublecloud_transfer_endpoint.pg-source.id
  target     = doublecloud_transfer_endpoint.dwh-target.id
  type       = "SNAPSHOT_ONLY"
  activated  = false
}

This is adding a ELT snapshot process between PostgreSQL and ClickHouse.
As a last piece, we can add a connection to this newly created cluster to visualization service:
resource "doublecloud_workbook" "dwh-viewer" {
  project_id = var.dc_project_id
  title      = "DWH Viewer"

  config = jsonencode({
    "datasets" : [],
    "charts" : [],
    "dashboards" : []
  })

  connect {
    name = "main"
    config = jsonencode({
      kind          = "clickhouse"
      cache_ttl_sec = 600
      host          = data.doublecloud_clickhouse.dwh.connection_info.host
      port          = 8443
      username      = data.doublecloud_clickhouse.dwh.connection_info.user
      secure        = true
      raw_sql_level = "off"
    })
    secret = data.doublecloud_clickhouse.dwh.connection_info.password
  }
}

As you can see, most of the code consists of variables. Therefore, executing this code to set up the different environments is easy by adding a stage_name.tfvars file and running Terraform apply with it.
Note: See the Terraform documentation for more information on .tvars files.
// This variable is to set the
// AWS region that everything will be
// created in
variable "aws_region" {
  default = "eu-west-2" // london
}

// This variable is to set the
// CIDR block for the VPC
variable "vpc_cidr_block" {
  description = "CIDR block for VPC"
  type        = string
  default     = "10.0.0.0/16"
}

// This variable holds the
// number of public and private subnets
variable "subnet_count" {
  description = "Number of subnets"
  type        = map(number)
  default = {
    public  = 1,
    private = 2
  }
}

// This variable contains the configuration
// settings for the EC2 and RDS instances
variable "settings" {
  description = "Configuration settings"
  type        = map(any)
  default = {
    "database" = {
      allocated_storage   = 10            // storage in gigabytes
      engine              = "postgres"    // engine type
      engine_version      = "15.4"        // engine version
      instance_class      = "db.t3.micro" // rds instance type
      db_name             = "chinook"     // database name
      identifier           = "chinook"     // database identifier
      skip_final_snapshot = true
    },
    "web_app" = {
      count         = 1          // the number of EC2 instances
      instance_type = "t3.micro" // the EC2 instance
    }
  }
}

// This variable contains the CIDR blocks for
// the public subnet. I have only included 4
// for this tutorial, but if you need more you
// would add them here
variable "public_subnet_cidr_blocks" {
  description = "Available CIDR blocks for public subnets"
  type        = list(string)
  default = [
    "10.0.1.0/24",
    "10.0.2.0/24",
    "10.0.3.0/24",
    "10.0.4.0/24"
  ]
}

// This variable contains the CIDR blocks for
// the public subnet. I have only included 4
// for this tutorial, but if you need more you
// would add them here
variable "private_subnet_cidr_blocks" {
  description = "Available CIDR blocks for private subnets"
  type        = list(string)
  default = [
    "10.0.101.0/24",
    "10.0.102.0/24",
    "10.0.103.0/24",
    "10.0.104.0/24",
  ]
}

// This variable contains your IP address. This
// is used when setting up the SSH rule on the
// web security group
variable "my_ip" {
  description = "Your IP address"
  type        = string
  sensitive   = true
}
// This variable contains your IP address. This
// is used when setting up the SSH rule on the
// web security group
variable "my_ipv6" {
  description = "Your IPv6 address"
  type        = string
  sensitive   = true
}

// This variable contains the database master user
// We will be storing this in a secrets file
variable "db_username" {
  description = "Database master user"
  type        = string
  sensitive   = true
}

// This variable contains the database master password
// We will be storing this in a secrets file
variable "db_password" {
  description = "Database master user password"
  type        = string
  sensitive   = true
}

// Stage 2 Variables

variable "dwh_ipv4_cidr" {
  type        = string
  description = "CIDR of a used vpc"
  default     = "172.16.0.0/16"
}
variable "dc_project_id" {
  type        = string
  description = "ID of the DoubleCloud project in which to create resources"
}
Conclusion
There you have it. A small modern data stack that ETLs data from a PostgreSQL database into a ClickHouse database.
The best news is that you can set up multiple data pipelines—as many as you need—using the code in this example. There is also a complete example that you can find here, with additional features like adding a peer connection to your existing VPC and creating a sample ClickHouse database with a replication transfer between the two databases.
Have fun playing with your small modern data stack!
Opinions expressed by DZone contributors are their own.

Comments