Prometheus vs. Grafana in 2023: A Detailed Comparison
Both Prometheus and Grafana are widely liked and used, with vibrant, opinionated communities, and they routinely build on top of each other.
Join the DZone community and get the full member experience.
Join For FreePrometheus and Grafana are two big names in the open-source world of observability. Both are widely liked and used, with vibrant, opinionated communities, and they routinely build on top of each other.
So, how do Prometheus and Grafan stack up against each other? In this blog, we’ll compare them and examine:
- How their offerings overlap and differ
- How they perform against each other on a variety of criteria
- How they’re commonly used — together and separately, and why
Introduction to Prometheus and Grafana Prometheus
Prometheus is a monitoring solution. An open-source project, it was started by SoundCloud in 2012 and has since gained immense popularity and traction. One reason for its widespread adoption is its seamless integration with Kubernetes. Prometheus is the de facto monitoring standard for a Kubernetes environment.
Prometheus Offering
At its core, Prometheus is a time-series DB that uses a pull mode to fetch metrics from instrumented jobs. With its multidimensional data model and flexible query language, Prometheus allows devs to easily get, store, and work with metrics data.
- Data Collection: Prometheus discovers and scrapes metrics from predefined targets, typically service endpoints or infra components.
- Data Storage: Prometheus has a time-series DB that allows for highly efficient storage and querying of metrics data.
- Querying with PromQL: PromQL (Prometheus Query Language) is used to retrieve and analyze metrics. It’s a flexible query language allowing for precise slicing, dicing, and aggregation of data, ideal for deep performance analysis.
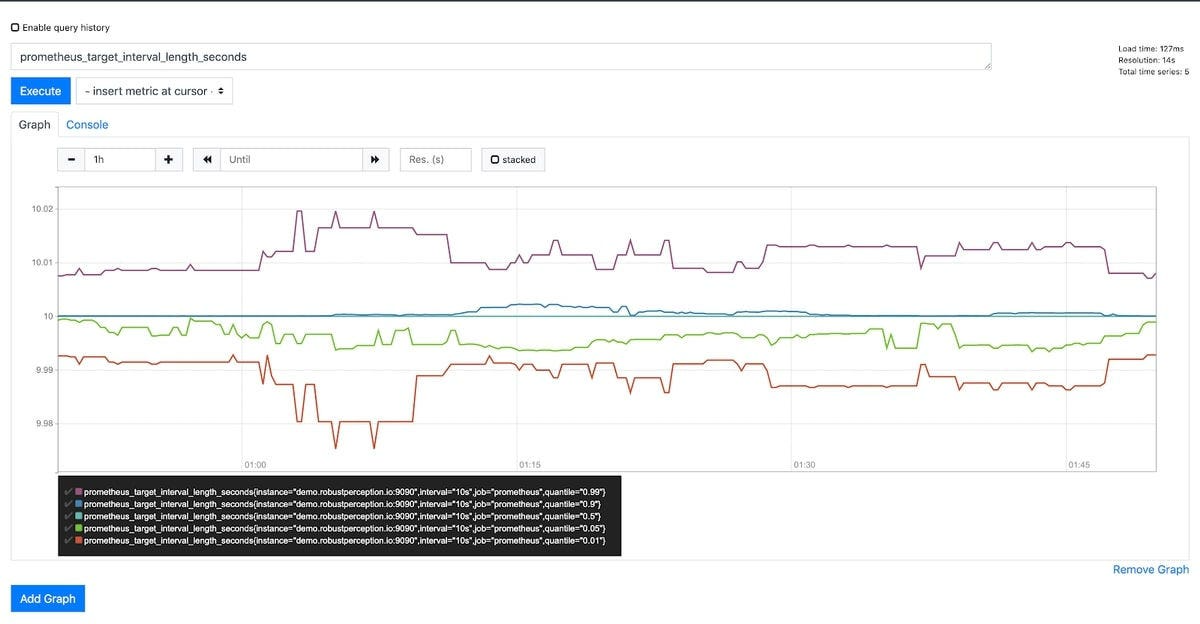
- Visualization: Prometheus comes with a built-in visualization interface, but it is basic and primarily intended for ad-hoc querying. For a richer, more robust visualization experience, Prometheus recommends using Grafana.
Prometheus Expression browser:
 Prometheus expression browser snapshot
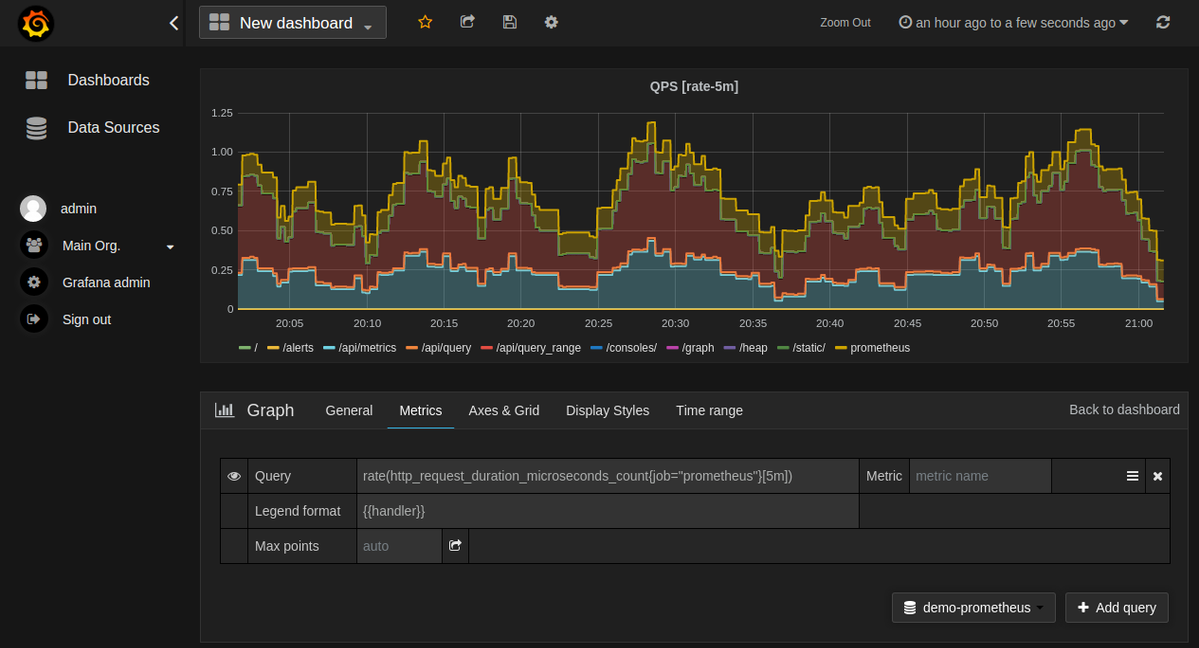
In contrast, the Grafana visualization of Prometheus data is much richer.

A Grafana dashboard
Grafana
Grafana started as a visualization tool. However, over the years, Grafana has evolved into a full-stack observability platform. It not only helps users visualize data but also assists in collecting and aggregating it. Grafana can be used not just for metrics but also for other observability data (logs and traces).
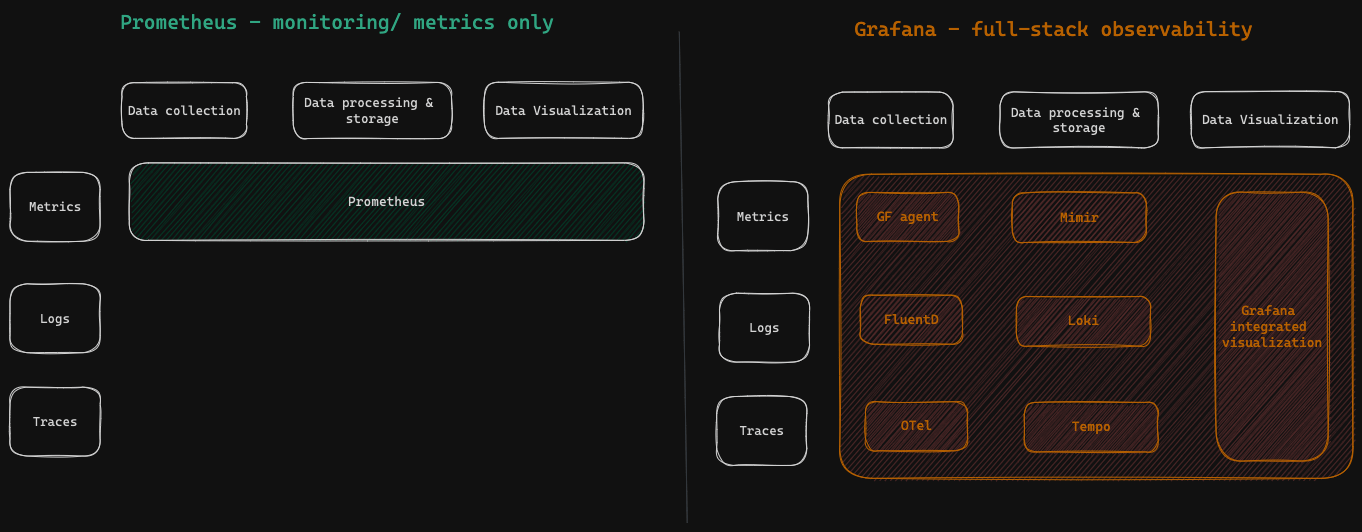
See the image below for the difference between Prometheus and Grafana offerings.
 Prometheus vs Grafana
In summary, the primary difference is that Prometheus is primarily a monitoring solution, while Grafana is a more comprehensive, full-stack solution that can be used across metrics, traces, and logs.
Prometheus vs. Grafana: Detailed Assessment
Now that we understand what each of Prometheus and Grafana offers let us compare them across the following criteria
- Core observability functions (Data collection, processing & storage)
- Scalability
- Querying
- Alerting
- Visualization (Visualization, UI/ UX, collaboration)
- Others (Documentation, ease of deployment, integrations, and pricing)
Summary Assessment
Features |
Prometheus |
Grafana |
Breadth of solution |
✓(Only metrics) |
✓✓ ( across metrics, logs, traces) |
Data collection/ instrumentation |
✓✓ (metrics) |
✓✓ (also has logs/ traces; metrics agent similar to Prometheus) |
Data Storage |
✓ (purpose-built for metrics;) |
✓✓ (across metrics, logs, traces; metrics DB built on top of Prometheus) |
Scalability |
✓ |
✓✓(Mimir more scalable) |
Alerting |
✓✓ (built-in AlertManager) |
✓ (slightly less performant) |
Querying |
✓✓ (PromQL) |
✓✓ (Built on PromQL) |
Visualization & User Flows |
||
Visualization |
✓ |
✓✓ |
UI & UX |
✓ |
✓✓ |
Collaboration |
✗ |
✓✓ |
Other |
||
Documentation |
✓✓ |
✓✓ |
Easy Deployment |
✓✓ |
✓ |
Integration with other tools |
✓✓ |
✓✓ |
Free Plan |
✓✓ (open-source) |
✓✓ (open-source, plus paid cloud version) |
✓✓ - Complete Feature Available
✓ - Partially Present
✗ - Feature Missing
Detailed Assessment
Data Collection/ Instrumentation
The main difference today is that Prometheus supports data collection for just metrics, while Grafana agent can be used for collection and forwarding of traces and logs as well.
Note that for metrics data collection, Prometheus introduced an agent mode (Prom agent) in 2021 to make the solution more scalable. The Prom agent was inspired by the Grafana agent and mainly takes the code related to metrics functionality from it.
In summary, the Grafana agent trumps for a few reasons:
- Allows you to collect and forward traces and logs as well
- You can send data to OTel systems as well (not just Prometheus-based ones)
- Allows more control over the agent’s components with Grafana’s rich UI debugging capabilities. Prometheus agent is preferred in situations where teams are only focused on metrics data or are in the process of switching between standard Prometheus to prom agent.
See here for a more detailed comparison between the Prometheus and Grafana agents.
Data Storage
Prometheus shines within metrics data storage with its efficient time-series database, optimized for the retention and querying of time-stamped metrics. Its unique storage model ensures that older data is compacted and can be efficiently queried over long periods.
Grafana now has data storage back-ends across metrics, traces, and logs. Loki for log aggregation and storage, Tempo for distributed traces, and Mimir for metrics.
For metrics itself, should you use Grafana Mimir or Prometheus? Note that Grafana Mimir builds on Prometheus, and many pieces of it have Prometheus code, so there is some overlap :)
In general, Prometheus is more widely used/ popular. That said, Mimir is a more modern metrics solution that addresses many of the challenges with Prometheus (like multi-tenancy, longer retention, and faster queries). See here for a more detailed comparison.
They’re also compatible with each other, so if you have a Prometheus agent, you could just set it to send data to a Mimir cluster so they’re compatible with each other.
Scalability
When it comes to scalability, Prometheus adopts a pull-based, single-tenant model, which, while straightforward, poses challenges as systems grow. To handle vast amounts of data, Prometheus typically requires sharding and federation, adding some complexity.
Grafana Mimir, on the other hand, is built for scalability and high performance. It has a distributed multi-tenant model that allows you to scale horizontally seamlessly and a dedicated long-term storage solution to store and process vast amounts of data.
Grafana wins on scalability here.
Querying
Functional query language, PromQL, is both robust and expressive, allowing users to extract intricate details from their metrics. Alerts in Prometheus are defined using the same query language, ensuring precision.
Grafana can leverage PromQL as well. In keeping with the theme of both companies building on top of each other, Grafana has also built its own Prometheus query builder, which improves on PromQL.
Alerting
Prometheus has a separate component called the Prometheus Alert Manager that allows you to create and manage any alerts based on Prometheus data. It’s widely used, proven and well-liked.
Historically, Grafana alerting was limited to data on the dashboards. However, with Grafana’s evolution into full-stack, Grafana alerting has become more comprehensive.
Grafana Alerting now allows you to define alerts based on any Grafana data (Loki logs, Mimir, Tempo traces). The engine allows you to define alert criteria, evaluation frequency, time duration for evaluation, and composite criteria and also set notification policies like where and to whom the alerts are routed. You could mute alerts for a while or stop receiving notifications for a specific alert altogether.
That said, Prometheus AlertManager still has an edge within metrics as it allows for more complex alerts with complex queries and calculations, with better performance. Grafana Alerting uses a SQL database, so performance may not be great.
Visualization
For data visualization, Grafana is the star. Its dashboards are customizable, intuitive, and designed for a great user experience. Prometheus, on the other hand, has a basic visualization interface. It's functional but lacks the polish and flexibility Grafana offers.
If rich visuals and dashboards are your focus, Grafana is the clear choice. Prometheus provides the data; Grafana makes it look good.
UI & UX
Diving into UI and UX, Grafana offers a sleek, user-friendly interface, making dashboard creation and navigation a breeze. In contrast, Prometheus focuses more on its core functionalities, with a UI that's straightforward but not as refined. For those prioritizing a smooth user experience and intuitive layout, Grafana has the edge. However, if you're looking purely for functionality and don't mind a steeper learning curve, Prometheus gets the job done.
Collaboration and Team Management
With built-in features like user roles, permissions, and team-centric dashboards, Grafana enables easy collaboration.
Prometheus, on the other hand, leans heavily on its robust metrics collection, lacking advanced team features. If seamless team coordination is your goal, Grafana takes the cake.
Documentation
Both provide thorough resources. Prometheus distinctly carves a niche with detailed help on the metric collection, including best practices and common pitfalls. Grafana, on the other hand, hosts an extensive library of resources, spanning tutorials on dashboards, panels, and its expanding list of plugins. While Prometheus's documentation reads like a deep, technical manual, Grafana offers a blend of user guides, tutorials, and community-contributed content.
Both projects are very well-documented and have vibrant communities/
Deployment
Prometheus is straightforward to deploy banking on its standalone nature with configurations primarily via YAML files. This minimalism makes its initial setup somewhat swift.
Grafana, conversely, offers a lot of integrations, making it versatile but forcing a steeper initial learning curve. Though Prometheus speaks the language of simplicity, Grafana whispers promises of adaptability. As for teams preferring a plug-and-play approach, Grafana might demand a bit more patience, but its flexibility is worth the elbow grease.
Integrations
Prometheus, with its dedicated exporters, zeroes in on extracting metrics from various services, ensuring a tailored fit. It excels within metrics.
Grafana, however, plays a broader game. Its vast array of plugins supports numerous data sources, helping in seamless integration.
This is just a function of whether you’re looking for metrics alone or also for other observability.
Pricing
Both projects are 100% open-source. Prometheus has an Apache v2.0 license, while Grafana has an AGPL license.
Prometheus does not have a cloud version. However, several other players offer hosted Prometheus — e.g., Amazon-managed service for Prometheus, Google Cloud-managed service for Prometheus, and many other independent players.
Grafana, on the other hand, offers its own cloud version, which is paid for. It’s a robust, tightly integrated offering that brings the best of the proven Grafana stack and makes it available as a hosted solution,
Better Together?
As we saw above, Grafana and Prometheus build on each other a lot and are happy partners in the open-source observability ecosystem.
The decision is often not really Grafana vs. Prometheus but how to use Prometheus and Grafana together in the best way possible.
Grafana and Prometheus in Practice: Typical Combinations and Configurations
In real-world observability scenarios, the flexibility of Prometheus and Grafana allows for a range of configurations, each tailored to suit different requirements. Here's a quick dive into how these tools are commonly set up together for metrics:
Grafana-Prometheus Configurations in Monitoring
Within monitoring, companies do Grafana-only, Prometheus-only, or. combination of the two (see image below).

- Prometheus back-end + Grafana visualization: This setup is quite popular. Companies here use Prometheus servers/ agents with the Prometheus DB and use Grafana to visualize the metrics.
- Mimir + Grafana visualization: Increasingly becoming popular. Teams adopting this are looking for cohesion - the same platform doing the back-end and front-end. They deploy Grafaan agents, push data to Mimir, and visualize on Grafana dashboards.
- Prometheus server + Prometheus visualization: This is less common. It's typically adopted by teams with specific needs or those that are in the nascent stages of their observability journey. However, as organizations scale and demand more intricate visualizations, they often switch to Grafana for a broader visualization palette.
Grafana-Prometheus Configurations in Overall Observability Stack
1. Prometheus for Metrics Alone, Grafana for the Rest
 Prometheus for metrics, Grafana for everything else
This is where teams use Prometheus for just metrics back-end and Grafana for traces and logs, with an integrated visualization layer.
This allows for a single-pane-of-glass experience, where the developer sees all observability data on the same dashboard. It's also one of the most commonly preferred configurations. Most teams already have Prometheus setup as their monitoring tool and are used to it, so they tend to prefer this model. The native compatibility between Prometheus and Grafana visualization makes this a popular choice.
2. Grafana Stack for Everything
 All-in LGTM Grafana Observability stack
This is the full Grafana observability option, widely known as the LGTM stack (Loki for logs, Grafana for visualization, Tempo for traces, and Mimir for metrics).
This is being adopted by much more modern teams who’re either setting up their observability anew or refreshing their stack and are looking for less expensive options vs. the commercial players. This offers a tightly integrated experience, much like a Datadog or NewRelic, while having the advantages of being open-source and flexible.
What’s Next? AI Layer on Top
Once you have your basic observability set up, what next? Recent developments in AI are set to dramatically change how we implement observability. Even with a strong observability stack, developers still need to navigate large volumes of data to zero in on incident-specific data that they’re looking for.
There’s a new class of AI solutions (e.g., ZeroK) that solve this — they sit on top of your existing observability stack and use AI to allow you to debug issues more rapidly.
 AI Observability layer
When a production incident occurs, these AI observability solutions pull incident-specific data from across Prometheus, Grafana, and the rest of your observability stack and generate AI inferences on the most probable root causes. This helps drastically reduce MTTR and also offers a unified incident-specific dashboard for troubleshooting.
Summary
We looked at a comprehensive assessment of Prometheus vs. Grafana — their offerings, where they overlap and how they differ, how they perform across different dimensions, and how they're often used together. They're both robust offerings within their own categories and liberally borrow from each other. Both have contributed significantly to advancing the open-source observability ecosystem.
Published at DZone with permission of Vivek Badani. See the original article here.
Opinions expressed by DZone contributors are their own.

Comments