Performance Testing AWS Deployments
Using a multitude of components to test the infrastructure at every level, check out how this testing stack can monitor AWS performance.
Join the DZone community and get the full member experience.
Join For Free
Below is the performance testing strategy used for implementation using JMeter, BlazeMeter and Selenium Webdriver.
Goals
- Ninety-nine percent of the page-load times for the users accessing the applications should be less than or equal to two seconds.
- Users are based out of continents — North America (New York), Europe (London), Asia (Singapore).
- N concurrent users should be able to use the application without any page-load lags.

Components
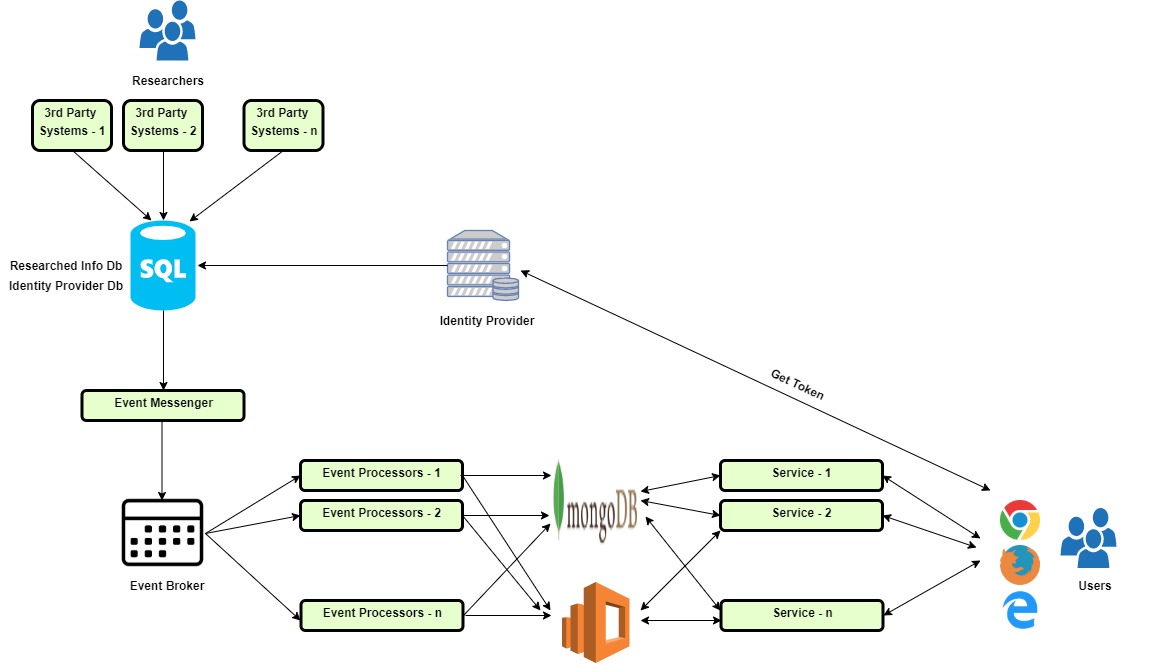
Third Party Systems — Researchers gather the data.
SQL Server —
Researched Info Database
Identity Provider Database
Event Messenger — Component that picks up data from the Researched Info Database and puts it in the Event Broker.
Event Processor — Components that are listening to the Event Broker, who pick up the data from the Event Broker and push it into MongoDB and Elastic Search.
Middle Tier — Services that pull the data from MongoDB and the Elastic Search and send it to the Front End in the form of REST APIs.
Front End — Data entered by the Researchers to be displayed.
Architecture
Researchers enter the data in the Third Party Systems.
Data is thereby stored in SQL Database —Researched Database.
A dedicated table is created in the Researched Info Database mentioned in Step 2, wherein the data entered in the original schema of the Researched Info Database is stored in the format for Event Sourcing.
Event Messenger does the job of picking up the data from the dedicated table from Researched Info Database in Step 3 and pushes it to the Event Broker.
Event Processors pick up the data in the Event Broker and push it to MongoDB and Elastic Search.
On the other end, there is a service-oriented architecture, in which each of the services fetches the data from the Elastic Search and provides the data to the front end in the form of REST APIs.
The front-end is a single-page application that consumes the data sent by REST APIs and renders the page.
There is a dedicated Identity provider, which manages the identity of the user across all the applications the user has access to as a part of the subscription. The database that holds details related to the user identity is present in the SQL Database mentioned in Step 2.
Technology Stack
Event Messenger / Event Processor / Services — .NET Core
Event Store [Event Broker]
ReactJS [User Interface]
Test Environment Configuration
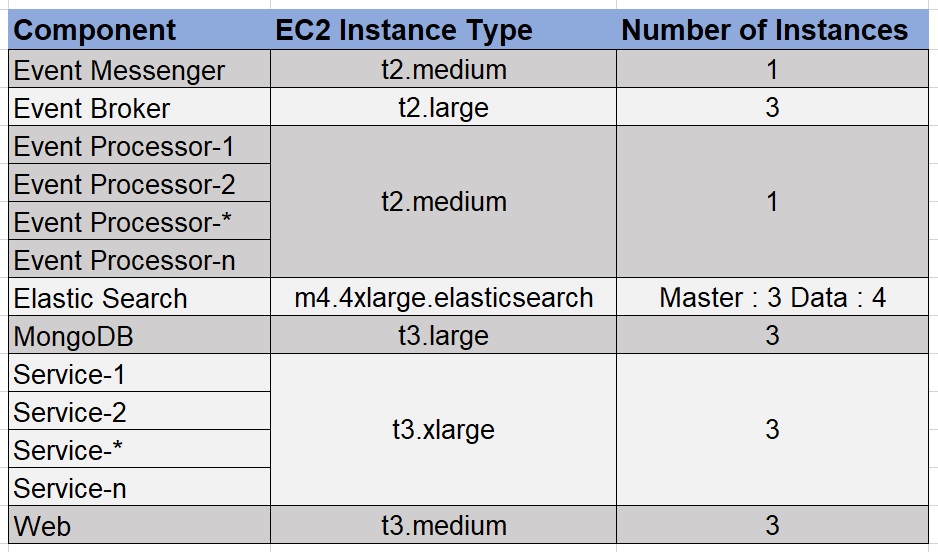
The configuration of the production-like environment that we used for running our performance tests was as shown in the table below. Details about each of the Instance types can be found here.

Performance Testing Tools
Performance Test Types
- Load Test — It is conducted for validating the performance characteristics of the system when subjected to workload/load volume that is anticipated during the production load. Conducting this type of test before releasing the system to the market provides confidence and mitigates the risk of losing business due to performance issues.
- Spike Test — It is conducted to find out the stability of the system when it is loaded in bursts of very small time, releasing the load quickly.
- Endurance Test — It is conducted to find out whether the system is capable of handling the expected load without any deterioration of response time/throughput when run for a longer time. Conducting this type of test before releasing to the market provides confidence on the availability and stability of the system.
- Page Load Test — It is conducted to compute the page load times from the end user experience—when the desired number of concurrent users generates a specific amount of load.
Strategy
Replicating the load for n concurrent users is the first task, especially in the scenarios wherein the number of concurrent users will be on the higher side. There are two approaches for achieving this:
- Replicating the end-user behavior by having automated UI tests that perform operations on the application as the real world user would do. Using a browser automation library like Selenium Web Driver for writing UI automation, which in turn will mimic the end-user behavior, is an option. This can be a Selenium Grid setup, which will drive user flows on multiple machines.
- The second approach is wherein load can be generated on the server for the n-1 concurrent users using REST APIs. Then have just one user to execute the UI test flows and thereby compute the page load times.
There may be pros and cons for taking up either of these approaches. However, we opted for the latter.
JMeter Test — REST APIs
Let’s take the example of all the REST API calls made when a specific page loads, as in the snapshot below.

The JMeter script for the corresponding page will be as in the snapshot below. It consists of all the REST APIs chained together when a specific page loads.

The JMX file in the snapshot above is one-to-one mapping for every API call made in the network tab for the corresponding page load. Multiple such JMX files were created, which consist of REST APIs chained when the specific pages loaded.
Selenium Web Driver — Page Load Test
The UI test would navigate to the specific page in the application; note the timestamp before clicking on the page, then click on the link, and then note the timestamp when the page load is completed. This script used to wait for the entire page to be loaded— left to right and top to bottom.
import org.openqa.selenium.By;
import org.openqa.selenium.TimeoutException;
import org.openqa.selenium.WebDriver;
import org.openqa.selenium.WebElement;
import org.openqa.selenium.chrome.ChromeDriver;
import org.openqa.selenium.firefox.FirefoxDriver;
import org.openqa.selenium.support.ui.ExpectedConditions;
import org.openqa.selenium.support.ui.WebDriverWait;
import org.testng.annotations.AfterSuite;
import org.testng.annotations.BeforeSuite;
import org.testng.annotations.Test;

import java.io.File;
import java.io.IOException;
import java.io.InputStream;
import java.nio.file.Files;
import java.nio.file.Paths;
import java.text.DateFormat;
import java.text.SimpleDateFormat;
import java.util.*;
import java.util.concurrent.TimeUnit;

public class ComputePageLoadTime {

private static WebDriver driver = null;
private static String fileSeparator = File.separator;
private static String resourcesPath = System.getProperty("user.dir") + fileSeparator + "src" + fileSeparator
+ "main" + fileSeparator + "resources" + fileSeparator;
private static String resultsDirectoryPath = System.getProperty("user.dir") + fileSeparator + "results"
+ fileSeparator;
private static String configPropertiesFileName = "config.properties";
private static String currentSessionResultsDirectoryPath = "";
private static String reportName = "";
private static Properties configProperties = null;
private static Properties testProperties = null;
private static String testEnv = "";

private void readProperties(String propertiesFileName) {

configProperties = new OrderedProperties();
InputStream inputStream = getClass().getClassLoader().getResourceAsStream(configPropertiesFileName);

try {

configProperties.load(inputStream);

} catch (IOException e) {

e.printStackTrace();

}

if (System.getProperty("env") != null) {

testEnv = System.getProperty("env");

}else {

testEnv = configProperties.get("env").toString();

}

testProperties = new OrderedProperties();
inputStream = getClass().getClassLoader().getResourceAsStream(propertiesFileName);

try {

testProperties.load(inputStream);

} catch (IOException e) {

e.printStackTrace();
}

reportName = testProperties.get("ReportName").toString();

}

private void configureDriver() {

String operatingSystem = System.getProperty("os.name").toLowerCase();
String chromeDriverPath = "";

if (operatingSystem.contains("win")) {

chromeDriverPath = configProperties.getProperty("chromedriverWindows");

}else {

System.exit(1);

}

System.setProperty("webdriver.chrome.driver", resourcesPath + chromeDriverPath);

driver = new ChromeDriver();
driver.manage().window().maximize();

}

private void createResultsDirectory() {

DateFormat dateFormat = new SimpleDateFormat("dd-MM-yyyy-HH-mm-ss");
Date date = new Date();

currentSessionResultsDirectoryPath = resultsDirectoryPath + reportName + "_" + dateFormat.format(date)
+ fileSeparator;

File file = new File(currentSessionResultsDirectoryPath);
file.setWritable(true);

try {

if (!Files.exists(Paths.get(resultsDirectoryPath)))

Files.createDirectory(Paths.get(resultsDirectoryPath));

Files.createDirectory(Paths.get(currentSessionResultsDirectoryPath));

} catch (IOException e) {

e.printStackTrace();

}

}

@BeforeSuite
public void setupTheAutomationEnvironment(inputTestDataPropertiesFileName) {

readProperties();

String inputTestDataPropertiesFileName = System.getProperty("testDataPropertiesFileName",
"testData.properties");

createResultsDirectory();

}

@Test
public void loadPagesAndComputeLoadTime() {

int numLoops = Integer.parseInt(System.getProperty("loops", "20"));
int pageLoadTimeout = Integer.parseInt(System.getProperty("pageLoadTimeout", "20"));
List<List<String>> allResultsData = new ArrayList<>();
List<List<String>> resultsData = new ArrayList<>();
List<String> headers = Arrays.asList("Test Case", "URL", "Load time (ms)");
String allResultsFilePath = currentSessionResultsDirectoryPath + "Results.csv";
String loginUrl = configProperties.getProperty("applicationUrl");
String userName = configProperties.getProperty("userNameStr");
String password = configProperties.getProperty("passwordStr");

resultsData.add(headers);

for (int i = 0; i < numLoops; i++) {

String outputFileName = "Run" + i + ".csv";
Enumeration<String> enums = (Enumeration<String>) testProperties.propertyNames();

while (enums.hasMoreElements()) {

String key = enums.nextElement();
String value = testProperties.getProperty(key);

if (value.contains("https")) {

configureDriver();

driver.get(loginUrl);
driver.findElement(By.xpath(configProperties.getProperty("userName"))).sendKeys(userName);
driver.findElement(By.xpath(configProperties.getProperty("password"))).sendKeys(password);
driver.findElement(By.xpath(configProperties.getProperty("rememberMeBtn"))).click();
driver.findElement(By.xpath(configProperties.getProperty("submitBtn"))).click();

String url = testProperties.getProperty(key).replace("env", testEnv);
long startTime = System.currentTimeMillis();
long endTime, totalLoadTime;
driver.get(url);
WebDriverWait wait = new WebDriverWait(driver, pageLoadTimeout);
String pageLoadElementWorkdayIconXpath = "//div[@id='workDayIcon']";
List<String> currentLoopResults = new ArrayList<>();

try {

wait.until(ExpectedConditions.or(ExpectedConditions
.visibilityOfElementLocated(By.xpath(pageLoadElementWorkdayIconXpath))));
endTime = System.currentTimeMillis();
totalLoadTime = endTime - startTime;
currentLoopResults = Arrays.asList(key, url, String.valueOf(totalLoadTime));

} catch (TimeoutException e) {

currentLoopResults = Arrays.asList(key, url, String.valueOf(-1));
resultsData.add(currentLoopResults);
allResultsData.add(currentLoopResults);
driver.close();
continue;

}

resultsData.add(currentLoopResults);
allResultsData.add(currentLoopResults);
driver.close();

}

}

String currentSessionResultFilePath = currentSessionResultsDirectoryPath + outputFileName;
CSVUtils.writeToCsv(currentSessionResultFilePath, resultsData);

}

CSVUtils.writeToCsvNormalized(allResultsFilePath, allResultsData);

}

@AfterSuite
public void teardownTheAutomationEnvironment() {

if (driver != null) {

driver.quit();

}

}

}
The overall performance test setup was as in the snapshot below:

The performance test setup consisted of the BlazeMeter REST API tests mimicking the behaviour of n-1 users. The users were equally distributed among London, New York, and Singapore. At the same time, there were AWS EC2 instances spawned in the same three locations. There was a Selenium Web Driver test executed on each of the EC2 instances, which would help to compute the page load times. The Selenium Web Driver tests would perform the following steps:
- Launch the application URL and login.
- Navigate to the page on which the link to be clicked is present.
- Note the timestamp (T1).
- Click on the link.
- Note the timestamp (T2).
Actual Page Load Time = T2 — T1.
BlazeMeter Endurance Test

In order to track the performance of the AWS infrastructure, the following parameters were noted on the AWS console.
Elastic Search — Cluster Status

Elastic Search — Search Rate

Elastic Search — HTTP_Requests_By_Response_Codes

Elastic Search — Indexing Latency

Elastic Search — Master CPU Utilization

Elastic Search — Master JVM Memory Pressure

Elastic Search — Data Maximum CPU Utilization

Elastic Search — Data Maximum JVM Memory Pressure

MongoDB — CPU Utilization

Public API— CPU Utilization

Using the above setup, we were able to performance tune our AWS deployments, uncover the performance leaks, and better optimize our infrastructure.
Opinions expressed by DZone contributors are their own.

Comments