OpenTelemetry Moves Past the Three Pillars
Here, learn the answer to questions about OpenTelemetry and predictions of several important trends that will continue to gain momentum over the next year.
Join the DZone community and get the full member experience.
Join For FreeThis is an article from DZone's 2021 Application Performance Management Trend Report.
For more:
Read the Report
Last summer, the OpenTelemetry project reached the incubation stage within the Cloud Native Computing Foundation. At the same time, OpenTelemetry passed another mile marker: over 1,000 contributing developers representing over 200 different organizations. This includes significant investments from three major cloud providers (Google, Microsoft, and AWS), numerous observability providers (Lightstep, Splunk, Honeycomb, Dynatrace, New Relic, Red Hat, Data Dog, etc.), and large end-user companies (Shopify, Postmates, Zillow, Uber, Mailchimp, etc.). It is the second-largest project within the CNCF, after Kubernetes.
What is driving such widespread collaboration? And why has the industry moved so quickly to adopt OpenTelemetry as a major part of their observability toolchain? This article attempts to answer these questions and to predict several important trends that will continue to gain momentum as OpenTelemetry stabilizes over the next year.
OpenTelemetry Overview
OpenTelemetry is a telemetry system. This means that OpenTelemetry is used to generate metrics, logs, and traces, and then transmits them to various storage and analysis tools. OpenTelemetry is not a complete observability system, meaning it does not perform any long-term storage, analysis, or alerting. OpenTelemetry also does not have a GUI. Instead, OpenTelemetry is designed to work with every major logging, tracing, and metrics product currently available. This makes OpenTelemetry vendor-neutral: It is designed to be the telemetry pipeline to any observability back end you may choose.
The goal of the OpenTelemetry project is to standardize the language that computer systems use to describe what they are doing. This is intended to replace the current babel of competing vendor-specific telemetry systems, a situation which has ceased to be desirable by either users or providers. At the same time, OpenTelemetry seeks to provide a data model that is more comprehensive than any previous system, and better suited for the needs of machine learning and other forms of large-scale statistical analysis.
OpenTelemetry Project Structure
The OpenTelemetry architecture is divided into three major components: the OpenTelemetry Protocol (OTLP), the OpenTelemetry Collector, and the OpenTelemetry language clients. All these components are designed via a specification process, which is managed by the OpenTelemetry Technical Committee. The features described in the specification are then implemented in OTLP, the Collector, and various languages via Special Interest Groups (SIGs), each of which is led by a set of maintainers and approvers. This project structure is defined by the OpenTelemetry Governance Committee, which works to ensure these rules and processes support and grow a healthy community.
OpenTelemetry Clients
In order to instrument applications, databases, and other services, OpenTelemetry provides clients in many languages. Java, C#, Python, Go, JavaScript, Ruby, Swift, Erlang, PHP, Rust, and C++ all have OpenTelemetry clients. OpenTelemetry is officially integrated into the .NET framework.
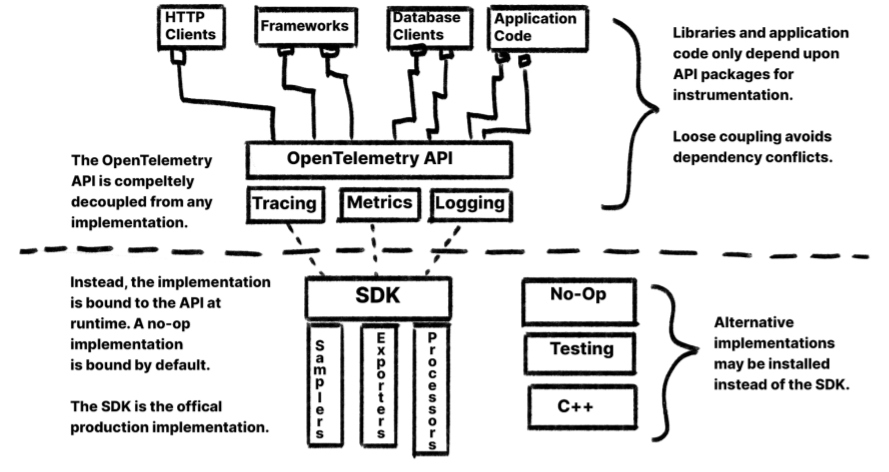
OpenTelemetry clients are separated into two core components: the instrumentation API and the SDK. This loose coupling creates an important separation of concerns between the developers who want to write instrumentation and the application owners who want to choose what to do with the data. The API packages only contain interfaces and constants and have very few dependencies. When adding instrumentation, libraries and application code only interact with the API. At runtime, any implementation may be bound to the API and begin handling the API calls. If no implementation is registered, a No-Op implementation is used by default.
The SDK is a production-ready framework that implements the API and includes a set of plugins for sampling, processing, and exporting data in a variety of formats, including OTLP. Although the SDK is the recommended implementation, using it is not a requirement. For extreme circumstances where the standard implementation will not work, an alternative implementation can be used. For example, the API could be bound to the C++ SDK, trading flexibility for performance.
The OpenTelemetry Collector
The OpenTelemetry Collector is a stand-alone service for processing telemetry. It provides a flexible pipeline that can handle a variety of tasks: Routing, configuration, format translation, scrubbing, and sampling are just examples.
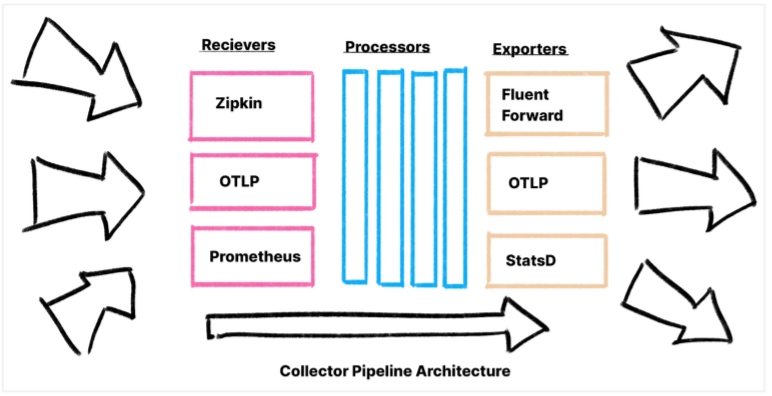
The Collector has a straightforward architecture. Receivers ingest data in a variety of formats, and over 45 data sources are currently supported. Receivers translate this data into OTLP, which is then handed to processors, which perform a variety of data manipulation tasks. Data can be scrubbed, normalized, and decorated with additional information from Kubernetes, host machines, and cloud providers. With processors, every common data processing task for metrics, logs, or traces can be accomplished in the same place.
After passing through processors, exporters convert the data into a variety of formats and send it on to the back end — or whatever the next service in the telemetry pipeline may be. Multiple exporters may be run at the same time, allowing data to be teed off into multiple observability back ends simultaneously.
OTLP
The OpenTelemetry Protocol (OTLP) is a novel data structure. It combines tracing, metrics, logs, and resource information into a single graph of data. Not only are all these streams of data sent together through the same pipe, but they are also interconnected. Logs are correlated with traces, allowing transaction logs to be easily indexed. Metrics are also correlated with traces. When a metric is emitted while a trace is active, trace exemplars are created, associating that metric with a sample of traces that represent different metric values. And all this data is associated with resource information describing host machines, Kubernetes, cloud providers, and other infrastructure components.
OpenTelemetry Is Driving Three Trends
By design, industry adoption of OpenTelemetry is creating a number of benefits. In particular, there are three positive shifts that represent a significant change in the observability landscape.
Shared Telemetry, Competing Analysis
Traditionally, observability systems were vertically integrated. This is commonly referred to as the "Three Pillars" model of observability. For example, a new metrics product would develop a time-series database, and at the same time, create a protocol, a client for writing instrumentation, and an ecosystem of instrumentation plugins for binding to common web frameworks, HTTP clients, and databases.
This vertical integration created a form of vendor lock-in. Users could not switch to a different observability tool — or even try one out, really — without first ripping and replacing their entire telemetry pipeline. This was incredibly frustrating for users who want to be able to try out new tools and switch providers whenever they like. At the same time, every vendor had to invest heavily in providing (and maintaining) instrumentation for a rapidly expanding list of popular software libraries, a duplication of effort that took valuable resources away from providing the other thing that users want — new features.
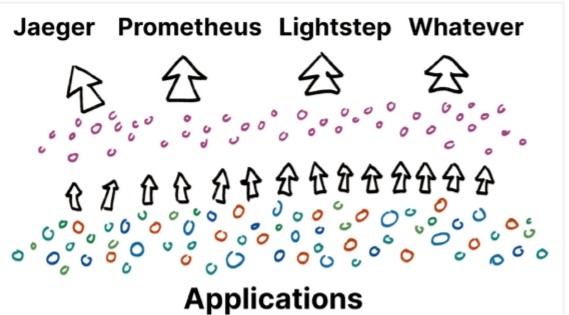
OpenTelemetry rearranged this landscape. Now, everyone is working together to create a high-quality telemetry pipeline, which they share. It is possible to share this telemetry pipeline because, generally, we can all agree upon a standard definition of an HTTP request, a database call, and a message queue. Subject matter experts can participate in the standardization process, along with providers and end users. Through this broad combination of different voices, we create a shared language that meets everyone’s needs.
At the same time, the OpenTelemetry project has a clear scope and attempts to define any sort of standard analysis tool or back end. This is because there is no standard definition for "good analysis." Instead, analysis is a rapidly growing field with new promising techniques appearing every year.
OpenTelemetry makes it easier than ever to develop a novel analysis tool. Now, you only have to write the back end. Just build a tool that can analyze OTLP, and the rest of the system is already built. At the same time, it is easier than ever for users to try these new tools. With just a small configuration change to your collector, you can begin teeing off your production data to any new analysis system that you would like to try.
Native Instrumentation for Open-Source Software
Modern applications heavily leverage open-source software, and much of the telemetry we want comes from the shared libraries our systems are built out of. But for the authors of these open-source libraries, producing telemetry has always been onerous. Any instrumentation chosen was designed to work with a specific observability tool. And since the users of their libraries all use different observability tools, there was no right answer.
This is unfortunate because library authors should be the ones maintaining this instrumentation — they know better than anyone what information is important to report and how that information should be used. Instrumenting a library should be no different from instrumenting application code.
Instrumentation hooks, auto-instrumentation, monkey patching — all the things we do to add third-party instrumentation to libraries are bizarre and complicated. If we can provide library authors with a well-defined standard for describing common operations, plus the ability to add any additional information specific to their library, they can begin to think of observability as a practice much like testing: a way to communicate correctness to their users.
If library authors get to write their own instrumentation, it becomes much easier to also write playbooks that describe how to best make use of the data to tune and operate the workload that library is managing. Library author participation in this manner would be a huge step forward in our practice of operating and observing systems.
Library authors also need to be wary about taking on dependencies that may risk creating conflicts. The OpenTelemetry instrumentation API never breaks backwards compatibility and will never include other libraries, such as gRPC, which may potentially cause a dependency conflict. This commitment makes OpenTelemetry a safe choice to embed in OSS libraries, databases, and complex, long-lived applications.
Integrated Logging, Metrics, and Tracing for Automated Analysis
The biggest and most profound shift for operators will come in the form of the new, advanced analysis tools and integrated workflows that can be built from OpenTelemetry data. While the standardization and dedication to stability allow OpenTelemetry to go where no telemetry system has gone before, it is the unified structure of OpenTelemetry’s data that makes it truly different from other systems.

A side effect of the vertically integrated "Three Pillars" approach was that every data source was siloed; the traces, logs, and metrics had no knowledge of each other. This has had a significant impact on how time-consuming and difficult it is to observe our systems in production, but it is an impact that is difficult to realize given how prevalent it is. Much like how auto-formatting makes us realize how much time we were spending hitting the tab key and hunting for missing semicolons, integrated data makes us realize how much time we were spending doing that same integration by hand.
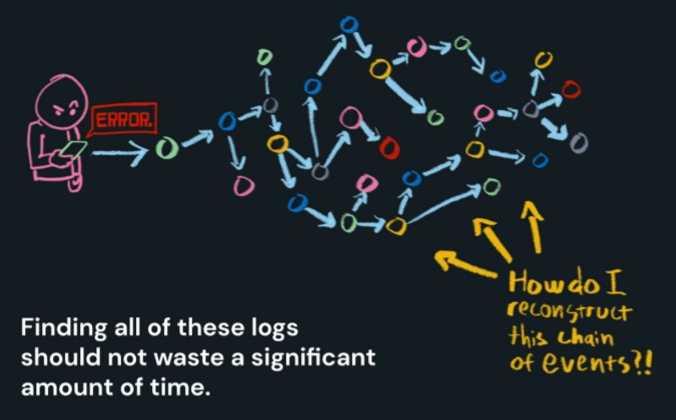
For example, one of our most common observational activities is looking at logs. When something goes wrong with a user request, we want to look at all of the logs related to that request from the browser, the front-end application, back-end applications, and any other services that may have been involved. But gathering these logs can be tedious and time-consuming. The more servers you have, the harder it is to find the logs for any particular request. And finding the logs when they stretch across multiple servers can require some trickery.
However, there’s a simple solution to this problem. If you are running a tracing system, then you have a trace ID available to index all of your logs. This makes finding all of the logs in a transaction quick and efficient — index your logs by trace ID, and now a single lookup finds them all!
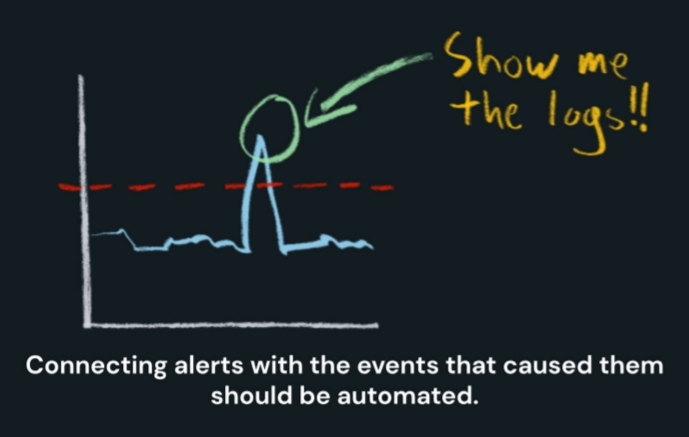
But it isn’t just tracing and logs that save time when they are integrated. As mentioned before, when describing OTLP, metrics are associated with traces via exemplars. Looking up logs is often the next step after looking at dashboards. But again, when our data is siloed, we have no way to automate this; instead, we have to guess and hunt around by hand until we find logs that are possibly relevant. But if our logs and metrics are directly connected by trace exemplars, looking at logs relevant to a dashboard or an alert is just a single click.
These time savings are compounded further when you consider what it is we are often looking for — correlations. For example, extreme latency may be highly correlated with traffic to a particular Kafka node — perhaps that node was misconfigured. A huge, overwhelming spike in traffic may be highly correlated with a single user. That situation requires a different response to a traffic spike caused by the sudden rush of new users.
Sometimes, it can get really nuanced. Imagine that an extremely problematic error only occurs when two services — at two particular versions — process a request with a negative value in a query parameter. Worse, if the error doesn’t actually occur when those two services talk, it occurs later when a third service encounters a null in the data and the second service is handed back. Long, sleepless nights spin themselves from hunting down the source of these types of problems.
This is probably the biggest takeaway from this article: Machine learning systems are great at finding these correlations, provided they are fed high-quality, structured data. Using OpenTelemetry’s highly integrated stream of telemetry, quickly identifying correlations becomes very feasible, even when those correlations are subtle or distantly related.
Significant time savings through automated analysis — this is the value that OpenTelemetry will ultimately unlock.
When Will OpenTelemetry Become Mainstream?
The current trend in observability products has been to expand beyond focusing on a single data type to becoming "observability platforms," which process multiple data sources. At the same time, many of these products have begun to either accept OTLP data or announce the retirement of their current clients and agents in favor of OpenTelemetry.
Continuing this trend into the future paints a fairly clear picture. In the first two quarters of 2022, all of the remaining OpenTelemetry core components are expected to be declared stable, making OTLP an attractive target for these products. By the end of next year, features that leverage this new integrated data structure will begin appearing in many observability products. At the same time, a number of databases and hosted services will begin offering OTLP data, leveraging OpenTelemetry to extend transaction-level observability beyond the clients embedded in their users’ applications, deep into their storage systems and execution layers.
Access to these advanced capabilities will begin to motivate mainstream application developers to switch to OpenTelemetry. At this point, OpenTelemetry and modern observability practices will begin to cross the chasm from early adoption to best practice. This, in turn, will further motivate the development of features based on OTLP, and motivate more databases and managed services to integrate with OpenTelemetry.
This is an exciting shift in the world of observability, and I look forward to the advancement of time-saving analysis tools. In 2022, keep your eye on OpenTelemetry, and consider migrating as soon as it reaches a level of stability you are comfortable with. This will position your organization to take advantage of these new opportunities as they unfold.
This is an article from DZone's 2021 Application Performance Management Trend Report.
For more:
Read the Report
Opinions expressed by DZone contributors are their own.

Comments