Open Dashboard and Visualization Workshop: Basic Perses Dashboard
This article explores creating your first basic Perses dashboard, as well as an open dashboard and visualization workshop.
Join the DZone community and get the full member experience.
Join For FreeBack in December of 2022, I started a series taking you on a tour of the Perses project. These articles covered this fairly new open dashboard and visualization project targeting cloud-native environments. I used a getting started workshop to guide you through this series and to provide a hands-on experience for those new to visualizing observability data.
In a previous article, I took you through the Perses specification and provided links to the actual online workshop content.
In this article, you'll start using the Perses UI and visualizing data in your first-ever dashboard.
Let's start off slowly, shall we?
In this lab, you're going to slowly start by modifying an existing panel in the provided dashboard project and then add a new panel as you start to get hands-on with this project.
You can find the free workshop here online:
Now, let's get creative with creating your first Perses dashboard. Note: this article is only a short summary, so please see the complete lab found online as lab 5 here to work through creating your first dashboard yourself:
The following is a short overview of what is in this specific lab of the Perses workshop.
A basic Dashboard
This lab will leverage the pre-installed WorkshopProject dashboard called MyFirstDashboard and walk you through several modifications of the first-row title, updating an existing panel of the type statChart, and then you'll create your first new panel of the type statChart. The initial dashboard you start with looks like this:
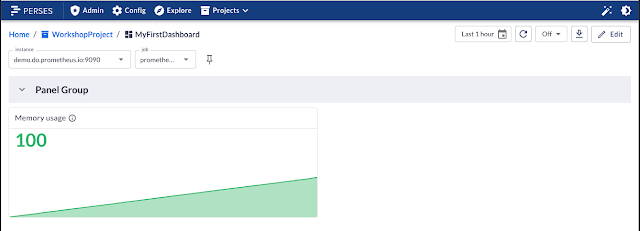
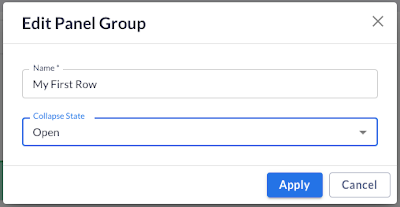
You notice if you look closely that the row naming is still the default Panel Group, so you will change that using the edit functions provided and rename it to My First Row. The UI offers pop-up editing features as shown here, which is a big step forward since the last time created this lab:
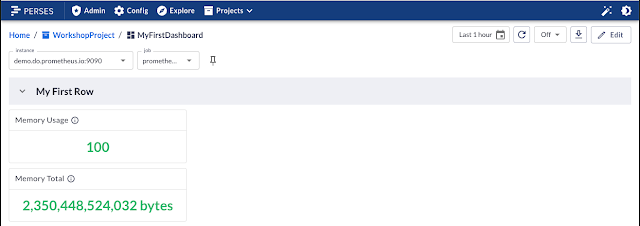
In another portion of this lab, you're going to edit the existing Memory usage panel and rename, resize, and modify the displayed elements in the panel itself. All of this is again possible inside the UI, so when you are done in the pop-up editors, you'll have a dashboard that looks like this:

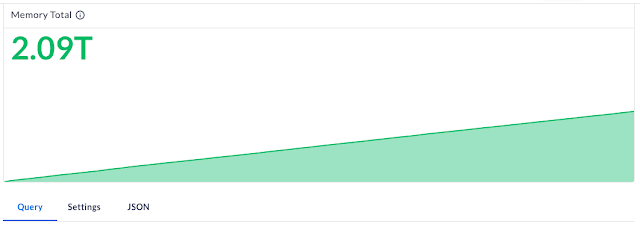
The last thing you'll do in this lab is to add a new panel, where you define it as a Stat Chart, configure its settings, and add the PromQL query to collect data for displaying. When you are all done you'll have a brand new panel titled Memory Total. Here's what the UI pop-up editor looks like for creating the PromQL query for this panel:

As you add the query, the editor has the nice feature of immediately showing the results in real-time for the query in the editor:
Finally, you will explore how you can move panels around the first row and resize them to your liking. Once you are all finished with that, your dashboard should look something like this:
There are a few other things you explore in this lab that are not touched on here, but this lab leaves you one step closer to creating a fully functional dashboard with Perses.
More to Come
Next up, I'll continue working with you through the Perses project and expanding on the first dashboard to target a more advanced end result. Stay tuned for more insights into real, practical experience as my cloud native o11y journey continues.
Published at DZone with permission of Eric D. Schabell, DZone MVB. See the original article here.
Opinions expressed by DZone contributors are their own.

Comments