MQTT + Apache Kafka + InfluxDB + SQL = IoT Harmony
This is a deep dive into real-time and time series IoT data using MQTT, Apache Kafka, InfluxDB, Lenses, and a handful of SQL code.
Join the DZone community and get the full member experience.
Join For Free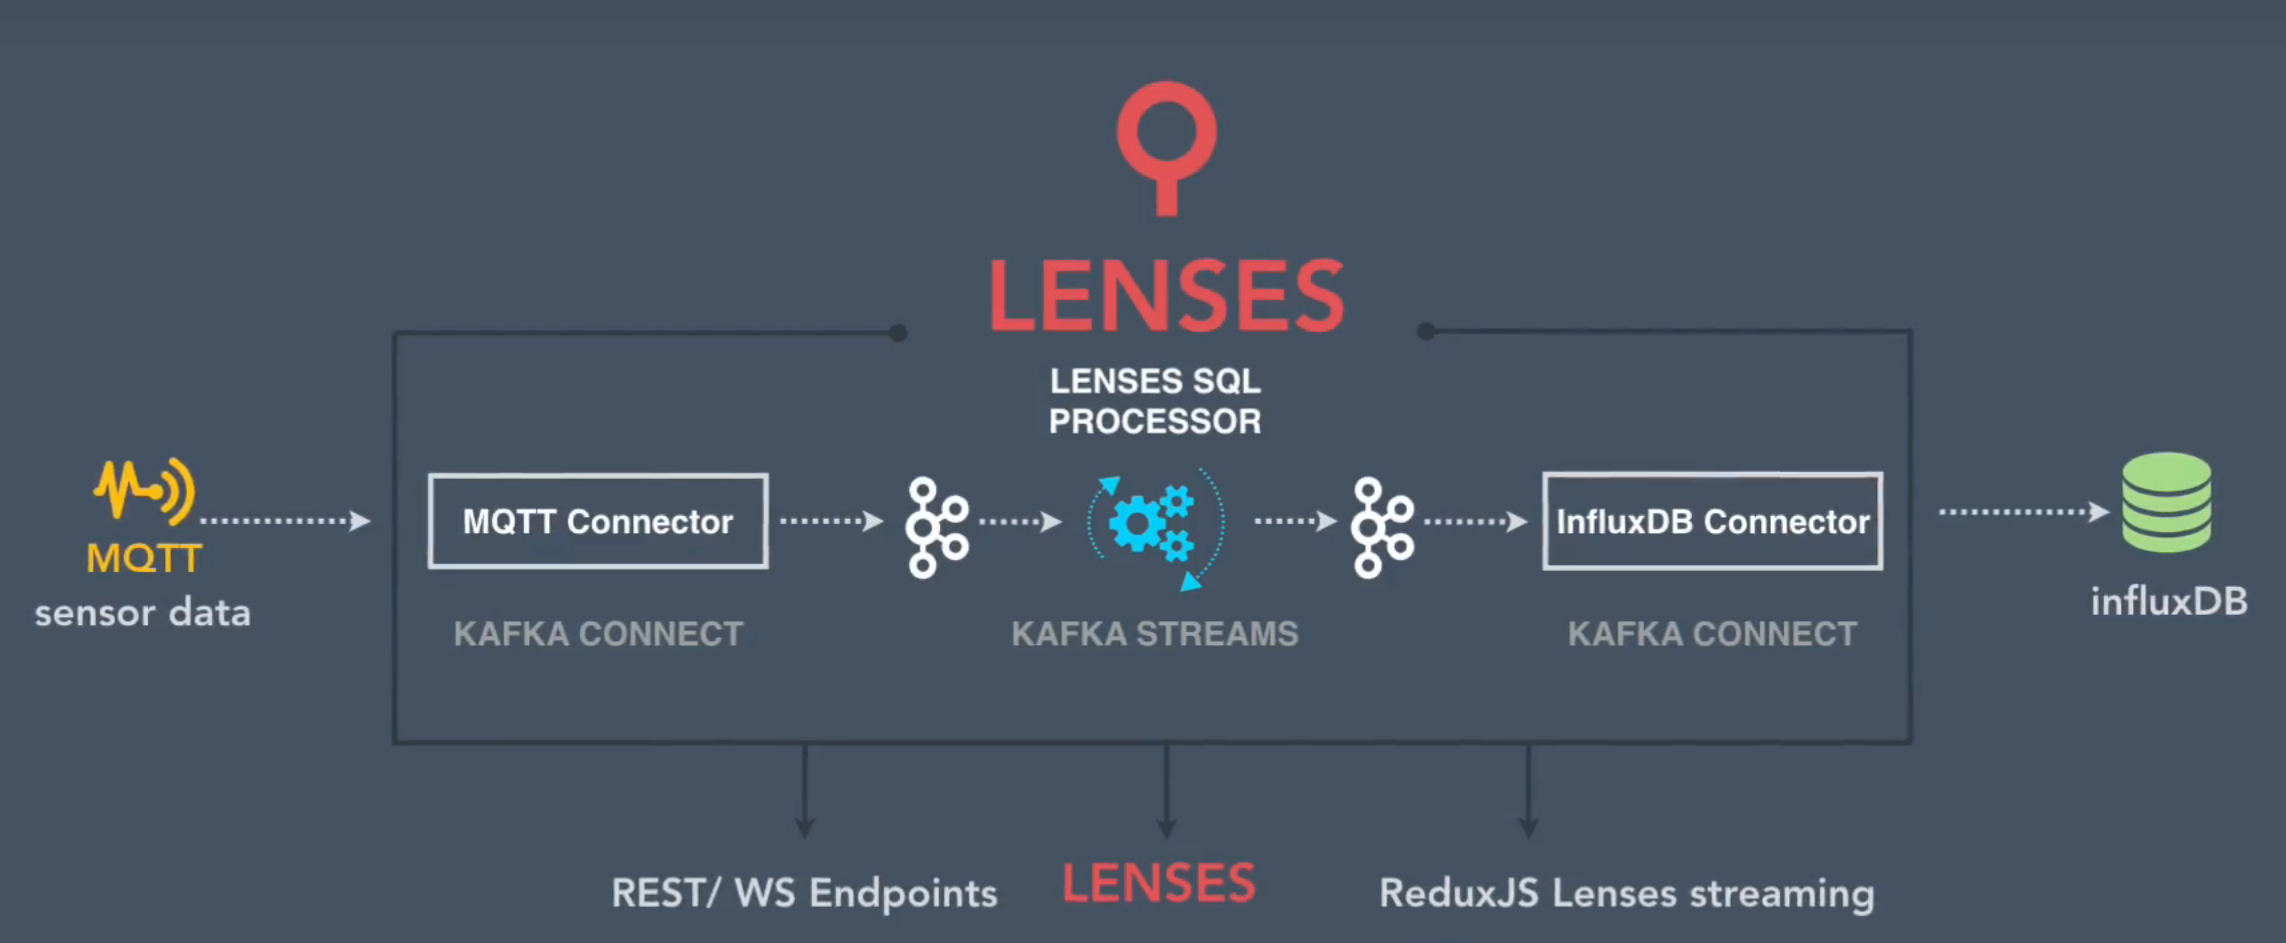
The rapidly growing number of interconnected devices confirms the Internet of Things is a quickly maturing technology. The digital economy has its own currency — and that is data. Similar to standard currencies, data is valuable if you can use it. IoT is a driver for being data-rich. However, having data is not quite enough; you need to be able to analyze data and take appropriate action.
In this entry, you will see how using Apache Kafka and Lenses can help you boost your productivity by providing you the tools to build end-to-end data pipelines with just a few lines of SQL code.
To top that, how does seeing your entire Apache Kafka-native data pipelines in one interactive graph sound?
Imagine a vast network of sensors pushing various measures via the MQTT protocol to a Mosquitto cluster. Using the entire Apache Kafka ecosystem, the data is first imported into topics via Kafka Connect, then Kafka Streams comes into play to analyze the stream(s) of data, and the results are then pushed into an instance of InfluxDB via Kafka Connect.
Let’s put together one data flow to see how quick and easy it is to build a solution for monitoring temperature and humidity levels. Furthermore, using the redux-lenses-streaming JavaScript library for bridging Kafka via SQL, you will see how you can build richer web applications by hooking into live Kafka data.
If you prefer watching a video to reading an article, you can do so:
Lenses
Lenses is the core element bringing everything together in a unified platform, allowing you to built and monitor your data pipelines. You can get the free Developer version from http://www.landoop.com/downloads/.
Lenses is a data streaming platform built on top of Apache Kafka, allowing you to stream, analyze, and react to your data faster without having to be a Kafka-savvy person.
Leveraging the platform’s Kafka Connect management capabilities, Kafka Connectors, and its powerful 3-tier SQL engine for Apache Kafka, you can build a streaming ETL in minutes.
LSQL (or Lenses SQL) is a powerful SQL engine for Apache Kafka covering both batch and streaming capabilities. What that means is simple: You can write Kafka Streams applications with LSQL, or you can browse Kafka topic data at ease.
At a very high level, here’s the rundown of the major components that fall under the LSQL engine umbrella:
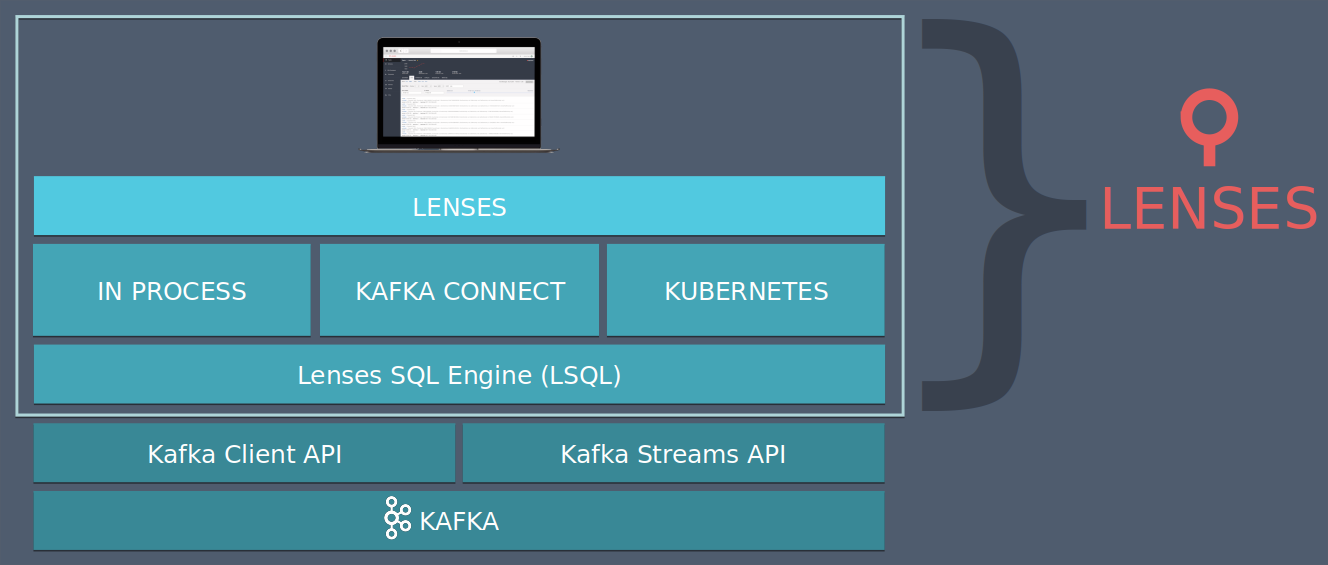
LSQL has made writing Kafka Streams applications or browsing Kafka topics a lot easier.
Before going any further, make sure you have your Lenses instance ready. In case you don’t have it already, you can follow this link to get your developer edition. Please note you need Docker available on your machine. When you register for the free Developer Edition, you get an email from us with the details of how to run it. The command is similar to this:
docker run -e ADV_HOST=127.0.0.1 -e \
   LICENSE_URL="https://milou.landoop.com/download/lensesdl/?id={YOUR_OWN_KEY}" \
   --rm -p 3030:3030 -p 9092:9092 -p 2181:2181 -p 8081:8081 \
   -p 9581:9581 -p 9582:9582 -p 9584:9584 -p 9585:9585 \
   landoop/kafka-lenses-dev
For our data pipeline, we need to use the latest MQTT source connector, which handles JSON payloads as well as setting the Kafka message key to the value of our sensor id. The current MQTT source deployed with the free edition contains an older version of the connector that doesn’t allow setting the Kafka message key. The next release will have this covered. Meanwhile, to get the latest code please follow these steps:
- Download the MQTT connector JAR from our Stream Reactor GitHub repository.
- Store the JAR in a known location (we are going to use it when we start the Docker process), for example
~/work/mqtt-connector/
You need to start the Docker image with the distributed MQTT connector disabled and using the latest JAR. Here is the command to do so:
docker run -e --net=host \
   -e LICENSE_URL="https://milou.landoop.com/download/lensesdl/?id={YOUR_OWN_KEY}" \
   --rm -p 3030:3030 -p 9092:9092 -p 2181:2181 -p 8081:8081 \
   -p 9581:9581 -p 9582:9582 -p 9584:9584 -p 9585:9585 \
   -e DISABLE=mqtt \
   -v  ~/work/mqtt-connector:/connectors/mqtt-connector \
   landoop/kafka-lenses-dev
You might have noticed the two extra parameters added to the command received in the initial email:
-e DISABLE=mqttdisables the already-packaged MQTT connector.-v ~/work/mqtt-connector:/connectors/mqtt-connectormounts your local folder and makes the latest code available to the Docker instance.
Run the command. The Docker image delivers the Kafka environment required for local development: 1 Kafka Broker, 1 Kafka Connect Worker, 1 Zookeeper Node, Schema Registry, and Lenses. You don’t have to install or configure anything else to start coding against Apache Kafka. It takes around 45 seconds or so for the environment to be available. Make sure you allocate at least 4GB of RAM for your Docker process. Open your favorite browser and navigate to http://localhost:3030 to access the web user interface.
MQTT Cluster and the Sensor Input Data
The first requirement for our data pipeline is having sensor data. To mimic a real network of sensors sending data over MQTT, a data generator application is provided. To avoid setting up the MQTT Mosquitto cluster, the application embeds a lightweight MQTT-compliant broker by leveraging the Moquette library.
Below, you can find the shape of data a sensor sends over. By the way, the programming language used for the generator code is Kotlin.
data class Sensor(
val id:String,          // the sensor unique identifier
val temperature:Double, // the temperature in Celsius
val humidity:Double,    // the humidity level
val timestamp:Long)     // The time in ms since Jan 1, 1970 UTC
The code is quite easy to follow, even if you haven’t used Kotlin before. First, the MQTT broker is started on the given port. For simplicity, it allows anonymous connections:
val mqttBroker = Server()
val properties = Properties()
properties.put(BrokerConstants.PORT_PROPERTY_NAME, port)
properties.put(BrokerConstants.ALLOW_ANONYMOUS_PROPERTY_NAME, "true")

mqttBroker.startServer(properties)
Then, in a while loop, the code generates and sends data as if there were four IoT sensors. For the purpose of this demo, we are keeping the number of sensors number, since it will make it easier to follow the data:
fun publishSensorData(topic: String, payload: ByteArray): Unit {
  val fixedHeader = MqttFixedHeader(
                       MqttMessageType.PUBLISH,
                       false,
                       MqttQoS.AT_MOST_ONCE,
                       false,
                       0)
  val varHeader = MqttPublishVariableHeader(topic, 0)
  val msg = MqttPublishMessage(
                fixedHeader,
                varHeader,
                Unpooled.copiedBuffer(payload))
  mqttBroker.internalPublish(msg, "client1")
}

fun rand(from: Int, to: Int): Int {
  return random.nextInt(to - from) + from
}

fun generateSensorData(sensorId: String, prev: Sensor): Sensor {
  return Sensor(sensorId,
      prev.temperature + random.nextDouble() * 2 + rand(0, 2),
      prev.humidity + random.nextDouble() * 2 * (if (rand(0, 9) % 2 == 0) -1 else 1),
      System.currentTimeMillis())
}

val dataMap = sensorIds.map { it ->
  val sensor = Sensor(it, 23.0, 38.0, System.currentTimeMillis())
  it to sensor
}.toMap()

try {
  while (true) {
      sensorIds.forEach { sensorId ->
      val data = generateSensorData(
                    sensorId,
                    dataMap.get(sensorId)!!)
      val json = JacksonJson.toJson(data)
      publishSensorData(topic, json.toByteArray())
    }
    Thread.sleep(500)
  }
} catch (e: Exception) {
}
You can find the code on GitHub. To save you some time building it, the application artifact is provided here. Once you have extracted the archive (ZIP or TAR) to your machine, navigate to the folder and run the following command:
./bin/mqtt-sensor-data 1883 /sensor_dataThere are two parameters provided. The former is the port number to bind the MQTT broker to, and the latter is the topic name to send the data to. Running the application should result in similar content printed on your console:
Received message on /sensor_data with payload : {...}
Received message on /sensor_data with payload : {...}
Received message on /sensor_data with payload : {...}
There is data to work with now.
Import the Data From the MQTT Cluster Into Kafka
Apache Kafka comes with the Connect framework, which allows moving data in and out of Kafka reliably and at scale. We will use Landoop’s MQTT source connector to ingest the sensor data into Kafka. You can find more about the connector by reading the documentation here.
The connector subscribes to the MQTT topic and writes the data it receives to a Kafka topic. Its behavior is driven by an intuitive SQL-like configuration we call KCQL (Kafka Connect Query Language). It is part of the LSQL engine.
This greatly reduces the complexity of managing the configuration while, at the same time, allowing us to quickly understand the work the connector is doing.
Let’s create the MQTT source connector instance and see the data flowing through to the target Kafka topic. Make sure are logged into the Lenses Web UI and navigate to the Connectors page (you will find the link on the left-hand side menu). Once loaded, the page looks like this:

To add a new connector, click on the `+New Connector` button (at the top right of the page). From the new screen presented to you, select the MQTT entry from the `Sources` list. Once that is done, you will be taken to a different page prompting you to provide the connector configuration. Take the settings below and paste them into the configuration editor, then click the `Create Connector` button.
name=Mqtt-Sensor-Source
connector.class=com.datamountaineer.streamreactor.connect.mqtt.source.MqttSourceConnector
tasks.max=1
connect.mqtt.kcql=INSERT INTO sensor_data SELECT * FROM /sensor_data
  WITHCONVERTER=`com.datamountaineer.streamreactor.connect.converters.source.JsonSimpleConverter`
  WITHKEY(id)
connect.mqtt.connection.clean=true
connect.mqtt.connection.timeout=1000
connect.mqtt.connection.keep.alive=1000
connect.mqtt.client.id=lenses_mqtt_sensor
connect.mqtt.converter.throw.on.error=true
connect.mqtt.hosts=tcp://127.0.0.1:1883
connect.mqtt.service.quality=1

key.converter=org.apache.kafka.connect.json.JsonConverter
key.converter.schemas.enable=false
value.converter=org.apache.kafka.connect.json.JsonConverter
value.converter.schemas.enable=false
Before continuing, let’s pause a moment to understand what the configuration is describing. The connect.mqtt.hosts=tcp://127.0.0.1:1883 configuration entry specifies the MQTT connection details. If you have used a different port to start the data generator, rather than 1883, the above configuration needs to be updated.
The KCQL syntax (see below) instructs the connector to read from the MQTT topic /sensor_data and push the entire payload to the Kafka topic sensor_data. The resulting Kafka message will have its key part set to the incoming payload field id — the sensor-unique identifier. Translating the MQTT message to a Kafka message is handled by the JsonSimpleConverter class. It takes the JSON MQTT payload and translates it to a Connect Struct, which is handed over to the Connect framework to push to Kafka.
INSERT INTO sensor_data
SELECT * FROM /sensor_data
WITHCONVERTER=`com.datamountaineer.streamreactor.connect.converters.source.JsonSimpleConverter`
WITHKEY(id)
We are now ready to create the connector. Click on the `Create connector` button and wait for the Connect framework to do its work and spin up the MQTT source task. Once it is running (it should take a few seconds for the task to be allocated — we use only 1 in this case), you can navigate to
http://localhost:3030/#/topics/sensor_data to see the data as it arrives in Kafka.
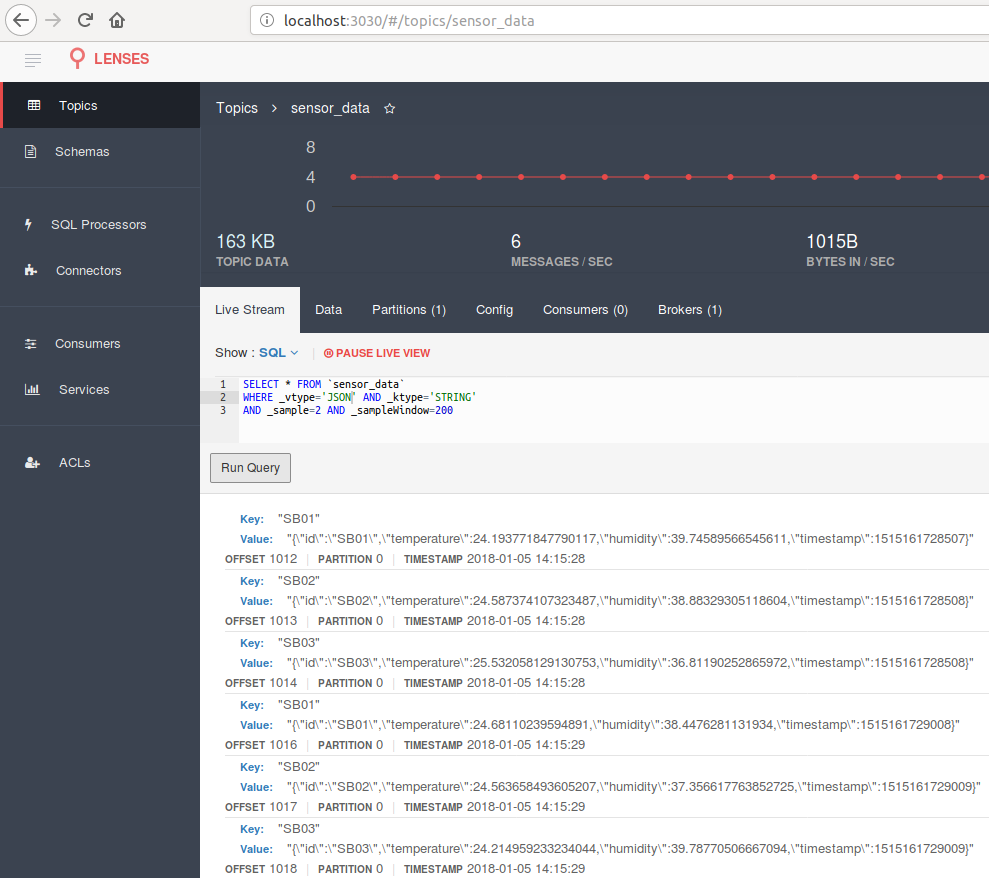
The data pipeline is quickly taking shape. Next, we want to analyze the data and calculate average temperature and humidity values while retaining the min/max over a given window of time.
Kafka Streams App With LSQL
To analyze the data stream, we need a Kafka Streams application. Using LSQL, we can quickly define and run such an application in minutes. Apart from allowing SQL to describe your application, the Lenses platform also takes care of running and scaling the resulting Kafka Streams applications.
For the Developer Edition, the KStream app runs in the same process as the platform main process. The Enterprise version offers two additional modes for execution and scaling: Connect and Kubernetes. You can find out more from the documentation, or you can see it in action here.
Running, monitoring, and scaling the Kafka Streams apps defined via LSQL is provided out of the box.
To create the application processing the data stream, navigate to the `Processors` page. SQL processor is the platform terminology to describe a Kafka Stream applications written with LSQL. Press the `New Processor` button to create the application. Grab the code below and paste it into the editor while naming the processor `IoT`:
SET `auto.offset.reset`='latest';
SET autocreate = true;
SET `commit.interval.ms` = 3000;

INSERT INTO sensor_data_avg
WITH
avgStream as
(
  SELECT STREAM
         count(*) as total,
         sum(temperature) as temperatureTotal,
         sum(humidity) as humidityTotal,
         min(temperature) minTemperature,
         max(temperature) maxTemperature,
         min(humidity) minHumidity,
         max(humidity) maxHumidity,
         _key as sensorId
  FROM  `sensor_data`
  WHERE _ktype=STRING and _vtype=JSON
  GROUP BY tumble(2,s),_key
)

SELECT STREAM
    sensorId,
    temperatureTotal/total as avgTemperature,
    humidityTotal/total as avgHumidity,
    minTemperature,
    maxTemperature,
    minHumidity,
    maxHumidity
FROM avgStream
You don’t have to be an Apache Kafka expert or a JVM developer to write a stream processing application.
Let’s go over the code. The SQL-like syntax will end up being translated to a Kafka Streams application that calculates the average, min, and max values for temperature and humidity. The calculations are done over a time window of 2 seconds. This means that every 2 seconds, there will be a result for each sensor who sent data.
Before the INSERT statement there are three SET ones:
autocreate=true;instructs the SQL engine to create the target topic if it does not exist already.auto.offset.reset= `latest`means the application will process the data from latest messages onward.commit.interval.ms =3000;sets the frequency with which to save the task's position (offsets in the source topics)
You might ask yourself: Why two SELECT statements? The simple answer is: calculating `average`. We are working on supporting an avg function. Once that will be available, the above code will be even easier to write.
The first SELECT statement builds a KStream instance, which calculates ...
- the total number of messages received over the 2s interval
- the sum of all the values for humidity and temperature
- the min/max values for humidity and temperature
... for each sensor (see the key being referenced in GROUP BY …, _key) it receives data for. Utilizing the data generated by this first statement, the second SELECT statement can calculate the average temperature/humidity by computing temperatureTotal/total as avgTemperature.
By clicking now on the `Create Processor` button, you should end up with with the web page looking similar to this:
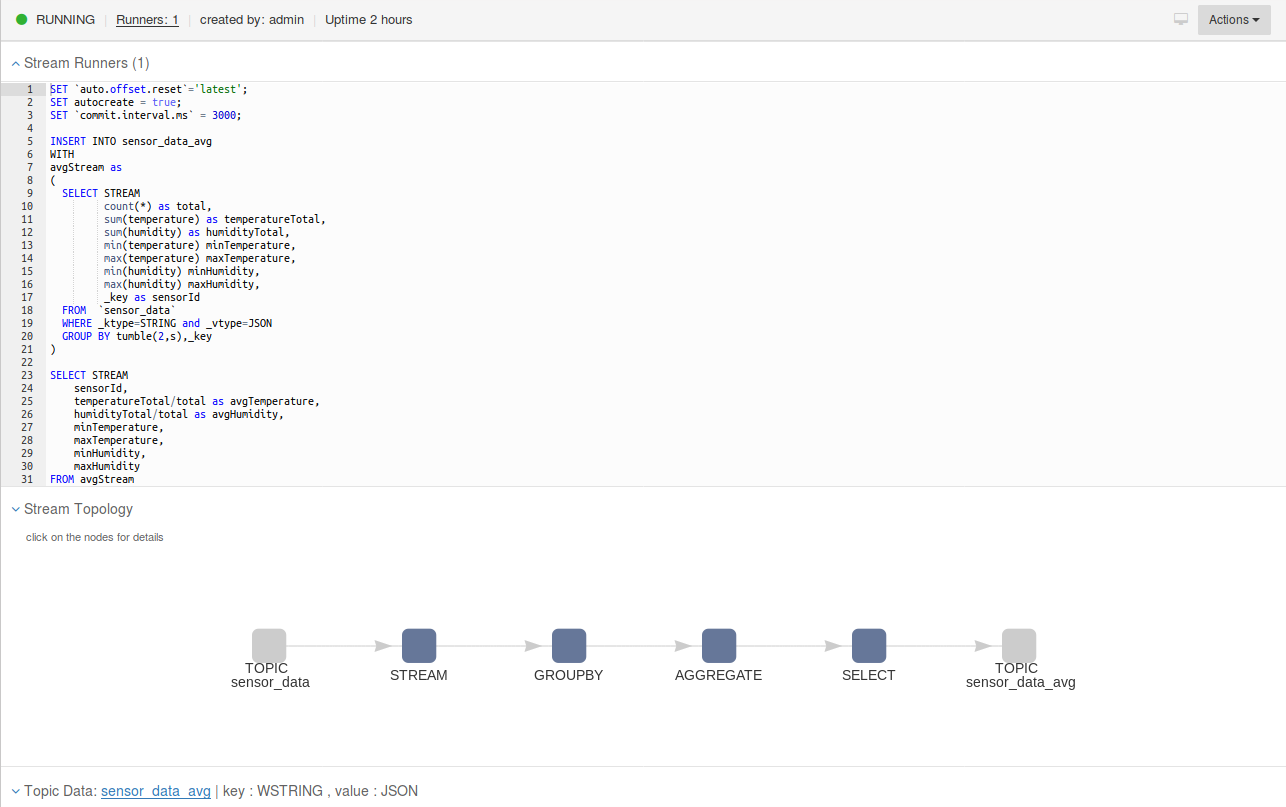
The stream topology graph is provided for each SQL processor.
Now that the processor is up and running, you should see data already pushed to the target topic. The UI will display the data arriving at the target topic in real time. Furthermore, a user can interact with each node in the graph.
Simple, quick, and easy.
To complete the data pipeline, a Kafka Connect InfluxDB sink will persist the stream analysis results.
InfluxDB for Your IoT Time Series Data
InfluxDB is an open source time series database able to handle high write and query loads. Written in Go, it can handle large amounts of data such as application metrics, IoT sensor data, and real-time analytics. Landoop provides the most advanced Kafka Connect Sink for it — all open source. You can find more about the sink capabilities in the documentation.
Before setting the sink, you need to have an instance of InfluxDB running. The best and fastest way to do so is to use the existing Docker image for it. Run this command to provision your instance:
sudo docker run -p 8086:8086 \
      -v influxdb:/tmp/influxdb \
      influxdb:1.3.0
Once the Docker image is running, you need to create the database to insert the data into. Run the following command to create a database named IoT:
curl -XPOST "http://localhost:8086/query" --data-urlencode "q=CREATE DATABASE iot"To provision the sink, you need to navigate to the UI Connectors page as you did for the source. This time, when adding a new connector, select InfluxDB from the Sinks list. When the UI prompts for the connector configuration, paste the information below:
name=iot-influxdb-sink
tasks.max=1
connector.class=com.datamountaineer.streamreactor.connect.influx.InfluxSinkConnector

connect.influx.url=http://localhost:8086
connect.influx.db=iot

topics=sensor_data_avg
connect.influx.kcql=INSERT INTO sensorMeasure
   SELECT * FROM sensor_data_avg
   WITHTAG (id, poweredBy=Lenses)
connect.influx.username=""

key.converter=org.apache.kafka.connect.json.JsonConverter
key.converter.schemas.enable=false
value.converter=org.apache.kafka.connect.json.JsonConverter
value.converter.schemas.enable=false
Using the configuration above, the sink knows to connect to the local InfluxDB instance and insert the data into the iot database. The connect.influx.kcql configuration entry specifies, via a simple INSERT statement, the target InfluxDB measurement and the source Kafka topic to read the data from. The WITHTAG keyword will trigger the sink to provide two labels for each inserted data point. The first one, id, contains the sensor unique identifier; the second one, poweredBy, is a constant. Since KCQL hasn’t specified the timestamp field (InfluxDB requires a timestamp set for each data point) the point will get the time at insertion expressed in nanoseconds.
Click the `Create Connector` button to see the connector instance provisioned and the computed averages written to InfluxDB. Kafka Connect will allocate the task and the connector will start pushing data to the time-series store.
To query the data from InfluxDB run the following command:
curl -XPOST "http://localhost:8086/query?pretty=true" \
   --data-urlencode "db=iot" --data-urlencode "q=SELECT * FROM sensorMeasure"
And you should see content similar to the one below being printed on your console:
{
    "results": [
        {
            "statement_id": 0,
            "series": [
                {
                    "name": "sensorMeasure",
                    "columns": [
                        "time",
                        "avgHumidity",
                        "avgTemperature",
                        "maxHumidity",
                        "maxTemperature",
                        "minHumidity",
                        "minTemperature",
                        "poweredBy",
                        "sensorId"
                    ],
                    "values": [
                        [
                            "2018-01-05T16:24:47.715Z",
                            36.910297678496086,
                            25.008838646379814,
                            38.26483448074582,
                            25.83512146042607,
                            36.128449761591284,
                            24.193354778778644,
                            "Lenses",
                            "\"SB01\""
                        ],....
Voila! Our data pipeline is now running. You had the patience and curiosity to get this far, but there are two more points to touch upon, and they are quite important.
Let Your Web App Tap Into Live Kafka Data
Having data flowing through the database is great, but what if you want to tap into the data as it is computed and present it in your web application?
That could lead to a richer user experience, and your users will greatly appreciate live dashboards/charts.
The platform comes with a JavaScript library to do just that. Soon to be open sourced, it allows you to connect to Kafka and get live data into your browser by leveraging Redux and LSQL.
A sample application is provided to showcase the things you can achieve. You can find the code on [GitHub]. Once you have downloaded it locally, run:
npm install
npm run start-dev
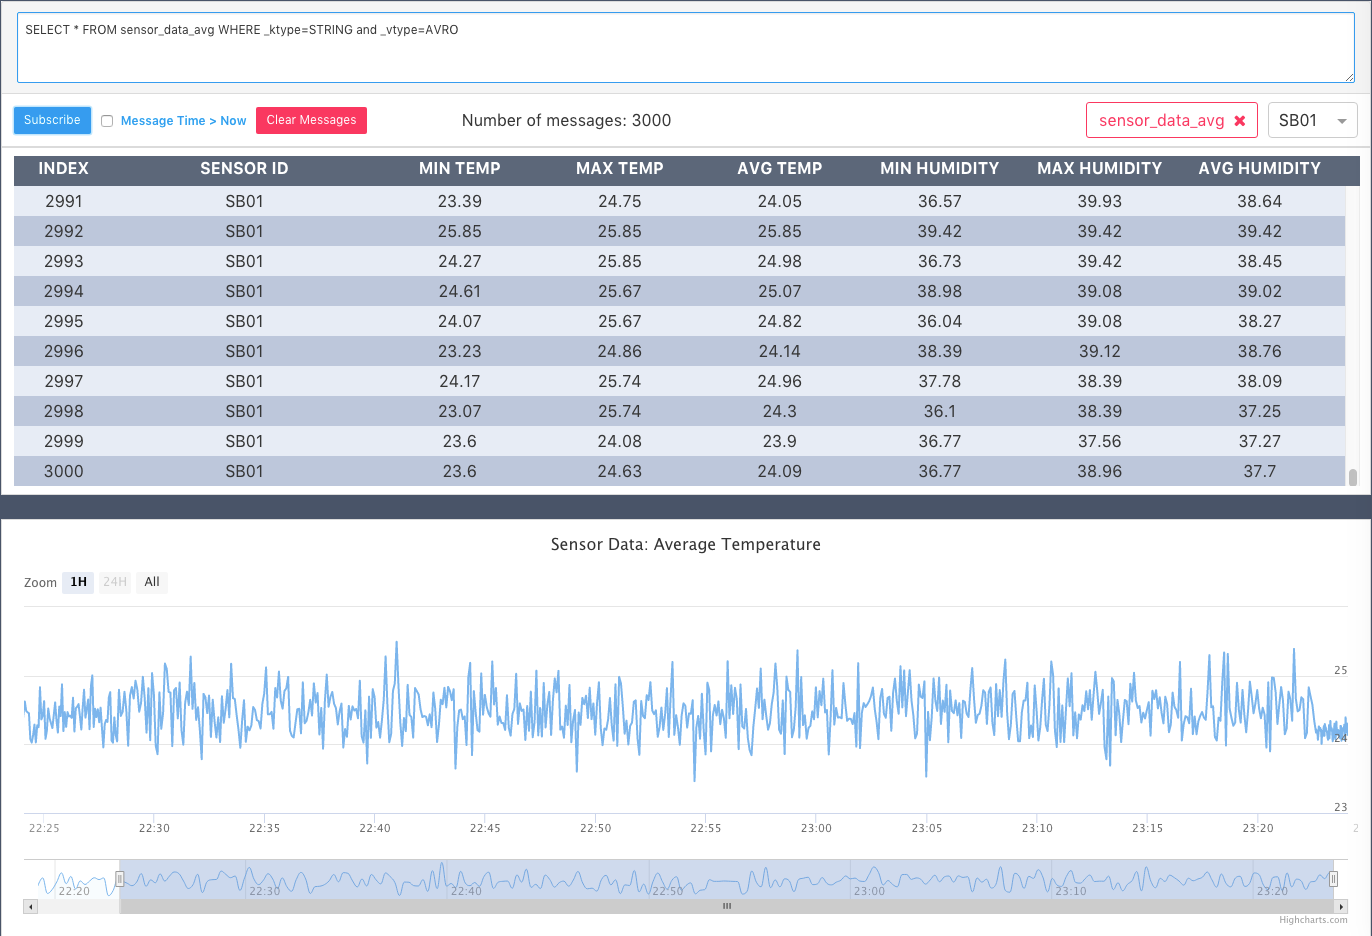
And then navigate to http://localhost:8000/lenses/. Use this connection string: wss://localhost:3030/api/kafka/ws and the admin/admin credentials to open a connection. Authentication is required by default when accessing the REST API the platform exposes. You can find more about the library and the endpoints in the documentation. Type the following LSQL statement in the query editor:
SELECT * FROM sensor_data_avg WHERE _ktype=STRING and _vtype=JSONShortly after, you should see live aggregated data being rendered on the chart:
The Cherry on the Cake
There is something left for the end of this entry.
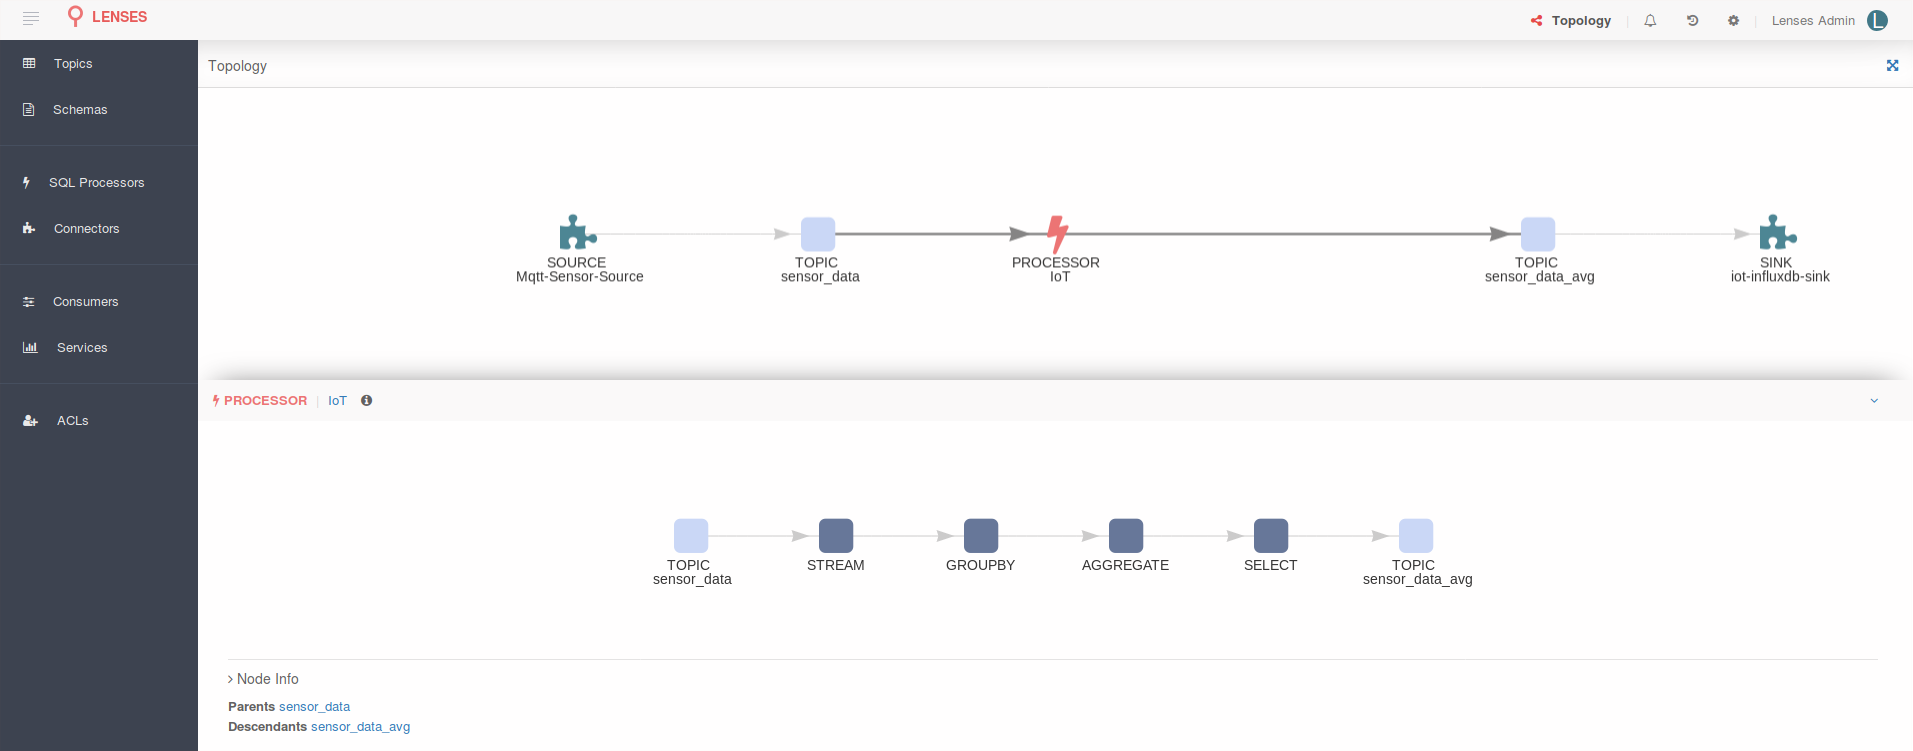
What if you were told you can see the entire topology in a nice graph: the Connect source pushing data into a Kafka topic and a SQL processor (Kafka Streams App) doing the analysis and storing the data back to another topic from which a Connect sink sends it to InfluxDB.
Navigate to http://localhost:3030/#topology and be amazed:

Pretty cool, if you ask me. The more connectors or SQL processors you add, the more complex the graph will become. You can visualize your entire data flow in one interactive graph!
You can interact with each node in the graph to get more details. As you can see in the image above, the SQL processor has been selected and you get to see its processing flow.
Conclusion
We have seen how the Apache Kafka ecosystem is evolving and how you get more and better tools to easily and quickly set up a data pipeline.
With a few lines of code (LSQL and configuration), one can easily deliver an ETL solution for moving data in and out of Apache Kafka, and the topology view gives you the entire picture of your data flows.
You can deliver your streaming solutions, in this scenario for IoT, a lot faster and a lot easier.
Focus on your business requirements, and use the best tools for the job.
Stream. Analyze. React.
Published at DZone with permission of Stefan Bocutiu. See the original article here.
Opinions expressed by DZone contributors are their own.

Comments