Monitoring Changes in Permissions, Users, Roles, and Logins
Let's take an in-depth look at monitoring changes in permissions, users, roles, and logins. Also explore SQL Monitor.
Join the DZone community and get the full member experience.
Join For FreeCompliance means keeping a close grip on any changes to the permissions and access control of a database. Sadly, the law has had to acknowledge, from bitter experience, that it is not just external intruders who want to do this, but it could also be attempts at fraud or data theft from within the organization. Permission changes are certainly one of the things that security experts advise you look out for; you need the equivalent of CCTV trained on your servers.
If you have default trace running, then you should already have an impressive audit, with a record of what changes to permission, users, logins or roles were made, when and by whom.
After the Alert
The most important requirement is to get an alert at the point these changes start happening. We'll set that up shortly in SQL Monitor, using a custom metric that queries the default trace.
When you receive an alert, you can then examine the details of the access and permission changes at your leisure, so you can understand more about the attack. Fortunately, the default trace can go back weeks, depending on the workload, and on the extent of telemetry and monitoring that you have running.
There is a lot of data in the trace, and it is easy to get a bit overwhelmed with it, so we're aiming to distill it into a simple report of when the change was made, who changed what, and details of the affected security objects. Figure 1 shows the result of our forthcoming labors. I generated the report after creating and deleting a few logins, roles and users.
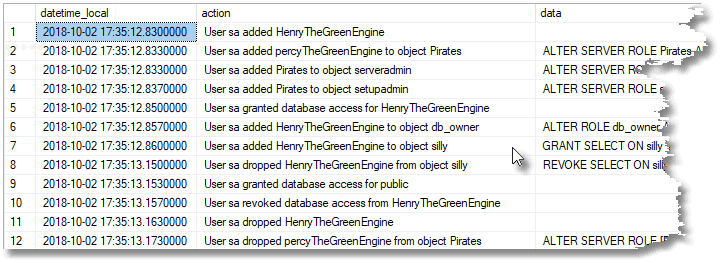 Figure 1
The action column that you see is just something I've added to assist the viewer; it's a summary of useful data from other relevant columns.
Collecting the Data
In previous articles on monitoring SQL Server for database drift, configuration changes, and "suspicious" errors, I've mined the data I need from Extended Events. Here, I've resorted to using the default trace.
Microsoft says:
"This feature (the default trace) is in maintenance mode and may be removed in a future version of Microsoft SQL Server. Avoid using this feature in new development work, and plan to modify applications that currently use this feature. Use Extended Events instead."
Unfortunately, I can find no equivalent way, using Extended Events, of detecting changes in permissions that covers all the range of SQL Server versions in production use. You will get a lot more data from SQL Audit if you have it, but the reason that I like using the default trace is that its presence in SQL Server goes back in the mists of time, and so you are likely to be able to use it. It is still there and smiling in SQL Server 2017, and begging to be used. As a bonus, towards the end of the article, I'll even show you how to use the default trace to detect unauthorized changes to database objects (tables, view procedures and so on), as we achieved with Extended Events previously, but now shown alongside permission changes. You can see both types event in one single 'narrative', or time-based, sequence.
Listing 1 shows how to create the SeeAccessControlChanges function that will collect all the data we need from the default trace. I've reduced the data to be scanned to just the period you select, and I've just chosen to collect only the records that involve a login, user or role. This filtering is almost disarmingly simple, since each of these provide a value in the TargetLoginName column, whereas for everything else it is NULL.
The only downside is that it takes a half-second or more to get the information because you are basically reading it from a file. However, in my experience, Extended Event ring buffers are generally slower to read.
IF Object_Id('dbo.SeeAccessControlChanges') IS NOT NULL
     DROP function dbo.SeeAccessControlChanges
  GO
  CREATE FUNCTION dbo.SeeAccessControlChanges
  /**
  Summary: >
    This function gives you a list
    of security events concerning users, roles and logins
    from the default trace
  Author: Phil Factor
  Date: 04/10/2018
  Examples:
     - Select * from dbo.SeeAccessControlChanges(DateAdd(day,-1,SysDateTime()),SysDateTime())
  columns: datetime_local, action, data, hostname, ApplicationName, LoginName, traceName, spid, EventClass, objectName, rolename, TargetLoginName, category_id, ObjectType
  Returns: >
        datetime_local datetime2(7)
        action nvarchar(816)
        data ntext
        hostname nvarchar(256)
        ApplicationName nvarchar(256)
        LoginName nvarchar(256)
        traceName nvarchar(128)
        spid int
        EventClass int
        objectName nvarchar(256)
        rolename nvarchar(256)
        TargetLoginName nvarchar(256)
        category_id smallint
        ObjectType nvarchar(128)
          **/
    (
    @Start DATETIME2,--the start of the period
    @finish DATETIME2--the end of the period
    )
  RETURNS TABLE
   --WITH ENCRYPTION|SCHEMABINDING, ..
  AS
  RETURN
    (
    SELECT
        Convert(--correct the date for local time.
          DATETIME2,
          SwitchOffset(StartTime, DateName(TzOffset, SysDateTimeOffset()))
               ) AS datetime_local, 'User '+Coalesce( LoginName+ ' ','unknown ')+
        CASE EventSubclass --interpret the subclass for these traces
          WHEN 1 THEN 'added ' WHEN 2 THEN 'dropped ' WHEN 3 THEN 'granted database access for '
          WHEN 4 THEN 'revoked database access from ' ELSE 'did something to ' END+ Coalesce(TargetLoginName,'')
        + Coalesce( CASE EventSubclass WHEN 1 THEN ' to object ' ELSE ' from object ' end+objectname, '') AS action,
        Coalesce(TextData,'') AS [data], hostname, ApplicationName, LoginName, TE.name AS traceName, spid,
        EventClass, objectName, rolename, TargetLoginName, TE.category_id,
      SysTSV.subclass_name AS ObjectType
       FROM::fn_trace_gettable(--just use the latest trace
           (SELECT TOP 1 traces.path FROM sys.traces
              WHERE traces.is_default = 1), DEFAULT) AS DT
        LEFT OUTER JOIN sys.trace_events AS TE
          ON DT.EventClass = TE.trace_event_id
        LEFT OUTER JOIN sys.trace_subclass_values AS SysTSV
          ON DT.EventClass = SysTSV.trace_event_id
         AND DT.ObjectType = SysTSV.subclass_value
      WHERE StartTime BETWEEN @start AND @finish
      AND TargetLoginName IS NOT NULL
    )
  GO
Listing 1
Now, when we want to drill into the details of any changes made, we can simply use Listing 2, to execute the function, and it produces a report like the one in Figure 1.
SELECT ADayBack.datetime_local, ADayBack.action, ADayBack.data,
    ADayBack.traceName, ADayBack.category_id, ADayBack.ObjectType
    FROM dbo.SeeAccessControlChanges
        (DateAdd(DAY, -1, SysDateTime()), SysDateTime()
        ) AS ADayBack
          ORDER BY datetime_local;
Listing 2
In this example, I've just selected all changes that happened in the past day, but you can search a long way back with the default trace, or just a few seconds if you need that.
This approach is, however, more like an audit, a way of assessing the damage. What you really want to know is what is happening right now, because you would rather nip an attack or uncontrolled change in the bud, before the perpetrator has got to the data. You want a baseline from which you can judge that activity is unusual. What you need is a monitoring tool.
Creating the Custom Metric in SQL Monitor
We next set up a custom trace for SQL Monitor that will alert us as soon as a change occurs. SQL Monitor wants a SQL batch that returns a single integer, and we will choose to return the number of changes to logins, users or roles that happened in a ten-minute interval. As scanning the default trace takes time, we don't want to be calling it too often. Once every five minutes seems about right to me.
SELECT
      Count(*)
     FROM::fn_trace_gettable(--just use the latest trace
         (SELECT TOP 1 traces.path FROM sys.traces
            WHERE traces.is_default = 1), DEFAULT) AS DT
      WHERE StartTime > DateAdd (MINUTE, -10,SysDateTime())
    AND TargetLoginName IS NOT NULL
Listing 3
If you get false positives, you can easily fine-tune the WHERE filter in the SQL Expression. You might, for example, get permission changes as part of a legitimate routine within a user database, a third-party tool or perhaps a scheduled task; and these must be filtered out once you are clear about the circumstances in which the event occurs.
If you don't have SQL Monitor, you can run this on a schedule in SQL Server Agent, and set it to alert you if there are any changes in the permission system involving either logins, roles or users.
The disadvantage of relying on SQL Agent is that, to comply with legislation such as SOX, the monitoring system should be outside the control of what you are monitoring. An attacker who gains sysadmin privileges can disable a SQL Agent job. Also, you want to be able to check the whole farm for any signs of intrusion or uncontrolled changes.
Figure 2 shows us adding a new custom metric to our SQL Monitor installation, which uses Listing 3 to collect the data.
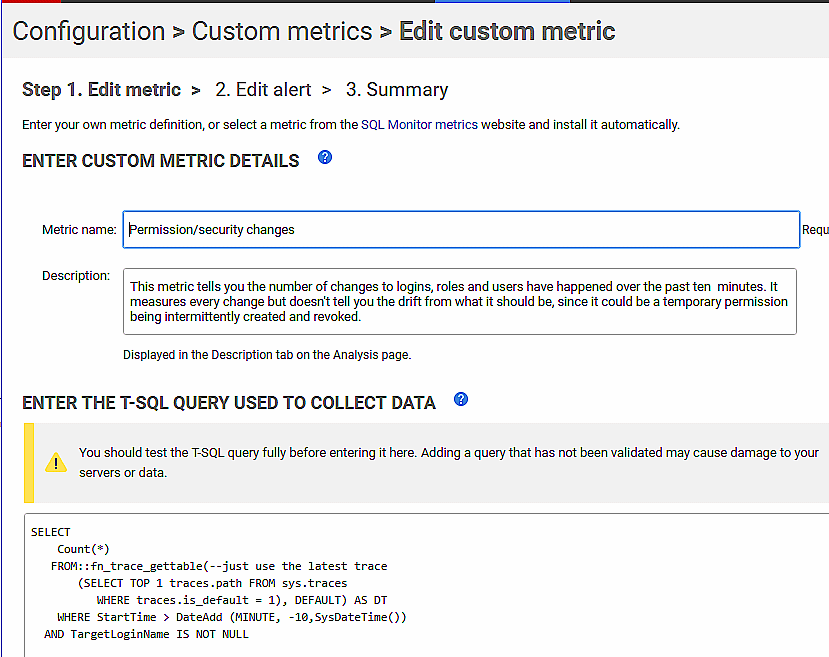 Figure 2
I'm collecting the data every 5 minutes, from the master database, on all my servers
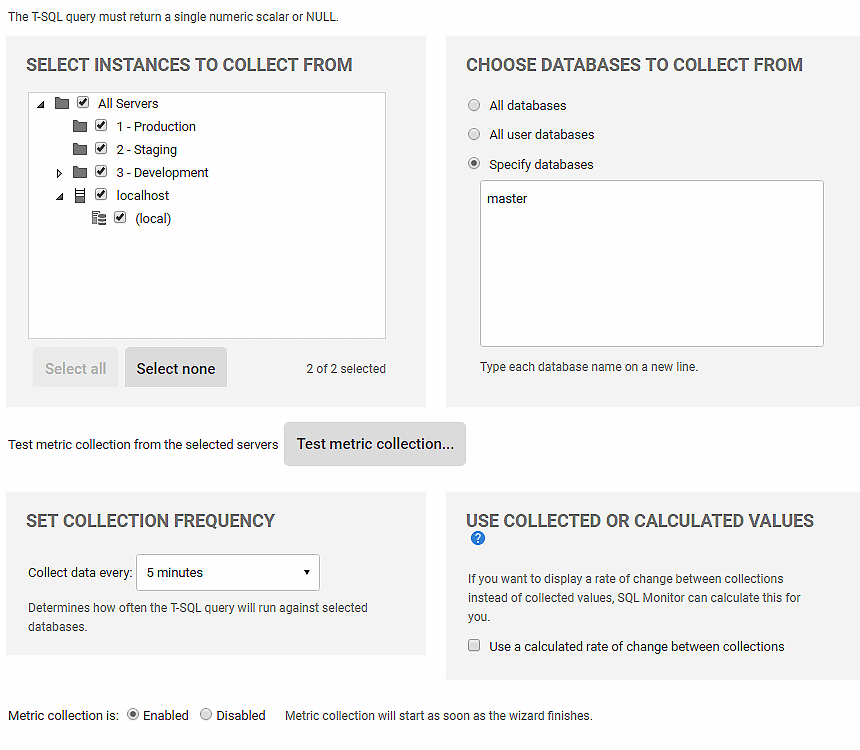 Figure 3
Finally, we add the alert.
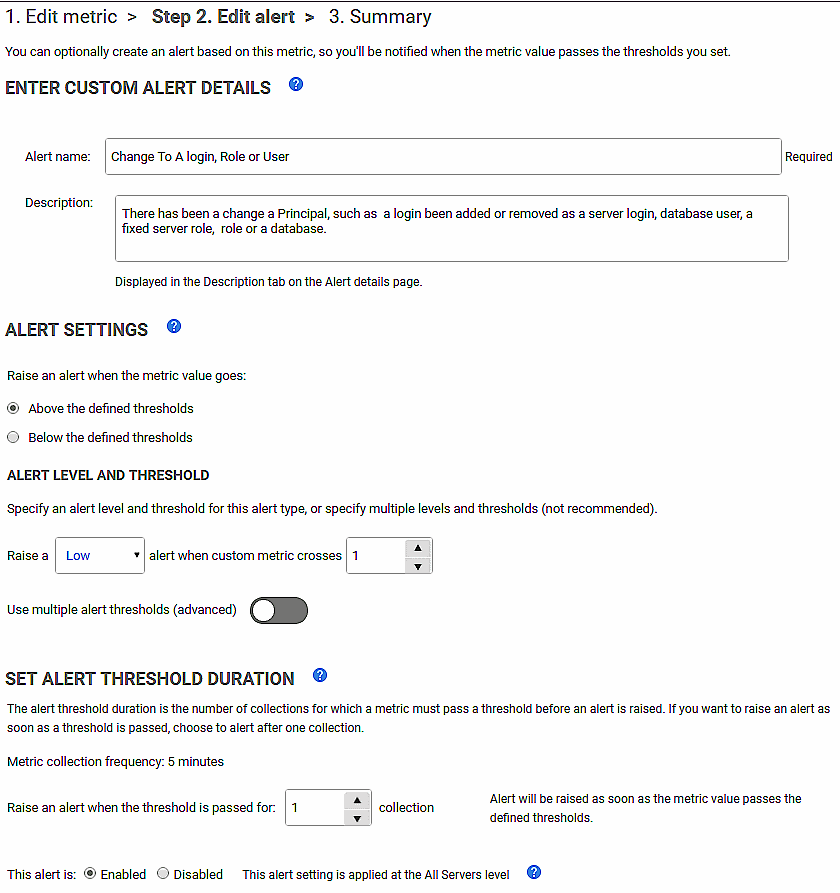 Figure 4
Detecting the Changes
We can now run various tests and see if some simple changes to logins, roles, and users are detected. First, we will make some simple changes. We'll add a random time interval between DCL commands to simulate real usage a bit closer, as if the commands are being keyed in.
USE master;
  --create a user
  CREATE LOGIN HenryTheGreenEngine WITH PASSWORD = 'ePaCqshha7m4iyhj';
  GO
  CREATE LOGIN PercyTheSmallEngine WITH PASSWORD = 'tRoUbl3som3Eng1n3s';
  GO
  Declare @delay varchar(8)= '00:00:'+Right('0'+convert(varchar(2),convert(int,rAnd()*60)),2);WAITFOR DELAY @delay;
  CREATE SERVER ROLE Pirates AUTHORIZATION sysadmin;
  GO
  Declare @delay varchar(8)= '00:00:'+Right('0'+convert(varchar(2),convert(int,rAnd()*60)),2);WAITFOR DELAY @delay;
  ALTER SERVER ROLE Pirates ADD MEMBER PercyTheSmallEngine;
  GO
  Declare @delay varchar(8)= '00:00:'+Right('0'+convert(varchar(2),convert(int,rAnd()*60)),2);WAITFOR DELAY @delay;
  ALTER SERVER ROLE serveradmin ADD MEMBER Pirates;
  GO
  Declare @delay varchar(8)= '00:00:'+Right('0'+convert(varchar(2),convert(int,rAnd()*60)),2);WAITFOR DELAY @delay;
  ALTER SERVER ROLE setupadmin ADD MEMBER Pirates;
  GO
  Declare @delay varchar(8)= '00:00:'+Right('0'+convert(varchar(2),convert(int,rAnd()*60)),2);WAITFOR DELAY @delay;
  GRANT ALTER ON LOGIN::[NT Service\MSSQLSERVER] TO Pirates;
  GO
  Declare @delay varchar(8)= '00:00:'+Right('0'+convert(varchar(2),convert(int,rAnd()*60)),2);WAITFOR DELAY @delay;
  GRANT CONTROL ON LOGIN::[NT Service\MSSQLSERVER] TO Pirates;
  GO
  Declare @delay varchar(8)= '00:00:'+Right('0'+convert(varchar(2),convert(int,rAnd()*60)),2);WAITFOR DELAY @delay;
  GRANT IMPERSONATE ON LOGIN::[NT Service\MSSQLSERVER] TO Pirates;
  GO
  Declare @delay varchar(8)= '00:00:'+Right('0'+convert(varchar(2),convert(int,rAnd()*60)),2);WAITFOR DELAY @delay;
  GRANT VIEW DEFINITION ON LOGIN::[NT Service\MSSQLSERVER] TO Pirates;
  GO
  Declare @delay varchar(8)= '00:00:'+Right('0'+convert(varchar(2),convert(int,rAnd()*60)),2);WAITFOR DELAY @delay;
  GRANT ALTER ON LOGIN::[NT SERVICE\SQLWriter] TO Pirates;
  GO
  Declare @delay varchar(8)= '00:00:'+Right('0'+convert(varchar(2),convert(int,rAnd()*60)),2);WAITFOR DELAY @delay;
  GRANT CONTROL ON LOGIN::[NT SERVICE\SQLWriter] TO Pirates;
  GO
  Declare @delay varchar(8)= '00:00:'+Right('0'+convert(varchar(2),convert(int,rAnd()*60)),2);WAITFOR DELAY @delay;
  GRANT IMPERSONATE ON LOGIN::[NT SERVICE\SQLWriter] TO Pirates;
  --
  USE AdventureWorks2016;
  GO
  Declare @delay varchar(8)= '00:00:'+Right('0'+convert(varchar(2),convert(int,rAnd()*60)),2);WAITFOR DELAY @delay;
  --greate user in adventureworks
  CREATE USER dodgy FOR LOGIN HenryTheGreenEngine WITH DEFAULT_SCHEMA = dbo;
  GO
  Declare @delay varchar(8)= '00:00:'+Right('0'+convert(varchar(2),convert(int,rAnd()*60)),2);WAITFOR DELAY @delay;
  ALTER ROLE db_owner ADD MEMBER dodgy;
  GO
  CREATE TABLE silly (TheKey INT IDENTITY);
  GO
  Declare @delay varchar(8)= '00:00:'+Right('0'+convert(varchar(2),convert(int,rAnd()*60)),2);WAITFOR DELAY @delay;
  GRANT SELECT ON silly TO dodgy WITH GRANT OPTION;
  GO
  Declare @delay varchar(8)= '00:00:'+Right('0'+convert(varchar(2),convert(int,rAnd()*60)),2);WAITFOR DELAY @delay;
  REVOKE SELECT ON silly FROM dodgy CASCADE;
  GO
  CREATE USER TankEngineThomas WITHOUT LOGIN WITH DEFAULT_SCHEMA = dbo;
  GO
  Declare @delay varchar(8)= '00:00:'+Right('0'+convert(varchar(2),convert(int,rAnd()*60)),2);WAITFOR DELAY @delay;
  ALTER ROLE db_owner ADD MEMBER TankEngineThomas;
  DROP USER TankEngineThomas;
  GO
  Declare @delay varchar(8)= '00:00:'+Right('0'+convert(varchar(2),convert(int,rAnd()*60)),2);WAITFOR DELAY @delay;
  DROP USER dodgy;
  DROP TABLE silly;
  DROP LOGIN HenryTheGreenEngine;
  DROP LOGIN PercyTheSmallEngine
  GO
  DECLARE @RoleName sysname;
  SET @RoleName = N'Pirates';
  IF @RoleName <> N'public'
    AND
      (
      SELECT server_principals.is_fixed_role
          FROM sys.server_principals
          WHERE server_principals.name = @RoleName
      ) = 0
    BEGIN
      DECLARE @RoleMemberName sysname;
      DECLARE Member_Cursor CURSOR FOR
      SELECT server_principals.name
        FROM sys.server_principals
        WHERE server_principals.principal_id IN
                (
                SELECT server_role_members.member_principal_id
                  FROM sys.server_role_members
                  WHERE server_role_members.role_principal_id IN
                          (
                          SELECT principal_id FROM sys.server_principals WHERE name = @RoleName
  AND type = 'R'
                          )
                );
      OPEN Member_Cursor;
      FETCH NEXT FROM Member_Cursor
      INTO @RoleMemberName;
      DECLARE @SQL NVARCHAR(4000);
      WHILE @@Fetch_Status = 0
        BEGIN
          SET @SQL =
            N'ALTER SERVER ROLE ' + QuoteName(@RoleName, '[') + N' DROP MEMBER '
            + QuoteName(@RoleMemberName, '[');
          EXEC (@SQL);
          FETCH NEXT FROM Member_Cursor
          INTO @RoleMemberName;
        END;
      CLOSE Member_Cursor;
      DEALLOCATE Member_Cursor;
    END;
  DROP SERVER ROLE Pirates;
  GO
Listing 4
In the Analysis section of SQL Monitor, I've created a tile that plots the values for our new Permission/Security changes metric, along with those for the three custom metrics that I've written about in previous articles (referenced above).
Having created the tile, run Listing 4 to make sure it detects these untoward database security changes.
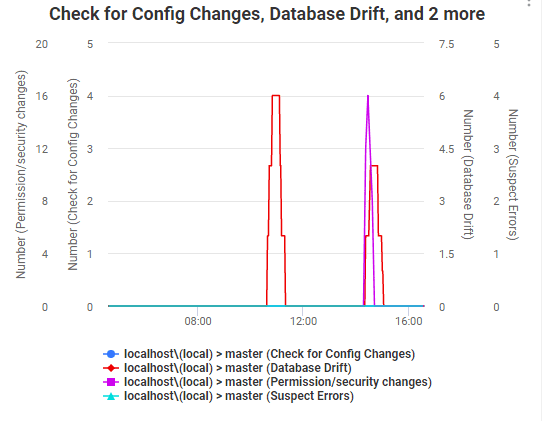 Figure 5
You should also find that an alert was fired when it happened.
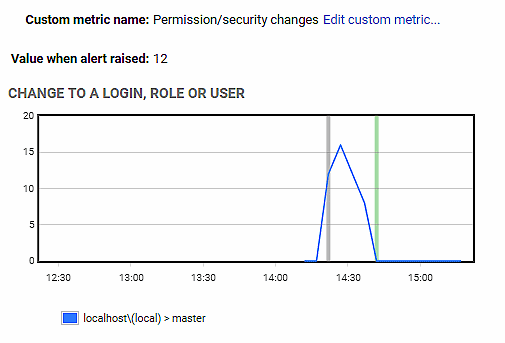 Figure 6
Now, of course, you should retrieve the detailed report that tells you who made what changes and when, as described earlier.
Using the Default Trace to Relate Database Drift to Permission Changes
Sometimes, you want to use the default trace to detect object changes alongside security changes. The following SeeDatabaseObjectChanges function collects this data from the default trace, similarly to the one we used earlier.
IF Object_Id('dbo.SeeDatabaseObjectChanges') IS NOT NULL
     DROP function dbo.SeeDatabaseObjectChanges
  GO
  CREATE FUNCTION dbo.SeeDatabaseObjectChanges
  /**
  Summary: >
    This function gives you a list
    of database object changes that happened between
    the two dates, taken from the default trace
  Author: Phil Factor
  Date: 04/10/2018
  Examples:
     - Select * from dbo.SeeDatabaseObjectChanges(DateAdd(day,-1,SysDateTime()),SysDateTime())
  Columns: datetime_local, action, databaseID, TransactionID, Hostname, ApplicationName, LoginName, spid, objectid
  Returns: >
        datetime_local datetime
        action nvarchar(4000)
        databaseID int
        TransactionID bigint
        Hostname nvarchar(256)
        ApplicationName nvarchar(256)
        LoginName nvarchar(256)
        spid int
        objectid int
          **/
    (
    @Start DATETIME2,--the start of the period
    @finish DATETIME2--the end of the period
    )
  RETURNS TABLE
   --WITH ENCRYPTION|SCHEMABINDING, ..
  AS
  RETURN
    (
      SELECT
        Convert(--correct the date for local time.
          DATETIME2,
          SwitchOffset(StartTime, DateName(TzOffset, SysDateTimeOffset()))
               ) AS datetime_local,
           'User '+Coalesce(SessionLoginName,loginName,'') +' '+ Replace(name, 'Object:','')
               +Coalesce(' '+objtype,'')+' '+ Coalesce(DatabaseName+'.'+ObjectName,databasename) AS action,
        databaseID, TransactionID, Hostname, ApplicationName, LoginName, spid,objectid
       FROM::fn_trace_gettable(--just use the latest trace
           (SELECT TOP 1 traces.path FROM sys.traces
              WHERE traces.is_default = 1), DEFAULT) AS DT
        LEFT OUTER JOIN sys.trace_events AS TE
          ON DT.EventClass = TE.trace_event_id
        LEFT OUTER JOIN sys.trace_subclass_values AS SysTSV
          ON DT.EventClass = SysTSV.trace_event_id
         AND DT.ObjectType = SysTSV.subclass_value
          LEFT OUTER JOIN
        (
     VALUES(8259, 'Check Constraint'),( 8260, 'Default (constraint or standalone)'),( 8262, 'Foreign-key Constraint'),( 8272, 'Stored Procedure'),
     ( 8274, 'Rule'),( 8275, 'System Table'),( 8276, 'Trigger on Server'),( 8277, 'User Table'),( 8278, 'View'),
     ( 8280, 'Extended Stored Procedure'),(16724, 'CLR Trigger'),(16964, 'Database'),(16975, 'Object'),(17222, 'FullText Catalog'),
     (17232, 'CLR Stored Procedure'),(17235, 'Schema'),(17475, 'Credential'),(17491, 'DDL Event'),(17741, 'Management Event'),
     (17747, 'Security Event'),(17749, 'User Event'),(17985, 'CLR Aggregate Function'),(17993, 'Inline Table-valued SQL Function'),
     (18000, 'Partition Function'),(18002, 'Replication Filter Procedure'),(18004, 'Table-valued SQL Function'),(18259, 'Server Role'),
     (18263, 'Microsoft Windows Group'),(19265, 'Asymmetric Key'),(19277, 'Master Key'),(19280, 'Primary Key'),(19283, 'ObfusKey'),
     (19521, 'Asymmetric Key Login'),(19523, 'Certificate Login'),(19538, 'Role'),(19539, 'SQL Login'),(19543, 'Windows Login'),
     (20034, 'Remote Service Binding'),(20036, 'Event Notification on Database'),(20037, 'Event Notification'),(20038, 'Scalar SQL Function'),
     (20047, 'Event Notification on Object'),(20051, 'Synonym'),(20549, 'End Point'),(20801, 'Adhoc Queries which may be cached'),
     (20816, 'Prepared Queries which may be cached'),(20819, 'Service Broker Service Queue'),(20821, 'Unique Constraint'),
     (21057, 'Application Role'),(21059, 'Certificate'),(21075, 'Server'),(21076, 'Transact-SQL Trigger'),(21313, 'Assembly'),
     (21318, 'CLR Scalar Function'),(21321, 'Inline scalar SQL Function'),(21328, 'Partition Scheme'),(21333, 'User'),
     (21571, 'Service Broker Service Contract'),(21572, 'Trigger on Database'),(21574, 'CLR Table-valued Function'),
     (21577, 'Internal Table (For example, XML Node Table, Queue Table.)'),(21581, 'Service Broker Message Type'),(21586, 'Service Broker Route'),
     (21587, 'Statistics'),(21825, 'User'),(21827, 'User'),(21831, 'User'),(21843, 'User'),(21847, 'User'),(22099, 'Service Broker Service'),
     (22601, 'Index'),(22604, 'Certificate Login'),(22611, 'XMLSCHEMA'),(22868,  'Type (e.g. Table Type)'))f(objectTypeid, ObjType)
     ON dt.objectType=objecttypeid
     WHERE StartTime BETWEEN @start AND @finish
      AND databasename NOT IN ('tempdb', 'MASTER')
        <a id="post-466565-_Hlk526435500"></a>AND EventSubClass=0
        AND category_id=5
    )
  GO
Listing 5
And this is how you might want to execute this.
SELECT datetime_local, [action], databaseID, TransactionID,
    Hostname, ApplicationName, LoginName, spid, objectid
    FROM dbo.SeeDatabaseObjectChanges(
  DateAdd(DAY, -1, SysDateTime()), SysDateTime()
  ) AS ADayBack
    ORDER BY ADayBack.datetime_local;
Listing 6
This shows us which logins changed which objects, in which databases. Depending on what you were doing on the server at the time, the reports looks something like this:
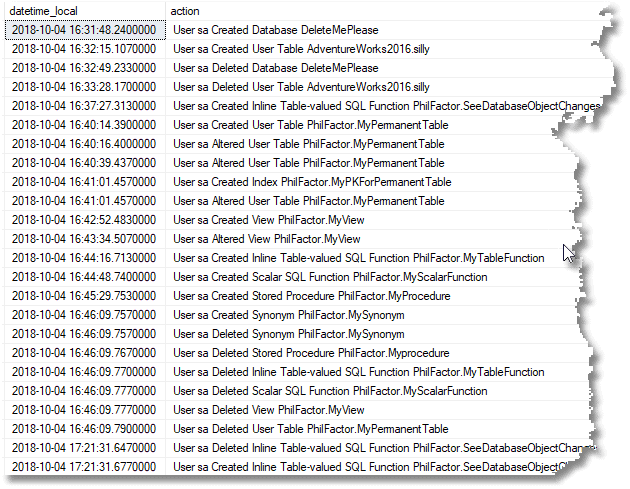 Figure 7
This is fine, but we can do even better now. We can mix information from this TVF and the previous one, SeeAccessControlChanges, to see both object changes and permission changes. This gives us the fuller story of what the intruder is doing.
Of course, in this case, the 'attack' makes no narrative sense, because I'm simply reusing existing test scripts! The narrative from the real intruder will make more sense.
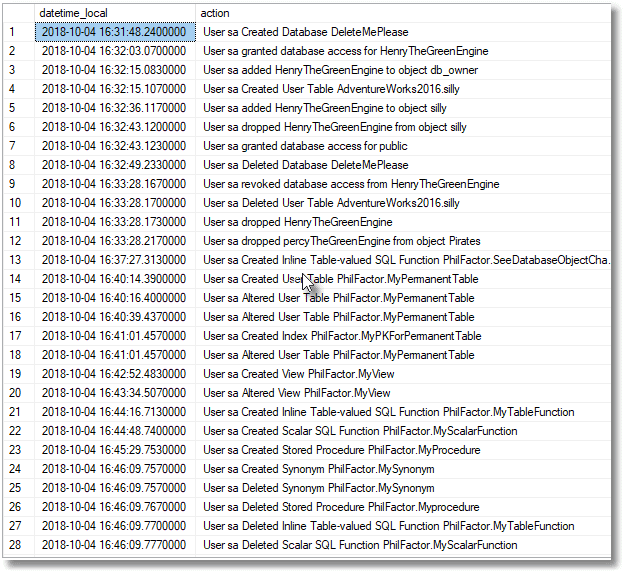 Figure 8
And this is the code that worked this magic.
/* test code for using both table functions together */

  SELECT datetime_local, [action]
    FROM dbo.SeeDatabaseObjectChanges(
  DateAdd(DAY, -1, SysDateTime()), SysDateTime()
  ) AS objectChanges
  UNION ALL
  SELECT datetime_local, [action]
    FROM dbo.SeeAccessControlChanges
        (DateAdd(DAY, -1, SysDateTime()), SysDateTime()
        ) AS PermissionChanges
  ORDER BY datetime_local ASC;
Listing 7
Conclusion
The combination of a good monitoring system and the default trace can tell you when something untoward is happening with a server and will provide a baseline of the activity you are monitoring. The default trace is antiquated, but that means that you can manage a whole estate of servers and use the same forensic tools on all of them. Be aware, though, that it is flagged for removal, to be replaced by equivalent functionality with Extended Events. I suspect I'll rewrite this article then!
The great thing about using the default trace is that your subsequent queries, once SQL Monitor has alerted you, are relatively easy. If your default trace is getting filled rapidly, you may need to search more than the current file. This will make it slower but requires only a slight alteration to the code.
If you haven't many servers to look after, you can simply use the query to determine how many permission changes had happened in the past ten minutes and fire a SQL Server alert when something is detected. However, you lose the baseline (zero, you'd hope in this case, but don't count on it!) and you cannot aggregate servers into groups.
Worse, you lose the advantage that SQL Monitor is a remote process that is hard for intruders to turn off, even if they manage to gain godlike powers for their SQL Server user, and even if they try, it fires an alert! I like it most for seeing those spikes in the tile graphs, and an at-a-glance view of the sort of activity that is going on. Graphs can make it easy to assimilate a variety of information and integrate it. They are, in other words, brain-friendly.
Published at DZone with permission of Phil Factor. See the original article here.
Opinions expressed by DZone contributors are their own.

Comments