Memory Tuning: What are the KPIs?
When you are tuning the application’s memory and Garbage Collection settings, there is an overwhelming amount of metrics reported. Which one should you choose and which one should you leave? This article intends to explain the right KPIs and right tools to source them.
Join the DZone community and get the full member experience.
Join For FreeWhen you are tuning the application’s memory and Garbage Collection settings, you should take well-informed decisions based on the key performance indicators. But there is an overwhelming amount of metrics reported. Which one should you choose and which one should you leave? This article intends to explain the right KPIs and right tools to source them.
What Are the Right KPIs?
- Throughput
- Latency
- Footprint
Throughput
Throughput is the amount of productive work done by your application in a given time period. This brings the question what is productive work? what is non-productive work?
Productive Work: This is basically the amount of time your application spends in processing your customer's transactions.
Non-Productive Work: This is basically the amount of time your application spend in house-keeping work, primarily Garbage collection.
Let’s say your application runs for 60 minutes. In this 60 minutes let’s say 2 minutes is spent on GC activities.
It means application has spent 3.33% on GC activities (i.e. 2 / 60 * 100)
It means application throughput is 96.67% (i.e. 100 – 3.33).
Now the question is: What is the acceptable throughput %? It depends on the application and business demands. Typically one should target for more than 95% throughput.
Latency
This is the amount of time taken by one single Garbage collection event to run. This indicator should be studied from 3 fronts.
- Average GC time: What is the average amount of time spent on GC?
- Maximum GC time: What is the maximum amount of time spent on a single GC event? Your application may have service level agreements such as “no transaction can run beyond 10 seconds”. In such cases, your maximum GC pause time can’t be running for 10 seconds. Because during GC pauses, entire JVM freezes – no customer transactions will be processed. So it’s important to understand the maximum GC pause time.
- GC Time Distribution: You should also understand how many GC events are completing within what time range (i.e. within 0 – 1 second, 200 GC events are completed, between 1 – 2 second 10 GC events are completed …)
Footprint
Footprint is basically the amount of CPU consumed. Based on your GC algorithm, based on your memory settings, CPU consumption will vary. Some GC algorithms will consume more CPU (like Parallel, CMS), whereas other algorithms such as Serial will consume less CPU.
According to memory tuning Gurus, you can pick only 2 of them at a time.
- If you want high throughput and low latency then footprint will increase.
- If you want high throughput and low footprint then latency will increase.
- If you want low latency and low footprint then throughput will degrade.
Right Tools
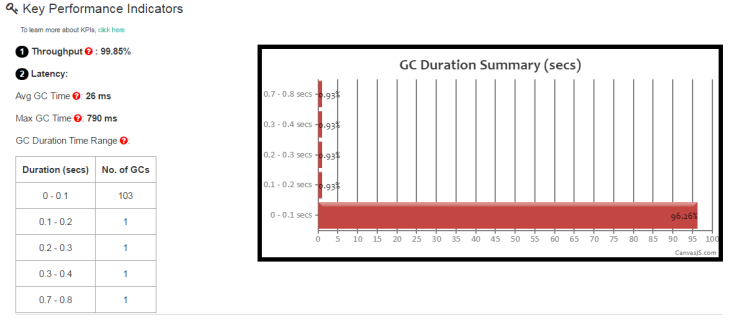
Throughput and Latency can be obtained from analyzing Garbage collection Logs. Upload your application’s Garbage Collection log file in http://gceasy.io/ tool. This tool can parse Garbage Collection logs and generates Throughput and Latency indicators for you. Below is the screen shot from the http://gceasy.io/ tool showing the throughput and latency:

Fig: KPI section from GCEasy.io report
Footprint (i.e. CPU consumption) can be obtained from the monitoring tools – Nagios, NewRelic, AppDynamics, …
Opinions expressed by DZone contributors are their own.

Comments