Performance Engineering Management: A Quick Guide
Processes, Techniques, Best practices, Teams, and Tool Sets.
Join the DZone community and get the full member experience.
Join For FreeIn every project performance testing, assessment, and resolution become the key phase before going to production. In this article, there will be a sneak preview of key concepts, lifecycle steps, tips, and further guidance.
I will try to cover the holistic view in this short writing including non-functional requirements with high-level details but the focus will be on the performance aspect mainly, beyond this a lot more detailed steps will be involved. Additionally, the focus will be on Java-based web applications mainly while some of the details are generic and applicable to other platforms and technologies.
Performance Engineering Lifecycle
This section describes the lifecycle phases. It is important to understand the end-to-end cycles. In SDLC, performance consideration starts at the initial solution phase. While working on RFP, it is important to understand what's the non-functional requirement. The high-level idea of the NFR will help to derive the strawmen architecture, platforms (initial list, may change), and integrations. Obviously, the NFR needs to be closed and discussed during the discovery phase, this may change the initial strawmen architecture or other ways it will be trued-up or fine-tuned. In the Design phase, the final architecture and high-level system designs need to be considered with required performance attributes and KPI, key design decisions, architectural patterns, choice of languages or platforms.
Performance engineering management is a step-wise and continuous process through SDLC, while early detection of performance issues or bottlenecks during build phase will be helpful but also it is important to understand the significance of premature optimization which is an anti-pattern in this case.
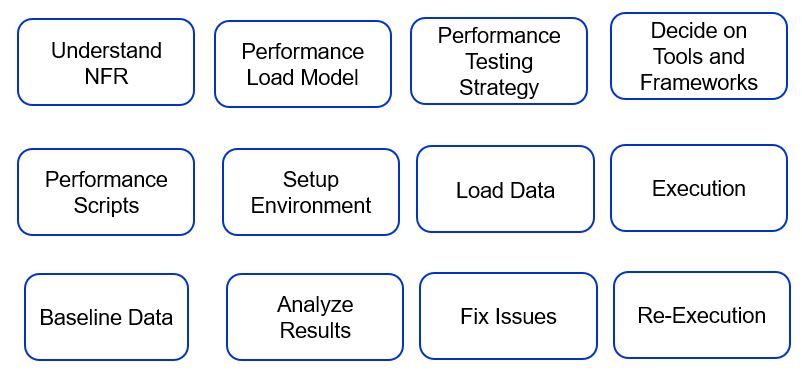
While the majority of these activities will happen in the "Performance Testing" cycle, some of the actions should be started early like "Understand NFR", "Key Design Considerations", "Early Performance Testing and Fixing", "Code profiling, memory analysis" for example. In most cases, the early performance testing can be single-user testing or simulated load with multiple people testing in parallel but not necessarily running load testing.
A high-level view of possible NFR is mentioned below.
| Key Parameter | Considerations |
| Performance | The application pages or APIs shall have response time for page load or response, for example, 3 secs of page load time or 3 secs of API response under agreed load and concurrency. Mostly the page load or app performance will depend on what end-user is using, which has little control on the platform. The web vitals should be considered for front-end performance. Ideally, the back-end performance through Time-to-first-byte aka TTFB or Time-to-last-byte aka TTLB should be considered for performance KPI in terms of response time. |
| Availability | The system availability: 99.95% or something like this |
| Scalability | The system must be scalable to handle the growths based on the number of stores, concurrent users, seasonal load, etc. First-year XXX users, transactions (orders, search, cart/checkout, conversion rate, etc.) vs. YYY in the next year or so. |
| Security | Security protocol, communications, standards, compliance will need to be mentioned, Scope of security testing to be discussed. Network and Infrastructure level security to be planned, clear responsibility needs to be there through RACI across stakeholders. Specifically banking, healthcare solutions need to follow additional security measures, advanced encryption, several compliance rules (GDPR, HIPPA, FIDO, PCI-DSS, PSD2, etc.), audits by respective organizations, and clearance for the platform or application. Also, PII, PHI, and personal data security will be catered to in this area. |
| Backup and Archival | Data, server backup, archival, cleanup, recovery, etc. needs to be defined; the processes and scope will differ based on cloud vs. on-prem solutions |
| Browser and Device Support | Browser and device support needs to be mentioned, some examples are stated below. Internet Explorer-9 and above, Chrome 49+, Firefox 44+, Safari 9.1.x. Android device – Native application or Chrome with the latest version (For responsive site); Any exception for compatibility with older browsers or devices should be mentioned. |
Some other key parameters will be Manageability, Extensibility, Auditability, Accessibility, etc.
With the above information on NFR, a workload model is prepared as input to the performance scripting phase. This is an example only.
| 1st Year | 2nd Year | 3rd Year | |
| Peak Pageviews in d days. | 1 million | 2 million | 5 million |
| Total Number of Order in the peak hour. | 200K | 200K | 200K |
| Average number of users in the Peak Hour. | 2000 | 3000 | 4000 |
| Max no. of users in peak hour. | 4000 | 6000 | 8000 |
| No. of transactions/sec. | 2 million | 5 million | 10 million |
Often such information can be used to do capacility planning as well which can help to derive the infrastructure and licensing cost. Again there are multiple other parameters to be considered like if the platform is on IaaS vs. PaaS or SaaS or on-premise or hybrid cloud or multi-cloud which will determine overall sizing, CAPEX and OPEX, and Total-Cost-of-Ownership aka TCO for the platform.
A quick simple sample of how the sizing can be done is mentioned below. There can be more factors for calculation depending on the platform, infrastructure, language, and application-level complexities. Here the calculation is done for average capacity only.
| Criteria | Data | Comments |
| Peak Visitor/hour | 4000 | Peak and Average can be considered for high and low scaling of servers |
| Concurrent users in average load (per min) | 300 | |
| Average no. of pages browsed by each visitor | 3 | |
| No. of page views/min | 900 | |
| Pageviews to API call (average) | 2 | Some pages will be heavy, somewhere server-side rendering with HTML will be built other places it can be client-side rendering, it can be headed vs. headless application. Also, Ajax calls can be there. The application can standard vs. SPA which will drive this number as well. |
| API calls/hour | 1800 | |
| API calls/sec | 30 | |
| No. of API calls handled by each core/sec | 3 | This will differ based on which language is used, some languages are tuned for parallel processing others are thread intensive. Also, another important part is the clock speed of the CPU, the higher the clock speed mentioned in GHz more the processing power of that CPU. |
| Total Core | 10 | |
| Details | Provision 3 VMs with 4 Core and 8 GB RAM at average | Low Clock speed like 2 GHz or so Also add the storage, network bandwidth. The CPU can be virtual if this is cloud. |
Normally the deployment in Cloud will have auto-scaling capability provisioned through containerization, so the nodes will be added or removed to handle peak load. In case it is not there, provision needs to be exercised for supporting peak load and the VMs should be planned accordingly during capacity planning.
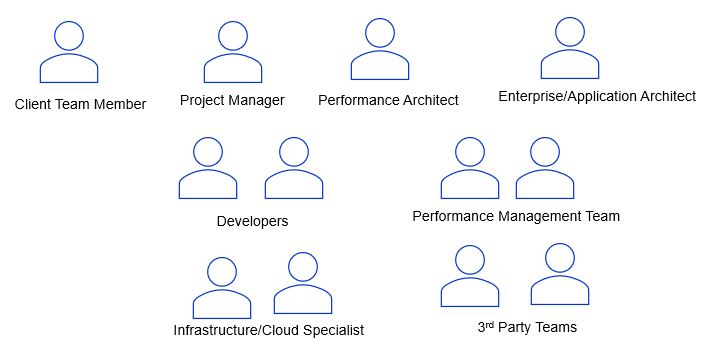
Typical Team Structure
Please find the team structure for the performance testing phase. The developers are needed from the server and client-side, integration, and other supported platforms as applicable. The Performance management team will have SMEs for scripting test scenarios, executing performance tests, and publishing the results.
Types of Performance Testing
Single User Testing — This is a simple testing process during the build phase for finding early issues and take preventive steps.
Load Testing, Stress Testing — This is based on the load model in concurrent user scenarios, typically goes for 30 mins-1 hour time for peak load.
Stress Testing — This is about putting stress on the system for a long time and check how the system performs.
Endurance Testing — This tests how much endure the system is, where is breakpoint; run average load for 8-10 hours and check memory, CPU parameters.
Resilience Testing — This tests how the system will behave if any node goes down, typically exception or error handling, server-level crash, network-level outage, fault tolerance, etc. are checked here.
Screen or API Testing — The test can happen for websites, or it can be pure headless API or microservices level testing.
Apart from the application, the network and infrastructure are also covered through these testing processes.
Primary Area of Tuning and Optimization
The tuning can be done across Application Server, Client, Platform, Infrastructure, Network, Edge-Services, Gateways, Middleware, Legacy systems, JVM, etc.
If this is a COTS platform like Adobe Experience Manager, SAP Commerce, Drupal then the underlying platform with application or custom code will be a candidate for tuning whereas any pure custom solutions like building portal and eCommerce or messaging solutions on native cloud or popular frameworks will need tuning on custom code mainly.
Tuning at Server-Side
In any JVM-based application server, one of the main parts is to look at is how JVM is performing when running the platform/application on it. How much memory is it taking, whether memory is tuned to its optimal number or right garbage collection is used or not of if garbage collection is happening properly or not, and so on?
A high-level view of the internal structure of JVM is mentioned here.
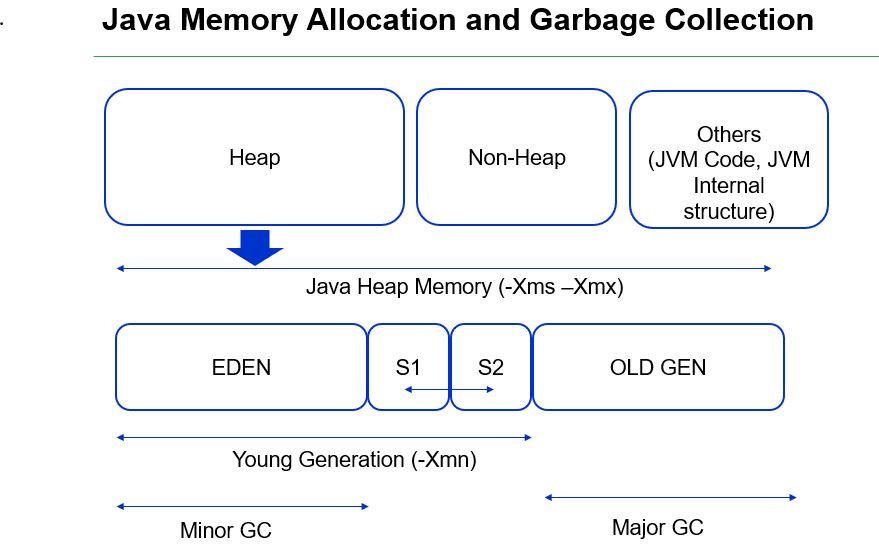
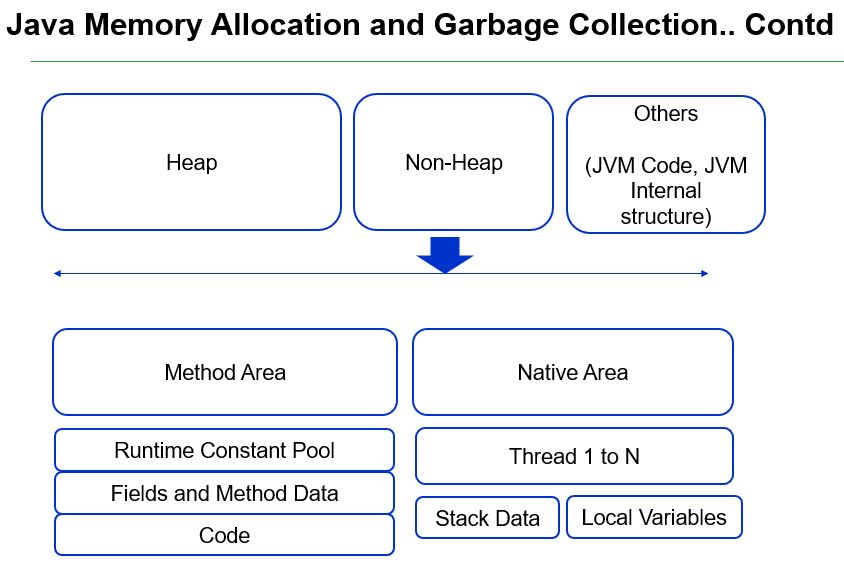
There is plenty of information available on JVM on many sites, but the key components are the old and new generations of the heap which is managed by "NewRatio" as part of JVM parameters. The default value is 2. If the Young generation is getting full quickly this means short-lived objects are getting created quickly and there is a memory leak while if Old generation is getting full quickly which means long-running objects are more and promoting from Young to Old space because they live longer. The work will be to check if objects are creating as needed but not getting disposed of. Typically if the server owns a high amount of cache objects the old generation can go high; there are several guidelines available for memory level optimization. The JVM languages like Java or Scala have best practices in the areas of management of objects.
In general, the recommendation is to use G1 GC for Java 8 and 11. We will discuss a bit more on the areas of the memory map of JVM here.
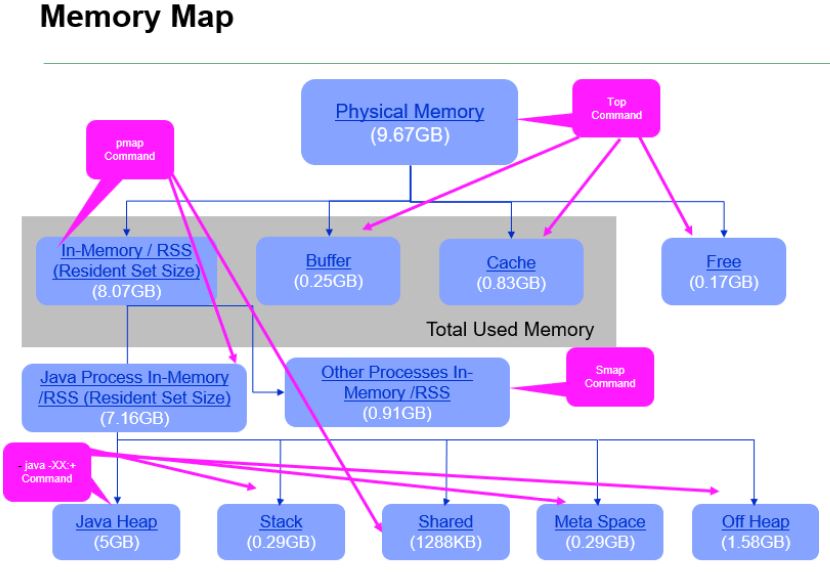
Memory Definitions
Resident Size Set (RSS) = [JVM Heap + Stack + MetaSpace + Shared Memory + Off Heap].
Total Used Memory = [RSS of all the processes + Buffer + Cache].
Off Heap = RSS - JVM Heap - (thread stack size * thread count) - Shared Memory - MetaSpace.
Recommendations
Total In-memory should be <= 70 % of the total Physical memory
Cache >= Swap.
There are commands available to find out the details around each of these memory areas. Mostly any APM tool like AppDynamics, Dynatrace, or New Relic gives memory information but in order to get micro-level details, it's better to use UNIX commands (better to build automated scripts to capture information during any load testing) for troubleshooting purpose.
When CPU goes high normally it happens because threads are stuck or blocked or context switching for CPU to provide a slot to one thread than other. The thread dumps provide important insight in this case. Java is a thread-heavy programming stack while other languages or platforms like PHP, Node.js work in a less intensive thread model. In fact, Node.js works on a single thread model but with asynchronous I/O and events to process multiple requests.
Often synchronous calls make threads in action, thread pooling or pre-warming of the pools are ways to optimize the resources to create threads. Java provides non-blocking way to communicate using NIO package for process intensive calls. The entire concept of reactive programming is to support parallel invocation of calls in asynchronous or callback ways where no invocations are blocked till response comes, rather calls are put in a queue to process and callbacks are invoked to the caller program when the response is received. The popular frameworks like Vert.x or RxJava use this pattern. Please check Reactive Manifesto to handle systems need to handle very high concurrent traffic and support high throughput.
While tuning memory and CPU is an important part of the:
Heap Dump Creation
–jmap -dump:format=b,file=<filename.hprof> <pid>
Process Thread Count
–cat /proc/<pid>/status | grep Threads
–ps uH p <pid>
Process Memory Mapping
–pmap –x <pid>
contents of /proc/<pid>/smaps file
Additionally, Caching becomes a key element for tuning performance. In general static or non-frequently changed data that can stay for some time or doesn't change often can be cached. Each cache needs to mention size, time-to-live, invalidation strategy (LRU, LFU), etc. There are many caching platforms available at various levels of the architecture layers. The below diagram shows the same.
- Database level caching (Normally RDBMS like Oracle, MySQL can have some in-memory cache, a modern database like HANA or Postgress is more capable to handle in-memory cache).
- NoSQL database has a much broader capability to cache data; Redis is often used as a cache to store key-value data; Cloud Databases like Amazon DynamoDB or Aurora or Azure SQL are tuned to perform better at large scale. There are many other databases available in modern architecture to support large volume, faster processing, low latency, and high throughput. The concept of caching is in-built to many such platforms, no need for additional configuration or tuning required for the majority of the time.
- In-memory databases aka IMDB like Hazel Cast, BigMemory, Oracle Coherence, etc. are built for supporting higher sized memory level cache for distributed application mode with optimal performance and latency.
- Many application servers or COTS platforms come with their in-built capability for caching data, query, etc.
- Data can be cached at HTML fragment level also known as "CMS Caching," which helps to load the web pages with heavy content quickly. Platforms like Varnish are well suited for this kind of use case.
- Web servers like Apache, Nginx can also cache static assets like JS, CSS, Images, Fonts, etc.
- CDN like Akamai, Layer 7 is MUST for any internet-facing website for edge caching data, web assets, etc.
Tuning at Client Side
The following diagram shows how the specifications are evolving to measure front-end specifically browser-based applications as well as what all toolsets are available.
Google Vitals (https://web.dev/vitals/) is the new specification that determines how the page level performance will be measured. The specifications like Google PageSpeed or Yahoo YSlow are legacy now. The Web Vitals use 3 basic parameters like Largest Contentful Paint aka LCP, First Input Delay aka FID, Cumulative Layout Shift, or CLA to define the performance metrics.
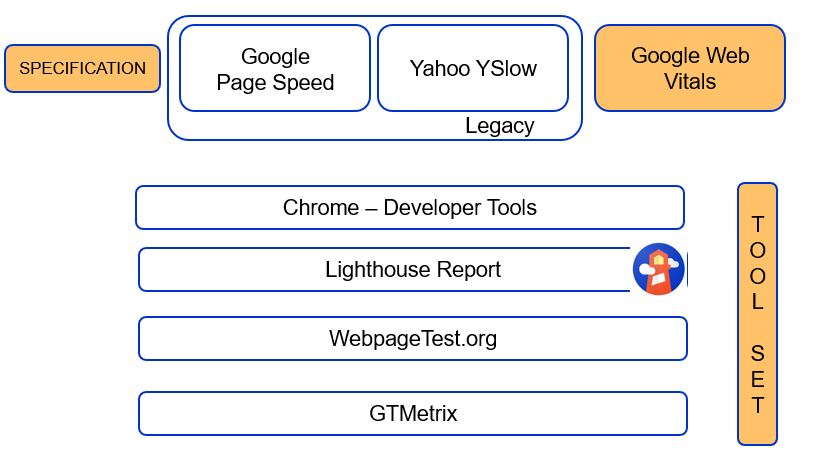
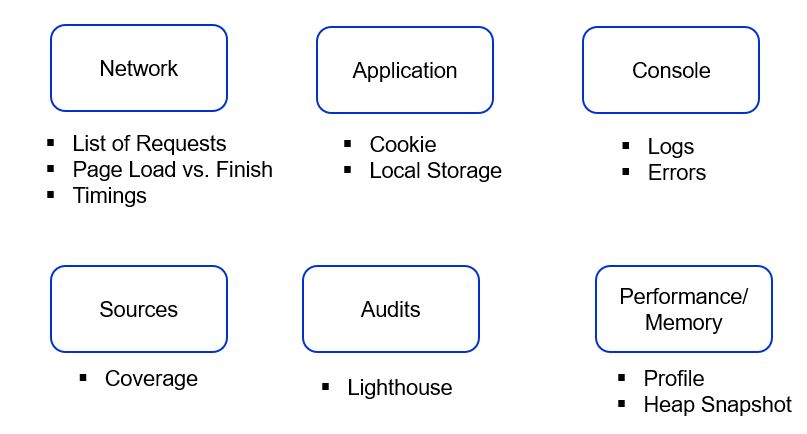
The following section mentions all options available in Chrome Developer Tools to analyze any page-level performance. The Network tab details out TTFB directly while TTLB can be received by adding Content Download time also.
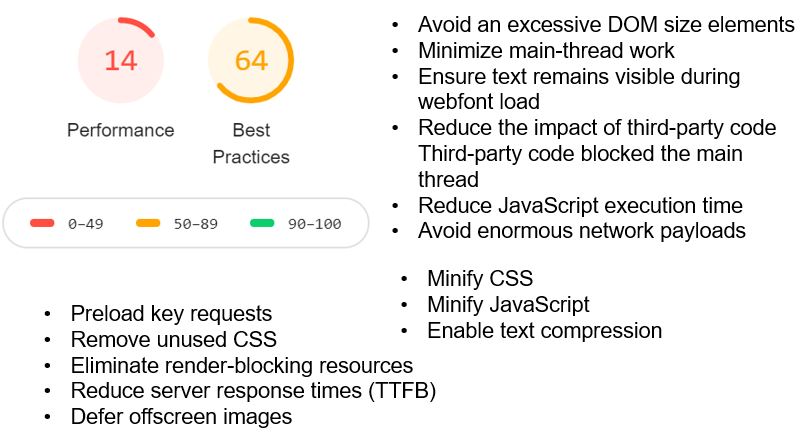
Lighthouse is the tool to run the test in Chrome which uses Web vitals as the specification to create the report.
A quick look at the Lighthouse report with key pointers for optimization highlighted in general for most cases.
Integration, Gateway, Web Server, and Others
On the Integration side, tune the parameters like rate limiting, throttling, queue depth in general. While enterprise platform like Mulesoft, TIBCO, Oracle Service Bus, WSO2 integration, Dell Boomy platforms provides management capabilities and optimization parameters at scale from iPaaS side, individual applications running on these will need tuning as well for any custom flows.
In many cases Serverless platforms, Microservices are becoming de-facto standards for service layers. This is important to manage service level discovery and communication, proxy settings, resilience management using circuit breakers, logging, tracing, etc.
API Gateway like Apigee or AWS or Azure Gateway has become crucial components in the N-layer architecture to manage API governance, caching, routing, proxying, transformation within and outside the enterprise's firewall. It is important to include the API Gateway to log transaction details during the testing phase for the troubleshooting process.
As Event-Driven Architecture and Reactive microservices are becoming more popular for high performance and throughput systems, tracing and logging are even getting more important. Popular platforms like Kafka, Solace, RabbitMQ, Cloud Queue like SNS, SQS, etc. support required mechanisms to handle traffic, scalability, durability so that events are published and consumed properly within the system landscape.
Web Server is an important component in the puzzle. The special attention points are the number of parallel connections, non-blocking I/O, persistent connections, configurations for sicky sessions, etc.
Any 3rd party calls ensure that delay in response time will be the responsibility of the vendor and shouldn't be a factor for meeting NFR criteria. Also discuss with 3rd systems or any integration platforms to confirm that the required transaction volumes and scales can be handled at their sides also.
The other key area is cluster management, protocols of communication like JGroup, Zookeeper, etc. Sometimes these protocols need OS-level settings or general configuration as well as selecting the right communication patterns to ensure data is sync across nodes in the cluster properly. Though this is not a direct topic here, the performance of the cluster will also influence the overall data flows and synchronization within a distributed architecture.
Tools and Frameworks
This is a snapshot of tools and frameworks used to analyze the performance issues.
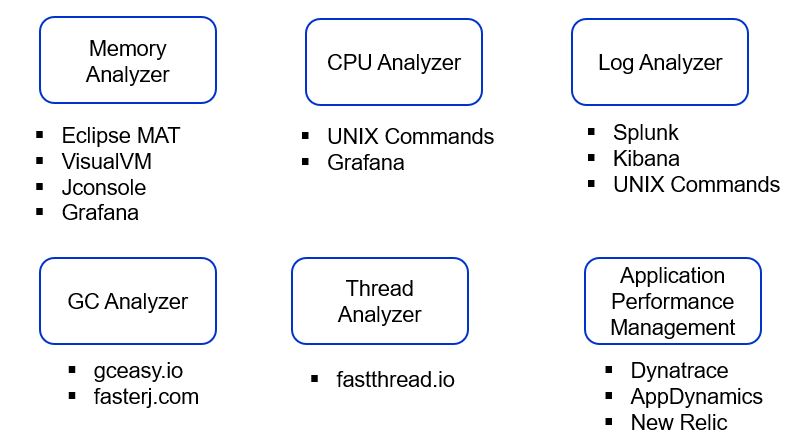
For memory analyzers, Heaphero is a very sophisticated tool. If tools like Eclipse MAT or Visual VM are not able to provide enough details then this can be adopted. During memory analysis check which object is taking more space, if there is any memory leak. In case of memory dump is large, arrange for a high configuration machine to analyze the dump as it will require considerable resources to load and analyze the dump.
Tier1App has few popular products in performance analysis apart from Heaphero like GCEasy and FastThread. GCEasy is used for GC analysis while FastThread analyzes the thread dump.
It is also important to understand the difference between Dynatrace, AppDynamics, and New Relic in terms of capability, convenience of use, licensing cost, etc. While these are popular with enterprise customers there are other platforms like Pingdom also. Please check the below Magic Quadrant from Gartner this year for reference.
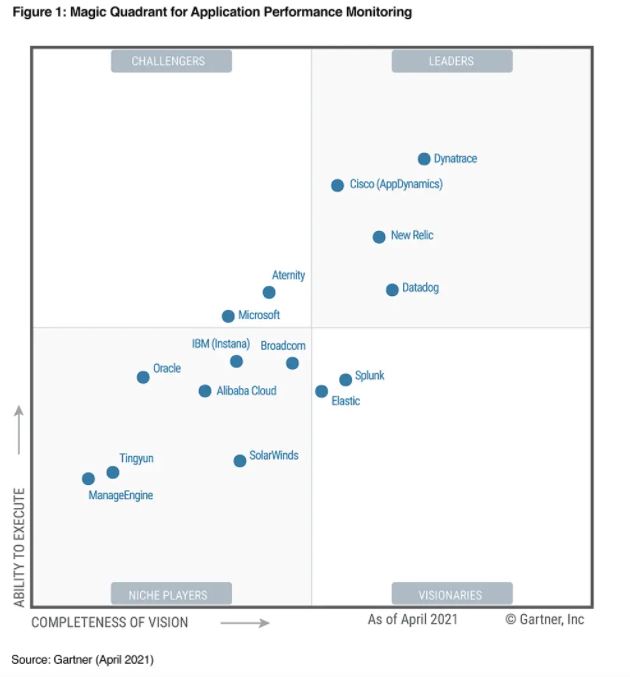
As I have used all 3, AppDynamics is a bit more user-friendly and easy to use while others are also equally good and powerful platforms. While all these APM platforms come with server-side monitoring, the trace of calls or APIs, proprietary query language, dashboard, and reporting it is also important to find they have something called "Real-time User Monitoring" or RUM which captures end-users data to identify the front-end performance also in terms of page load, server call time or TTFB, etc. In general, this comes with a separate licensing feed. This is a plug-in that uses JavaScript to inject code into the user's browser to capture data and send to the central server.
Another important toolset is around logging, tracing, monitoring, and alerting capabilities. The public clouds like AWS, GCP, and Azure come with native capability but there are popular platforms like Prometheus, Datadog, Kibana, Splunk, Grafana, Jaeger which helps to aggregate, query, trace, and report data during the troubleshooting process. Many APM tools like New Relic, AppDynamics can be integrated with these specialized platforms also. In a distributed environment with multiple systems communicating with each other, collecting all such information is very important for the operational process.
There are several tools available for load Testing like JMeter, NeoLoad, LoadRunner, etc. While JMeter is free to use, both LoadRunner and NeoLoad are licensed products.
As per the workload model, scripts are created and run through these tools. The report is also generated accordingly. The performance environment should be planned similarly to the product environment in terms of infrastructure, network, configuration, and data. If a real environment for 3rd party is not available, virtual environments can be created.
It is good to create some reporting dashboard in Splunk or Kibana like the following ones.
- GC Log — No. of major and minor GC, Stop-the-world scenarios.
- Exception Log — Find out multiple errors from 4xx, 5xx and take remedial steps.
- Tracing — Use trace id mechanism to connect multiple calls into a consolidated report.
- Count of most crucial transactions.
Some Important Tips for Performance Testing
- Ensure the developers understand the nitty-gritty of these toolsets well in advance. There are free or paid training courses from these platforms. A lot of free videos are available on YouTube also.
- Choose the toolset according to the platform requirements; do some research and ask product vendors to demonstrate capabilities.
- Try not to duplicate operational capabilities in multiple tools and processes.
- Create a cheat sheet of commands, processes, lessons learned database.
- Set up an alert mechanism to monitor system health during performance tests for proactive monitoring.
Troubleshooting Commands
A list of common commands used during the troubleshooting process is mentioned below. Please check the syntax during the execution.
Thread Count
cat /proc/<pid>/status | grep Threads
ps uH p <pid>
Heap Configuration
java -XX:+PrintFlagsFinal -version | grep HeapSize
Thread Dump
jstack <<pid>> [Take Thread dumps in some interval say 15 secs for 1 min]
Thread Stack Size
java -XX:+PrintFlagsFinal -version | grep ThreadStackSize
Others
pmap –x <<pid>>
top
nestat -a | grep <<port number>>
kill -9 <<pid>>
kill -3 <<pid>>
ps –ef| grep –i java
/bin/jstat –gc <pid>
jstat -gc <pid> | tail -l | awk '(split($0,a," "); sum=a[3]+a[4]+a[6]+a[8]; print sum " Kb")'
/bin/jmap –heap <pid>
Conclusion
Performance testing is one of the most challenging yet exciting phases of any project. While teams need to use their usual development skills, the process and toolsets for troubleshooting become very important to find the right root cause within permissible time. Therefore all these details are documented from our practical experience in dealing with medium to large-scale enterprise solutions. Hope this blog will be helpful to the people interested in this area.
References:
https://plumbr.io/java-garbage-collection-handbook [Very useful handbook]
https://www.infoq.com/interviews/beckwith-garbage-collection/ [One of the renowned experts]
Gartner Magic Quadrant 2021 on APM
Special Thanks to my ex-colleague Jayanti Vemulapati and my current team member Pooja Lamba for sharing content for this blog. There were technical sessions on this topic where me and Pooja had presented to architects and developer groups.
Opinions expressed by DZone contributors are their own.

Comments