Improving Snowflake Performance by Mastering the Query Profile
Take an in-depth look at how Snowflake executes queries and maximize Query performance using these advanced techniques.
Join the DZone community and get the full member experience.
Join For FreeHaving worked with over 50 Snowflake customers across Europe and the Middle East, I've analyzed hundreds of Query Profiles and identified many issues including issues around performance and cost.
In this article, I'll explain:
- What is the Snowflake Query Profile, and how to read and understand the components
- How the Query Profile reveals how Snowflake executes queries and provides insights about Snowflake and potential query tuning
- What to look out for in a Query Profile and how to identify and resolve SQL issues
By the end of this article, you should have a much better understanding and appreciation of this feature and learn how to identify and resolve query performance issues.
What Is a Snowflake Query Profile?
The Snowflake Query Profile is a visual diagram explaining how Snowflake has executed your query. It shows the steps taken, the data volumes processed, and a breakdown of the most important statistics.
Query Profile: A Simple Example
To demonstrate how to read the query profile, let's consider this relatively simple Snowflake SQL:
select o_orderstatus,
       sum(o_totalprice)
from orders
where year(o_orderdate) = 1994
group by all
order by 1;
The above query was executed against a copy of the Snowflake sample data in the snowflake_sample_data.tpch_sf100.orders table, which holds 150m rows or about 4.6GB of data.
Here's the query profile it produced. We'll explain the components below.

Query Profile: Steps
The diagram below illustrates the Query Steps. These are executed from the bottom up, and each step represents an independently executing process that processes a batch of a few thousand rows of data in parallel.
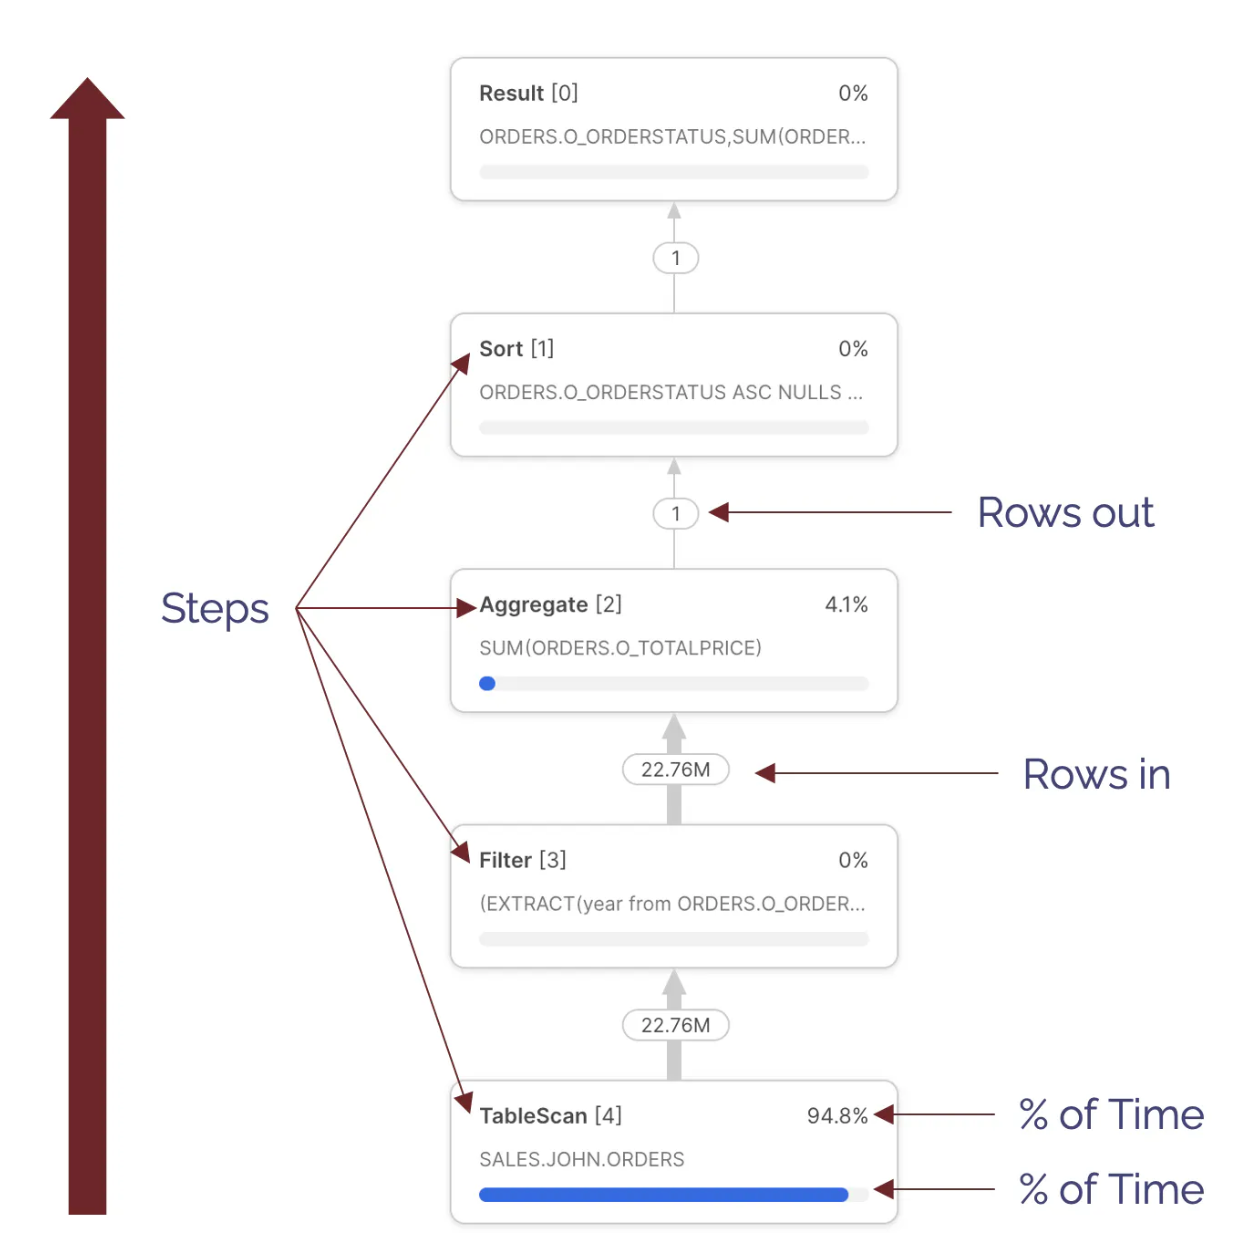
There are various types available, but the most common include:
- TableScan [4] - Indicating data being read from a table; Notice this step took 94.8% of the overall execution time. This indicates the query spent most of the time scanning data. Notice we cannot tell from this whether data was read from the virtual warehouse cache or remote storage.
- Filter[3] - This attempts to reduce the number of rows processed by filtering out the data. Notice the
Filterstep takes in 22.76M rows and outputs the same number. This raises the question of whether thewhereclause filtered any results. - Aggregate [2] - This indicates a step summarizing results. In this case, it produced the
sum(orders.totalprice). Notice that this step received 22.76M rows and output just one row. - Sort [1] - Which represents the
order by orderstatus. This sorts the results before returning them to the Result Set.
Query Profile: Overview and Statistics
Query Profile: Overview
The diagram below summarises the components of the Profile Overview, highlighting the most important components.
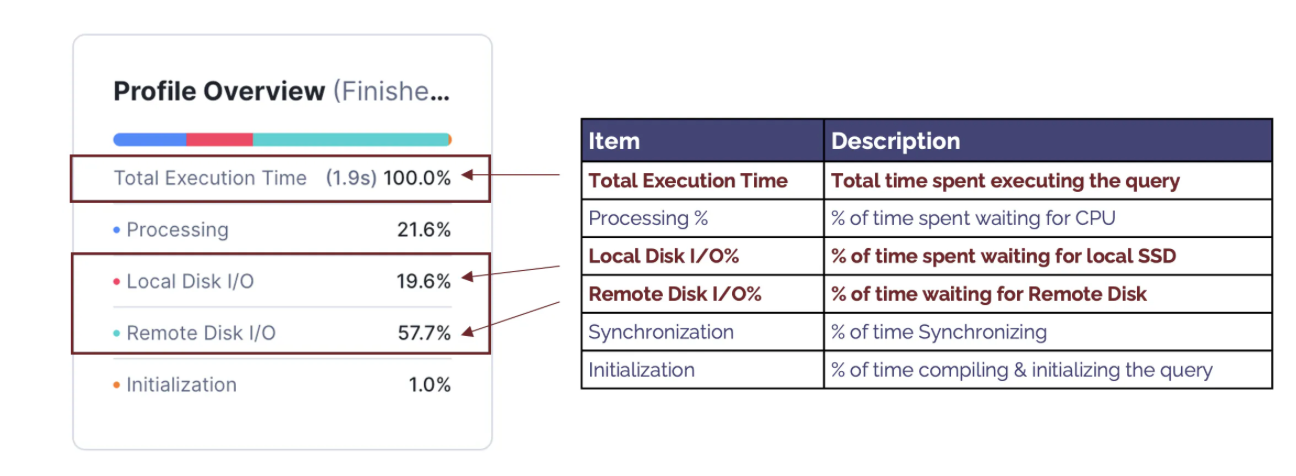
The components include:
- Total Execution Time: This indicates the actual time in seconds the query took to complete. Note: The elapsed time usually is slightly longer as it includes other factors, including compilation time and time spent queuing for resources.
- Processing %: Indicates the percentage of time the query spends waiting for the CPU; When this is a high percentage of total execution time, it indicates the query is CPU-bound — performing complex processing.
- Local Disk I/O %: Indicates the percentage of time waiting for SSD
- Remote Disk I/O %: This indicates the percentage of time spent waiting for Remote Disk I/O. A high percentage indicates the query was I/O bound. This suggests that the performance can be best improved by reducing the time spent reading from the disk.
- Synchronizing %: This is seldom useful and indicates the percentage of time spent synchronizing between processes. This tends to be higher as a result of sort operations.
- Initialization %: Tends to be a low percentage of overall execution time and indicates time spent compiling the query; A high percentage normally indicates a potentially over-complex query with many sub-queries but a short execution time. This suggests the query is best improved by simplifying the query design to reduce complexity and, therefore, compilation time.
Query Profile Statistics
The diagram below summarises the components of the Profile Statistics, highlighting the most important components.

The components include:
- Scan Progress: This indicates the percentage of data scanned. When the query is still executing, this can be used to estimate the percentage of time remaining.
- Bytes Scanned: This indicates the number of bytes scanned. Unlike row-based databases, Snowflake fetches only the columns needed, and this indicates the data volume fetched from Local and Remote storage.
- Percentage Scanned from Cache: This is often mistaken for a vital statistic to monitor. However, when considering the performance of a specific SQL statement, Percentage Scanned from Cache is a poor indicator of good or bad query performance and should be largely ignored.
- Partitions Scanned: This indicates the number of micro partitions scanned and tends to be a critical determinant of query performance. It also indicates the volume of data fetched from remote storage and the extent to which Snowflake could partition eliminate — to skip over partitions, explained below.
- Partitions Total: Shows the total number of partitions in all tables read. This is best read in conjunction with Partitions Scanned and indicates the efficiency of partition elimination. For example, this query fetched 133 of 247 micro partitions and scanned just 53% of the data. A lower percentage indicates a higher rate of partition elimination, which will significantly improve queries that are I/O bound.
A Join Query Profile
While the simple example above illustrates how to read a query profile, we need to know how Snowflake handles JOIN operations between tables to fully understand how Snowflake works.
The SQL query below includes a join of the customer and orders tables:
select  c_mktsegment
,       count(*)
,       sum(o_totalprice)
,       count(*)
from    customer
,       orders
where   c_custkey = o_custkey
and     o_orderdate between ('01-JAN-1992') and ('31-JAN-1992')
group by 1
order by 1;
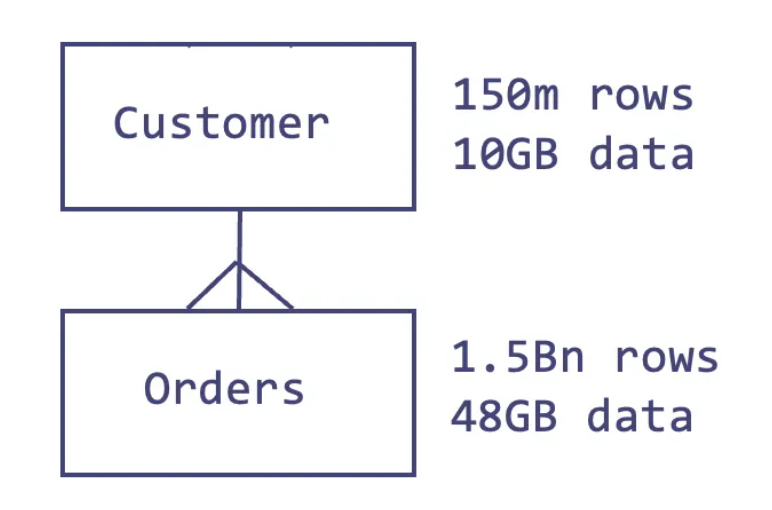
The diagram below illustrates the relationship between these tables in the Snowflake sample data in the snowflake_sample_data.tpch_sf100 schema.
 The diagram below illustrates the Snowflake Query Plan used to execute this query, highlighting the initial steps that involve fetching data from storage.
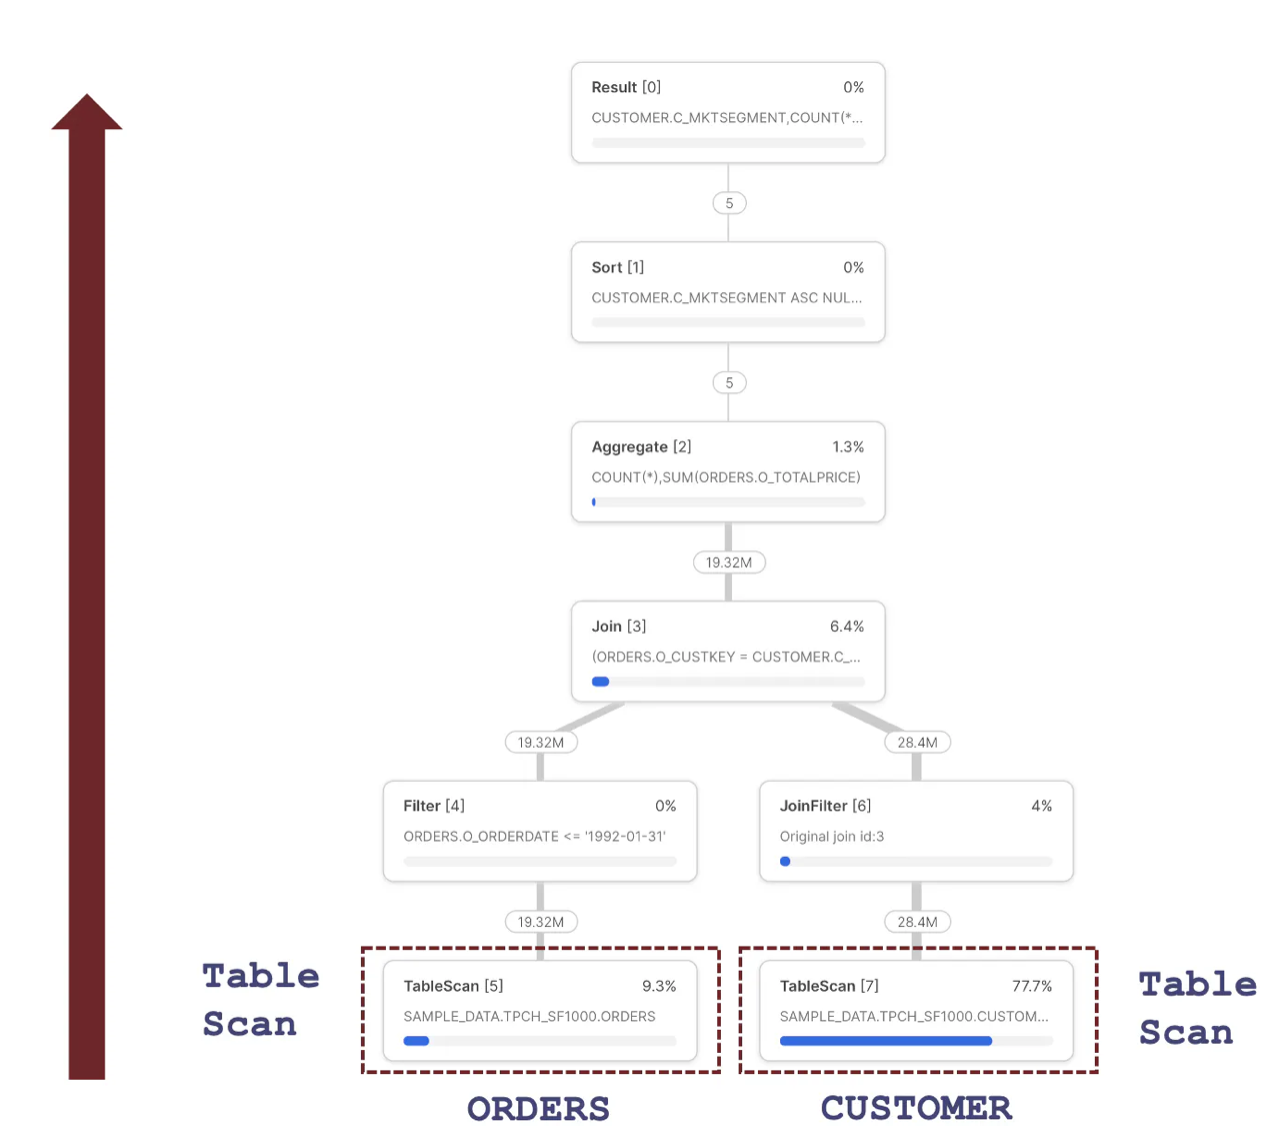
One of the most important insights about the Query Profile above is that each step represents an independently operating parallel process that runs concurrently. This uses advanced vectorized processing to fetch and process a few thousand rows at a time, passing them to the next step to process in parallel.
Snowflake can use this architecture to break down complex query pipelines, executing individual steps in parallel across all CPUs in a Virtual Warehouse. It also means Snowflake can read data from the ORDERS and CUSTOMER data in parallel using the Table Scan operations.
How Does Snowflake Execute a JOIN Operation?
The diagram below illustrates the processing sequence of a Snowflake JOIN operation. To read the sequence correctly, always start from the Join step and take the left leg, in this case, down to the TableScan of the ORDERS table, step 5.
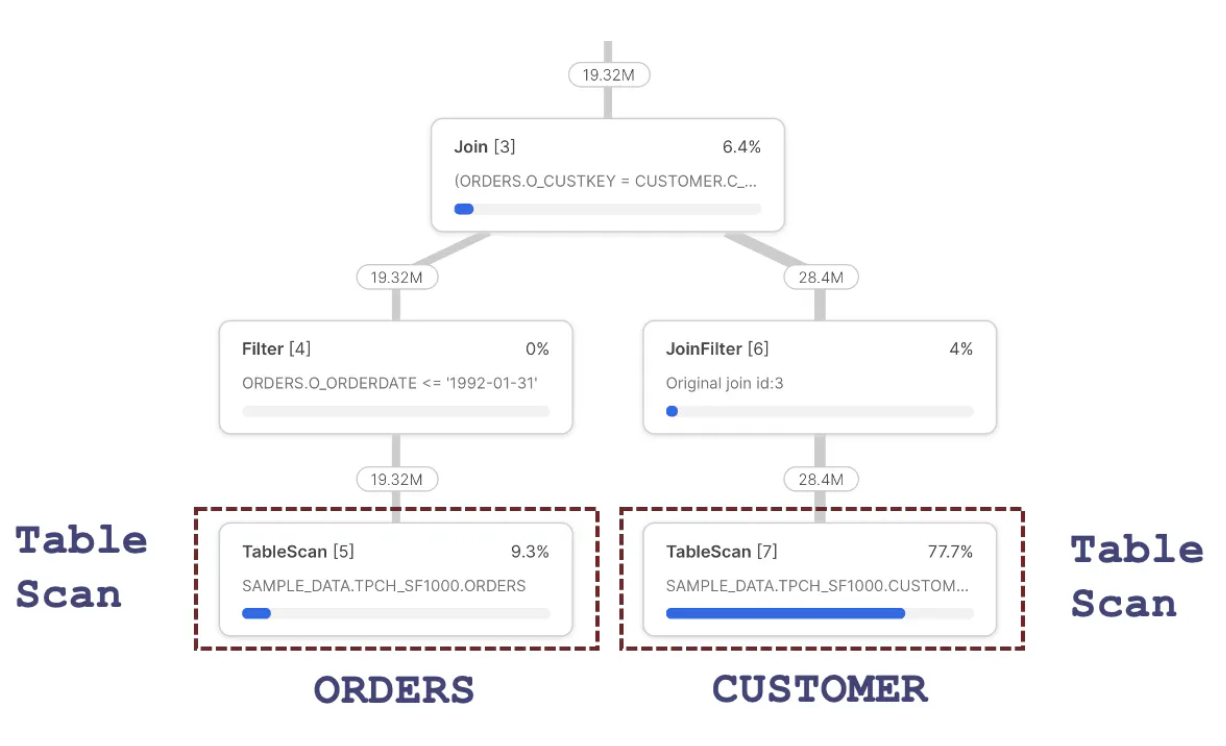
The diagram above indicates the steps were as follows:
- TableScan [5]: This fetches data from the
ORDERStable, which returns 19.32M rows out of 150M rows. This reduction is explained by the Snowflake's ability to automatically partition eliminate - to skip over micro-partitions, as described in the article on Snowflake Cluster Keys. Notice that the query spent 9.3% of the time processing this step. - Filter [4]: Receives 19.32M rows and logically represents the following line in the above query:
and o_orderdate between ('01-JAN-1992') and ('31-JAN-1992')
This step represents filtering rows from the ORDERS table before passing them to the Join [3] step above. Surprisingly, this step appears to do no actual work as it receives and emits 19.32M rows. However, Snowflake uses Predicate Pushdown, which filters the rows in the TableScan [4] step before reading them into memory. The output of this step is passed to the Join step.
- Join [3]: Receives
ORDERSrows but needs to fetch correspondingCUSTOMERentries. We, therefore, need to skip down to theTableScan [7]step. - TableScan [7]: Fetches data from the
CUSTOMERtable. Notice this step takes 77.7% of the overall execution time and, therefore, has the most significant potential benefit from query performance tuning. This step fetches 28.4M rows, although Snowflake automatically tunes this step, as there are 1.5 Bn rows on theCUSTOMERtable. - JoinFilter [6]: This step represents an automatic Snowflake performance tuning operation that uses a Bloom Filter to avoid scanning micro-partitions on the right-hand side of a
Joinoperation. In summary, as Snowflake has already fetched theCUSTOMERentries, it only needs to fetchORDERSfor the matchingCUSTOMERrows. This explains the fact theTableScan [7]returns only 28M of the 1.5Bn possible entries. It's worth noting this performance tuning is automatically applied, although it could be improved using a Cluster Key on theORDERStable on the join columns. - Join [3]: This represents the actual join of data in the
CUSTOMERandORDERStables. It's important to understand that every SnowflakeJoinoperation is implemented as a Hash Join.
What Is a Snowflake Hash Join?
While it may appear we're disappearing into the Snowflake internals, bear with me. Understanding how Snowflake executes JOIN operations highlights a critical performance-tuning opportunity.
The diagram below highlights the essential statistics to watch out for in any Snowflake Join operation.
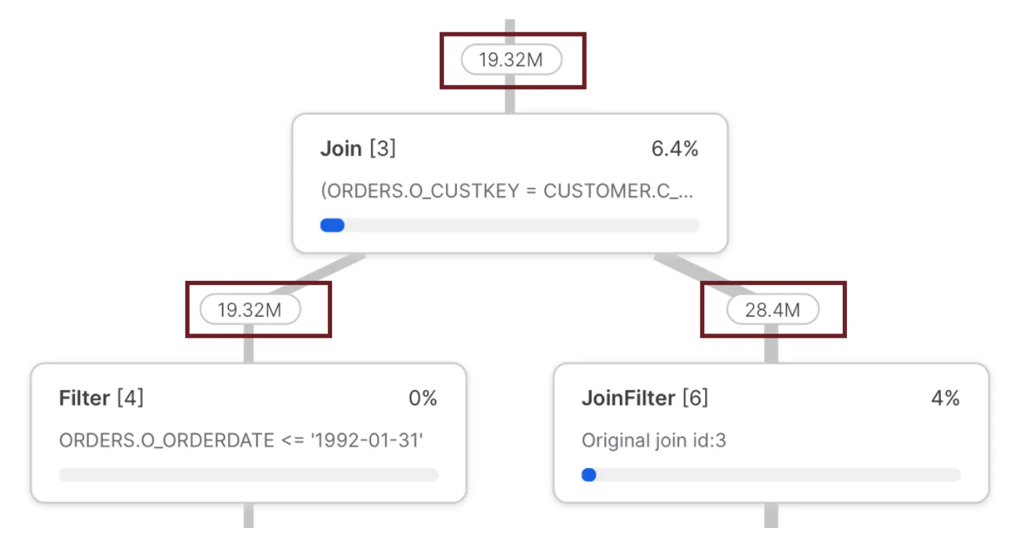
The diagram above shows the number of rows fed into the JOIN and the total rows returned. In particular, the left leg delivered fewer rows (19.32M) than the right leg (28.4M). This is important because it highlights an infrequent but critical performance pattern: The number of rows fed into the left leg of a JOIN must always be less than the right.
The reason for this critical rule is revealed in the way Snowflake executes a Hash Join, which is illustrated in the diagram below:
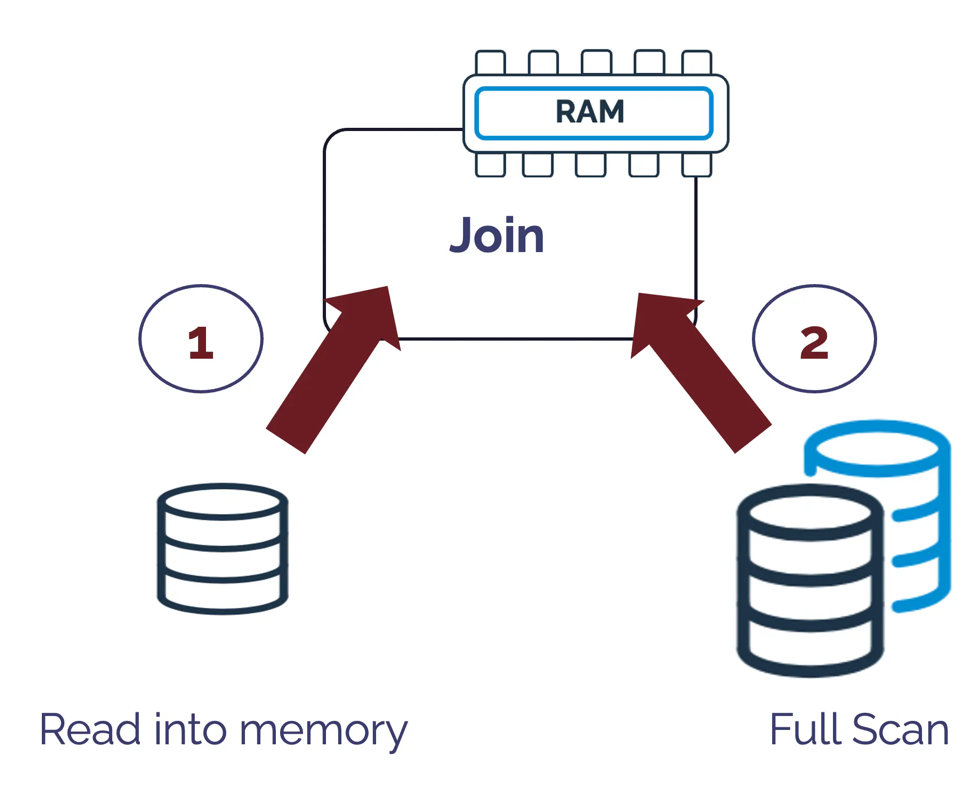
The above diagram illustrates how a Hash Join operation works by reading an entire table into memory and generating a unique hash key for each row. It then performs a full table scan, which looks up against the in-memory hash key to join the resulting data sets.
Therefore, it's essential to correctly identify the smaller of the two data sets and read it into memory while scanning the larger of the two, but sometimes Snowflake gets it wrong. The screen-shot below illustrates the situation:
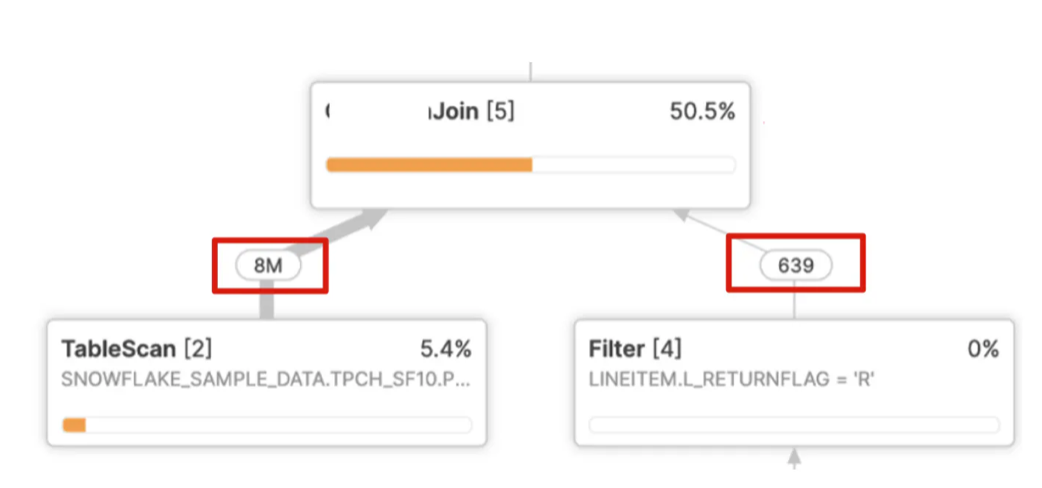
In the above example, Snowflake needs to read eight million entries into memory, create a hash key for each row, and perform a full scan of just 639 rows. This leads to very poor query performance and a join that should take seconds but often takes hours.
As I have explained previously in an article on Snowflake Performance Tuning, this is often the result of multiple nested joins and group by operations, which makes it difficult for Snowflake to identify the cardinality correctly.
While this happens infrequently, it can lead to extreme performance degradation and the best practice approach is to simplify the query, perhaps breaking it down into multiple steps using transient or temporary tables.
Identifying Issues Using the Query Profile
Query Profile Join Explosion
The screenshot below illustrates a common issue that often leads to both poor query performance and (more importantly) incorrect results.
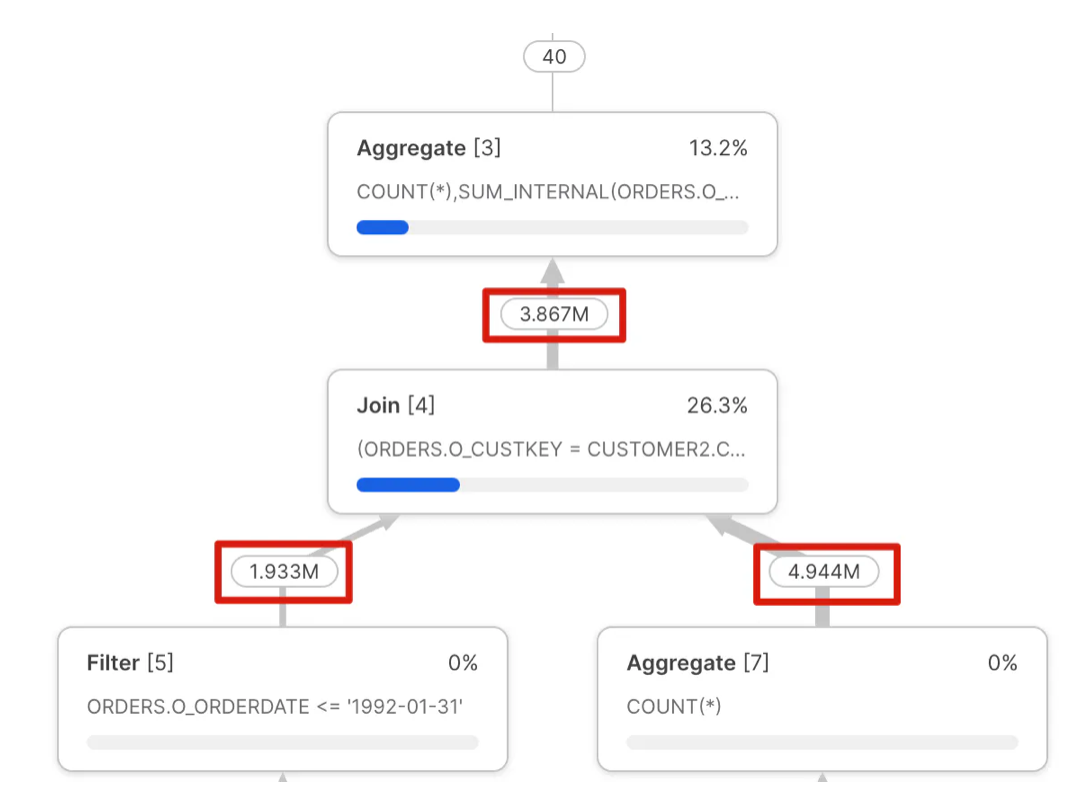
Notice the output of the Join [4] step doesn't match the values input on the left or right leg despite the fact the query join clause is a simple join by CUSTKEY?
This issue is often called a "Join Explosion" and is typically caused by duplicate values in one of the tables. As indicated above, this frequently leads to poor query performance and should be investigated and fixed.
GET_OPERATOR_QUERY_STATS , which allows programmatic access to the query profile.
Unintended Cartesian Join
The screenshot below illustrates another common issue easily identified in the Snowflake query profile: a cartesian join operation.
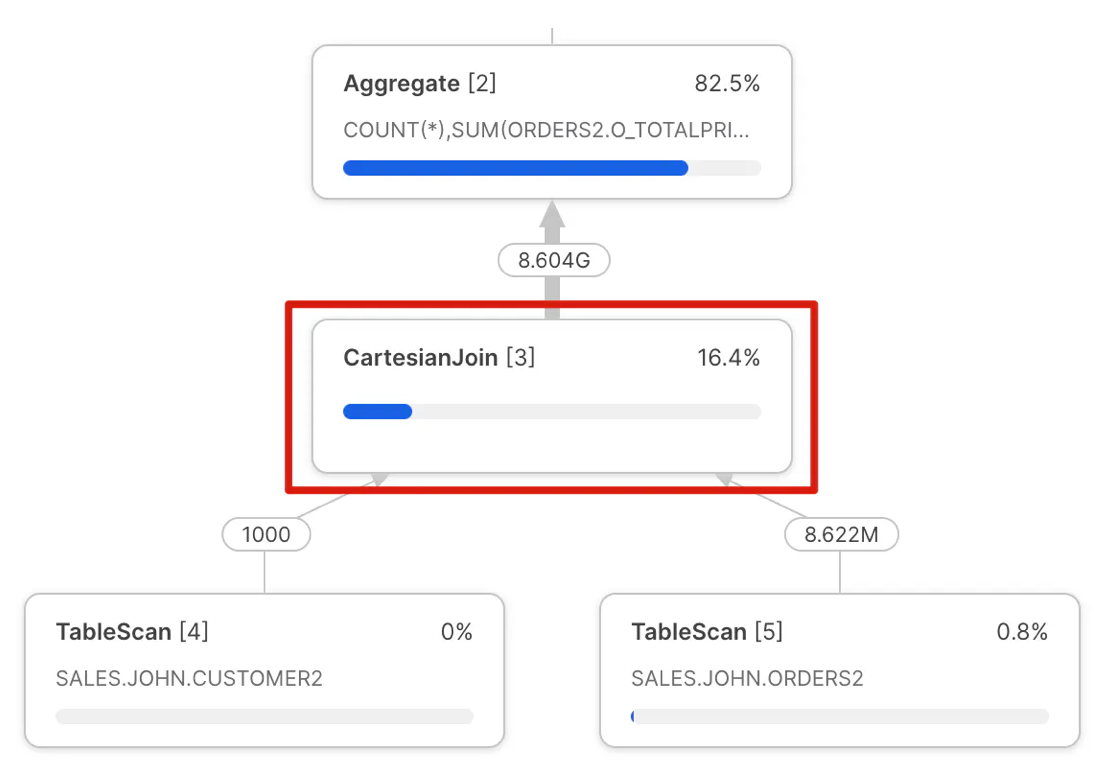
Similar to the Join Explosion above, this query profile is produced by a mistake in the SQL query. This mistake produces an output that multiplies the size of both inputs. Again, this is easy to spot in a query profile, and although it may, in some cases, be intentional, if not, it can lead to very poor query performance.
Disjunctive OR Query
Disjunctive database queries are queries that include an OR in the query WHEREclause. This is an example of a valid use of the Cartesian Join, but one which can be easily avoided.
Take, for example, the following query:
select distinct l_linenumber
from snowflake_sample_data.tpch_sf1.lineitem,
     snowflake_sample_data.tpch_sf1.partsupp
where (l_partkey = ps_partkey)
or
      (l_suppkey = ps_suppkey);
The above query produced the following Snowflake Query Profile and took 7m 28s to complete on an XSMALL warehouse despite scanning only 28 micro partitions.
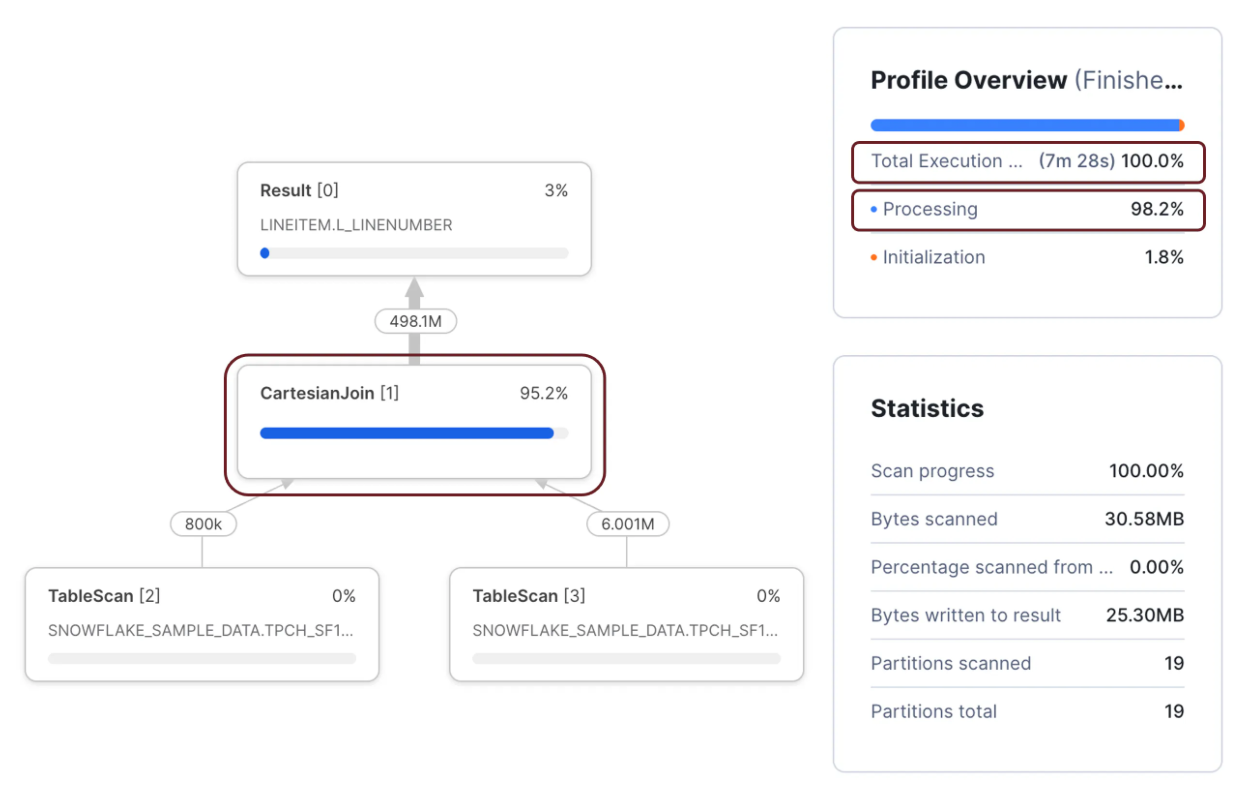 However, when the same query was rewritten (below) to use a UNION statement, it took just 3.4 seconds to complete, a 132 times performance improvement for very little effort.
select l_linenumber
from snowflake_sample_data.tpch_sf1.lineitem
join snowflake_sample_data.tpch_sf1.partsupp
on   l_partkey = ps_partkey
union
select l_linenumber
from snowflake_sample_data.tpch_sf1.lineitem
join snowflake_sample_data.tpch_sf1.partsupp
on l_suppkey = ps_suppkey;Wrapping Columns in the WHERE Clause
While this issue is more challenging to identify from the query profile alone, it illustrates one the most important statistics available, the Partitions Scanned compared to Partitions Total.
Take the following SQL query as an example:
select o_orderpriority,
       sum(o_totalprice)
from  orders
where o_orderdate = to_date('1993-02-04','YYYY-MM-DD')
group by all;
The above query was completed in 667 milliseconds on an XSMALL warehouse and produced the following profile.
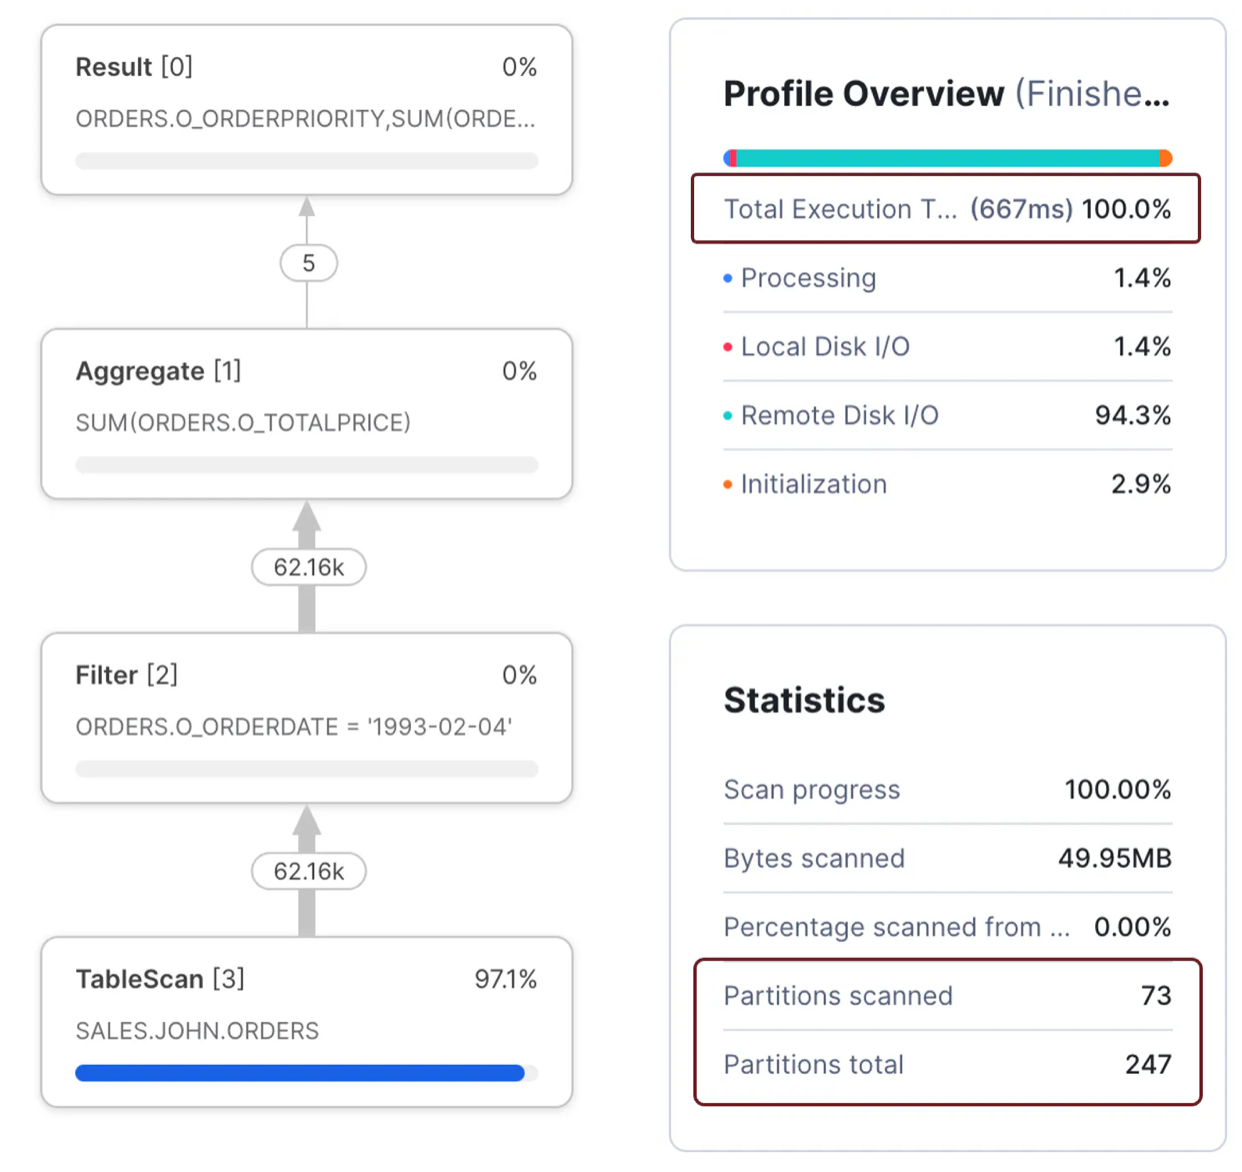
Notice the sub-second execution time and that the query only scanned 73 of 247 micro partitions. Compare the above situation to the following query, which took 7.6 seconds to complete - 11 times slower than the previous query to produce the same results.
select o_orderpriority,
       sum(o_totalprice)
from  orders
where to_char(o_orderdate, 'YYYY-MM-DD') = '1993-02-04'
group by all;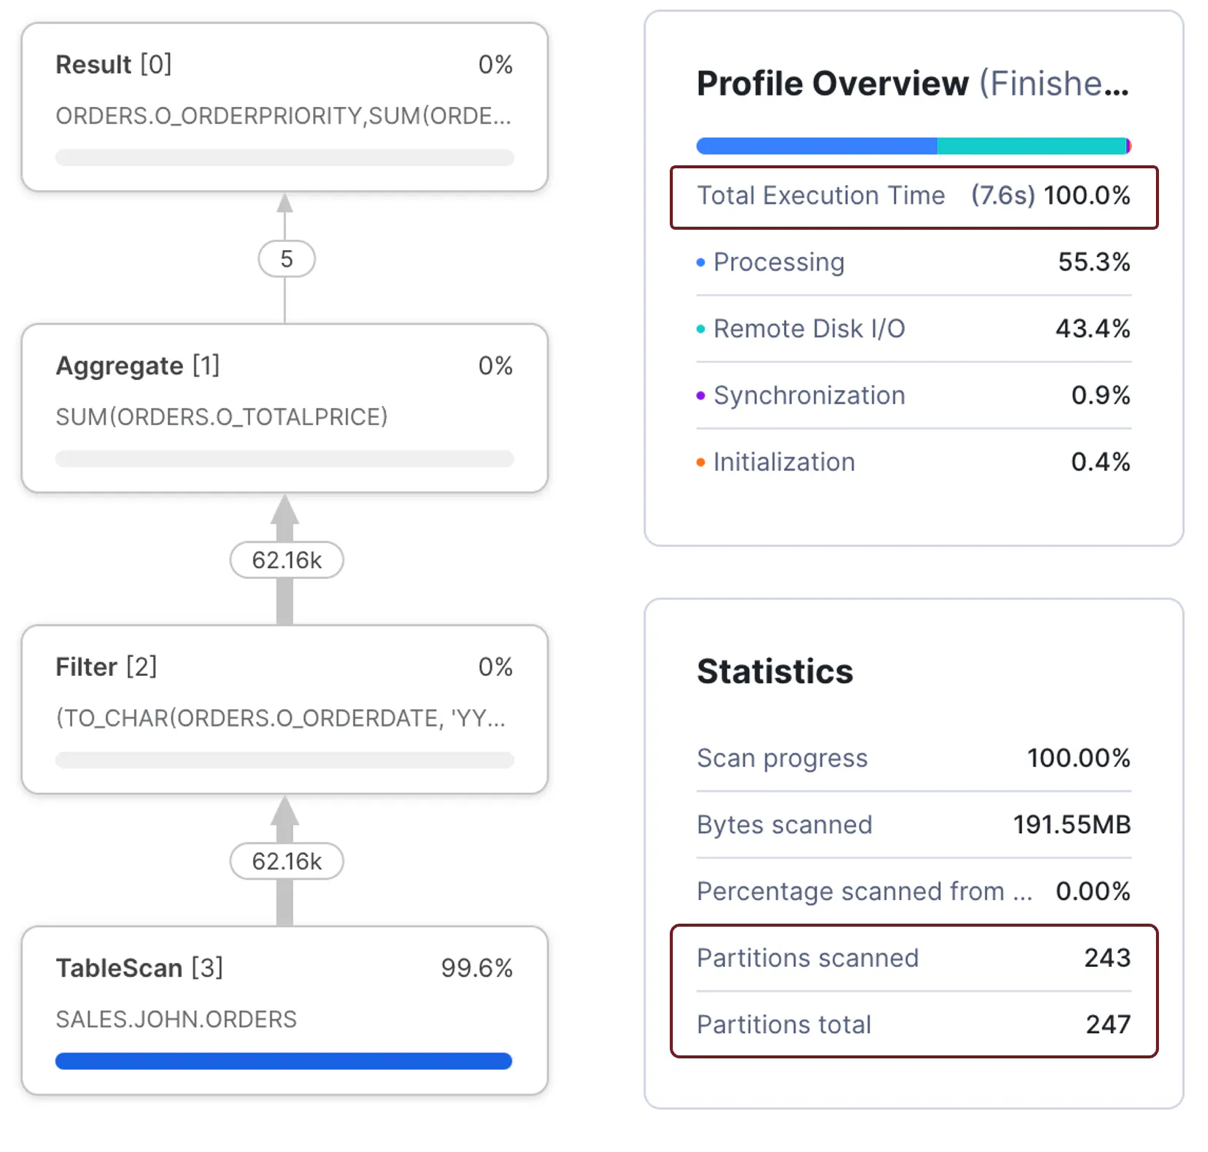
The screenshot above shows the second query was 11 times slower because it needed to scan 243 micro-partitions. The reason lies in the WHERE clause.
In the first query, the WHERE clause compares the ORDERDATE to a fixed literal. This meant that Snowflake was able to perform partition elimination by date.
where o_orderdate = to_date('1993-02-04','YYYY-MM-DD')In the second query, the WHERE clause modified the ORDERDATE field to a character string, which reduced Snowflake's ability to filter out micro-partitions. This meant more data needed to be processed which took longer to complete.
where to_char(o_orderdate, 'YYYY-MM-DD') = '1993-02-04'Therefore, the best practice is to avoid wrapping database columns with functions, especially not user-defined functions, which severely impact query performance.
Identifying Spilling to Storage in the Snowflake Query Profile
As discussed in my article on improving query performance by avoiding spilling to storage, this tends to be an easy-to-identify and potentially resolve issue.
Take, for example, this simple benchmark SQL query:
select ss_sales_price
from   snowflake_sample_data.TPCDS_SF100TCL.STORE_SALES
order by SS_SOLD_DATE_SK, SS_SOLD_TIME_SK, SS_ITEM_SK, SS_CUSTOMER_SK,
         SS_CDEMO_SK, SS_HDEMO_SK, SS_ADDR_SK, SS_STORE_SK,
         SS_PROMO_SK, SS_TICKET_NUMBER, SS_QUANTITY;
The above query sorted a table with 288 billion rows and took over 30 hours to complete on a SMALL virtual warehouse. The critical point is that the Query Profile Statistics showed that it spilled over 10 TB to local storage and 8 TB to remote storage. Furthermore, because it took so long, it cost over $183 to complete.
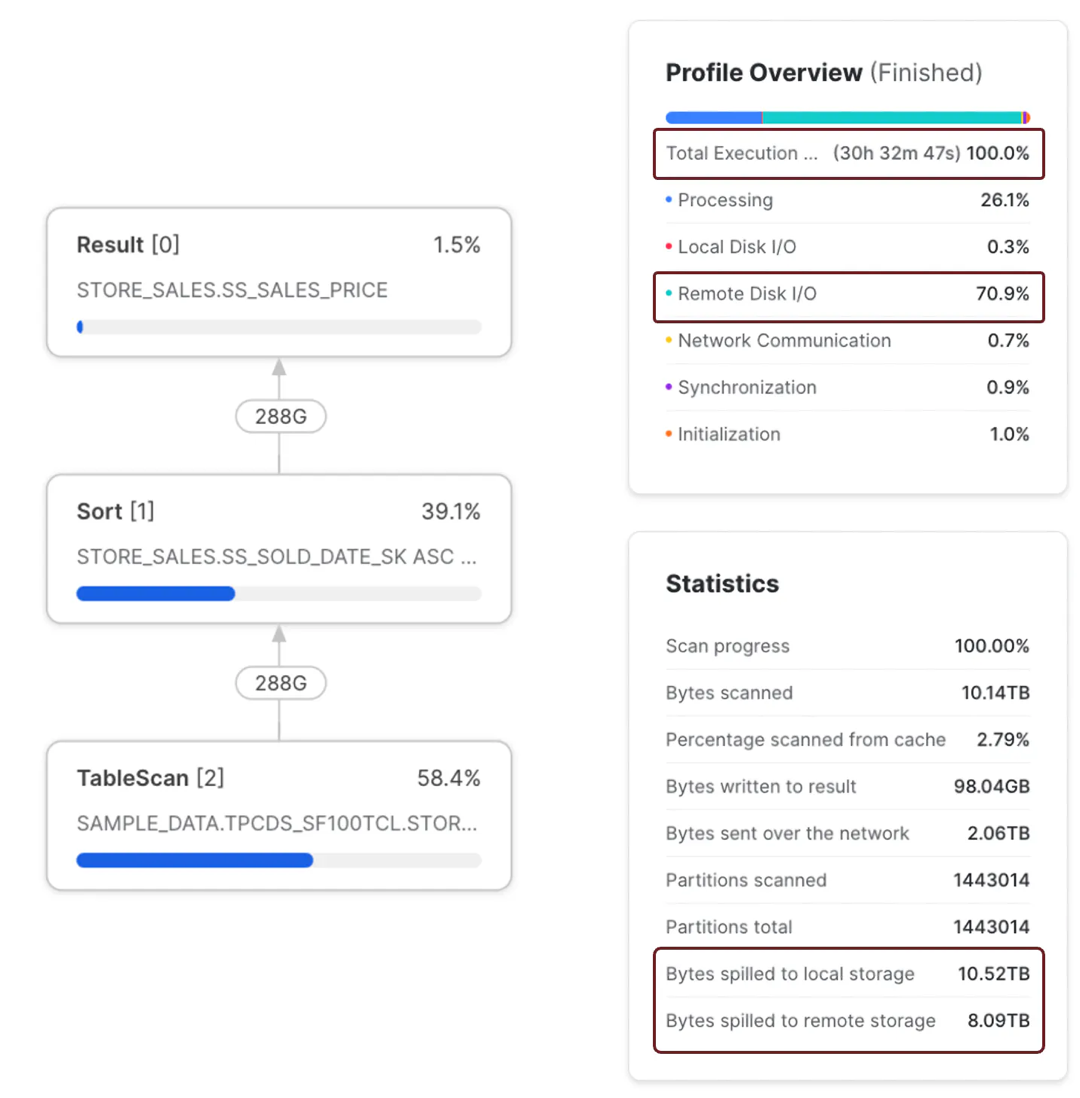
The screenshot above shows the query profile, execution time, and bytes spilled to local and remote storage. It's also worth noting that the query spent 70.9% of the time waiting for Remote Disk I/O, consistent with the data volume spilled to Remote Storage.
Compare the results above to the screenshot below. This shows the same query executed on an X3LARGE warehouse.
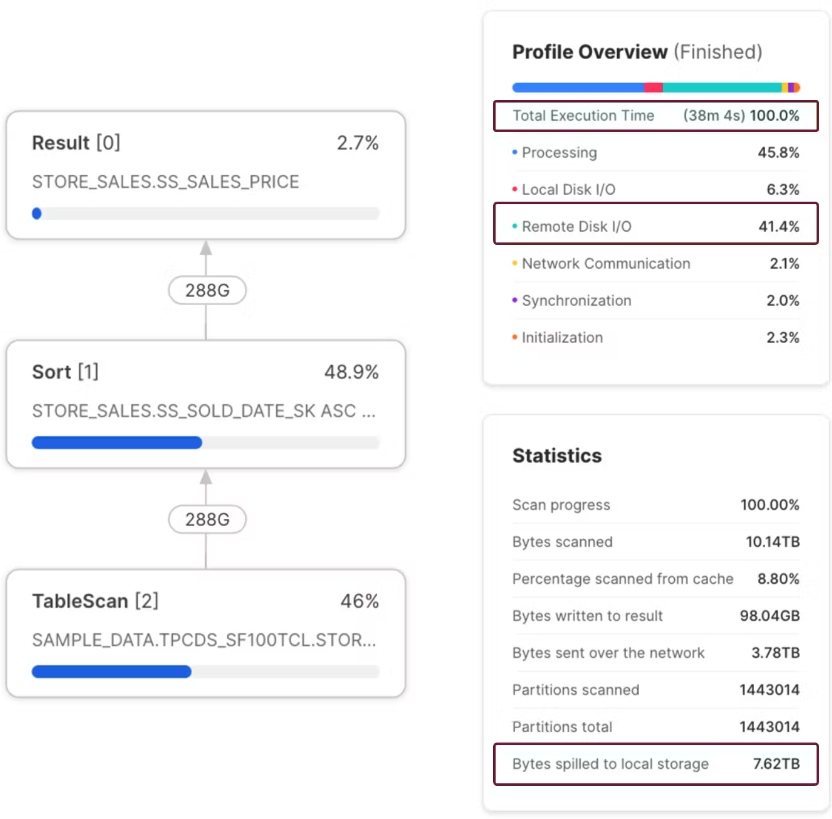
The Query Profile above shows that the query was completed in 38 minutes and produced no remote spilling. In addition to completing 48 times faster than on the SMALL warehouse also cost $121.80, a 66% reduction in cost. Assuming this query was executed daily, that would amount to an annual savings of over $22,000.
Conclusion
The example above illustrates my point in an article on controlling Snowflake costs. Snowflake Data Engineers and Administrators tend to put far too much emphasis on tuning performance. However, Snowflake has changed the landscape, and we need to focus on both maximizing query performance and controlling costs.
The task of managing cost while maximizing performance may seem at odds with each other, but using the Snowflake Query Profile and the techniques described in this article, there's no reason why we can't deliver both.
Published at DZone with permission of John Ryan, DZone MVB. See the original article here.
Opinions expressed by DZone contributors are their own.

Comments