How to Read Thread Dumps Easily and Efficiently
Learn how to capture and analyze thread dumps in Java to troubleshoot performance issues, identify bottlenecks, and optimize your application's performance.
Join the DZone community and get the full member experience.
Join For FreeThread dumps are vital artifacts for troubleshooting performance problems in production applications. When an application experiences issues like slow response times, hangs, or CPU spikes, thread dumps provide a snapshot of all active threads, including their states and stack traces, helping you pinpoint the root cause. While tools can automate thread dump analysis, you may still need to analyze them manually for a better understanding. This post outlines key patterns to look at when analyzing thread dumps.
How to Capture Thread Dump?
You can capture a Java thread dump using the jstack tool that comes with the Java Development Kit (JDK). To do so, run the following command in your terminal to generate a thread dump for the specific process:
jstack -l <process-id> > <output-file>Where:
- process-id: The process ID (PID) of the Java application whose thread dump you want to capture.
- output-file: The file path where the thread dump will be saved.
For instance:
jstack -l 5678 > /var/logs/threadDump.logThere are nine different methods to capture thread dumps. Depending on your security policies and system requirements, you can choose the one that best fits your environment.
Anatomy of a Thread Dump
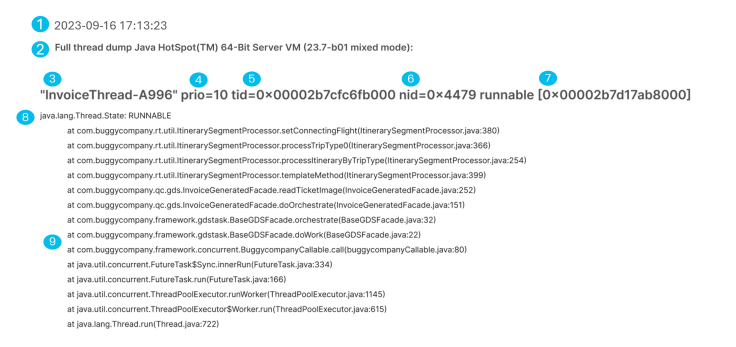
A thread dump contains several important details about each active thread in the JVM. Understanding these details is crucial for diagnosing performance issues.
Note that fields 1 and 2 apply to the overall JVM (such as the timestamp and version), while key details about each thread, like fields 3–9 (thread name, priority, Thread ID, Native ID, Address Space, State and stack trace), are repeated for every individual thread. Below is a breakdown of these essential fields:

| # | Field | Description |
|---|---|---|
| 1 | Timestamp | The date and time when the thread dump was captured, helping to correlate it with other logs or system events. |
| 2 | JVM Version | The version and configuration of the JVM, such as whether it’s 32-bit or 64-bit, and whether it’s running in client or server mode. |
| 3 | Thread Name | The name of the thread, which may be set using the Thread#setName() API. If not set, a default name like Thread-0 is used. |
| 4 | Priority | The priority of the thread, ranging from 1 (lowest) to 10 (highest). This helps the JVM suggest how the OS should schedule thread execution. |
| 5 | Thread ID | The unique identifier assigned to the thread by the JVM. Useful for tracking and identifying threads during analysis. |
| 6 | Native ID | The OS-assigned ID for the thread. This is useful when correlating thread activity with OS-level monitoring tools like top or pmap. |
| 7 | Address Space | The memory space in which the thread operates. While typically not needed for troubleshooting, this information is still included. |
| 8 | Thread State | The current state of the thread. Threads can be in states such as RUNNABLE, BLOCKED, WAITING, TIMED_WAITING, etc., indicating their activity at the time. |
| 9 | Stack Trace | The code execution path of the thread, showing the sequence of methods invoked, starting with the most recent method at the top and working backward. |
9 Tips for Reading Thread Dumps
In this section, let’s review the nine tips that will help you read and analyze thread dumps effectively.
1. Threads With Identical Stack Traces
Whenever there is a bottleneck in the application, multiple threads will get stuck on it. In such circumstances, all those threads that are stuck on the bottleneck will end up having the same stack trace. Thus, if you can group the threads that have the same stack trace and investigate the stack traces that have the highest count, it would help uncover the bottlenecks in the application.
Case Study
In a real-world incident at a major financial institution in North America, a slowdown in the back-end System of Record (SOR) caused several threads to share identical stack traces, indicating a bottleneck. By analyzing these threads, engineers pinpointed the issue and quickly resolved the JVM outage.
2. BLOCKED Threads
When a thread is in BLOCKED state, it indicates it’s stuck and unable to progress further. A thread will enter a BLOCKED state if some other thread has acquired the lock and didn’t release it. When a thread remains in a BLOCKED state for a prolonged period, customer transactions will slow down. Thus, when examining thread dumps, you need to identify all the BLOCKED state threads and find which threads have acquired those locks and didn’t release them.
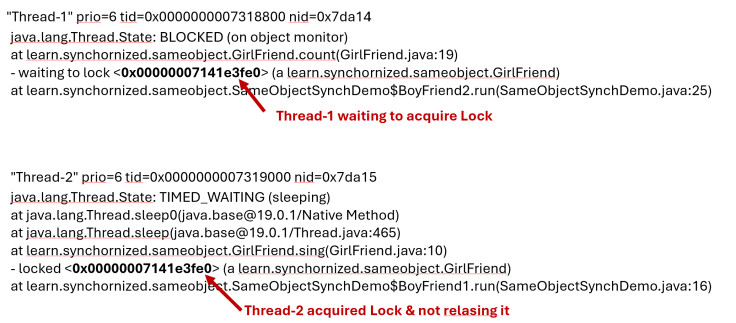
Below is the stack trace of a thread that is BLOCKED by another thread:

You can notice that Thread-1 is waiting to acquire the lock 0x00000007141e3fe0. On the other hand, Thread-2 acquired this lock and didn’t release it. Due to that, Thread-1 got into a BLOCKED state and couldn’t proceed further with execution.
Case Study
In a real-world scenario, 50 threads entered the BLOCKED state while calling java.util.UUID#randomUUID(), leading to application downtime. The threads were stuck because they were all waiting for a shared resource, causing a bottleneck that halted further progress. Resolving the issue involved identifying the root cause of the BLOCKED state and implementing solutions to ensure threads could proceed without being stuck, thereby restoring normal application operation.
3. CPU-Consuming Threads
One of the primary reasons engineers analyze thread dumps is to diagnose CPU spikes, which can severely impact application performance. Threads in the RUNNABLE state are actively executing and using CPU resources, which makes them the typical culprits behind CPU spikes. To effectively identify the root cause of CPU spikes, focus on analyzing threads in the RUNNABLE state and their stack traces to understand what operations they are performing. Stack traces can reveal if a thread is caught in an infinite loop, executing resource-intensive computations.
Note: The most precise method for diagnosing CPU spikes is to combine thread dump analysis with live CPU monitoring data. You can achieve this using the top -H -p <PROCESS_ID> command, which shows the CPU usage of each individual thread in a process. This allows you to correlate high-CPU-consuming threads from the live system with their corresponding stack traces in the thread dump, helping you pinpoint the exact lines of code responsible for the CPU spike.
4. Lengthy Stack Trace
When analyzing thread dumps, pay close attention to threads with lengthy stack traces. These traces can indicate two potential issues:
- Deep recursion
- Code consuming excessive CPU cycles
In cases of deep recursion, the stack trace often shows the same method appearing repeatedly, suggesting that a function is being called repeatedly without reaching a termination condition. This pattern could mean the application is stuck in a recursive loop, which may eventually lead to a StackOverflowError, cause performance degradation, or result in a system crash.
Lengthy stack traces can also be a sign of parts of the code that are consuming a high number of CPU cycles. Threads with deep call stacks may be involved in resource-intensive operations or complex processing logic, leading to increased CPU usage. Examining these threads can help you identify performance bottlenecks and areas in the code that need optimization.
In the example below, the stack trace shows repeated invocations of the start() method, indicating a potential infinite recursion scenario. The stack depth continues to increase as the same method is called repeatedly, lacking a proper base case or exit condition:
at com.buggyapp.stackoverflow.StackOverflowDemo.start(StackOverflowDemo.java:30)
at com.buggyapp.stackoverflow.StackOverflowDemo.start(StackOverflowDemo.java:30)
at com.buggyapp.stackoverflow.StackOverflowDemo.start(StackOverflowDemo.java:30)
at com.buggyapp.stackoverflow.StackOverflowDemo.start(StackOverflowDemo.java:30)
at com.buggyapp.stackoverflow.StackOverflowDemo.start(StackOverflowDemo.java:30)
at com.buggyapp.stackoverflow.StackOverflowDemo.start(StackOverflowDemo.java:30)
at com.buggyapp.stackoverflow.StackOverflowDemo.start(StackOverflowDemo.java:30)
at com.buggyapp.stackoverflow.StackOverflowDemo.start(StackOverflowDemo.java:30)
at com.buggyapp.stackoverflow.StackOverflowDemo.start(StackOverflowDemo.java:30)
at com.buggyapp.stackoverflow.StackOverflowDemo.start(StackOverflowDemo.java:30)
at com.buggyapp.stackoverflow.StackOverflowDemo.start(StackOverflowDemo.java:30)
:
:
:
5. Threads Throwing Exceptions
When your application encounters an issue, exceptions are often thrown to signal the problem. Therefore, while analyzing the thread dump, be on the lookout for the following exceptions or errors:
java.lang.Exception– General exceptions that can indicate a wide range of issues.java.lang.Error– Severe problems, such as OutOfMemoryError or StackOverflowError, which often signal that the application is in a critical state.java.lang.Throwable– The superclass of all exceptions and errors, sometimes used in custom error handling.
Remember that many enterprise applications use custom exceptions, such as MyCustomBusinessException, which can provide valuable insight into specific areas of your code. Pay close attention to these, as they can lead directly to business logic errors.
These exceptions reveal where the application is struggling, whether due to unexpected conditions, resource limitations, or logic errors. Threads throwing exceptions often point directly to the problematic code paths, making them highly valuable for root cause analysis. Here’s an example of a stack trace from a thread that’s printing the stack trace of an exception:
java.lang.Thread.State: RUNNABLE
at java.lang.Throwable.getStackTraceElement(Native Method)
at java.lang.Throwable.getOurStackTrace(Throwable.java:828)
- locked <0x000000079a929658> (a java.lang.Exception)
at java.lang.Throwable.getStackTrace(Throwable.java:817)
at
com.buggyapp.message.ServerMessageFactory_Impl.defaultProgramAndCallSequence(ServerMessageFactory_Impl.java:177)
at
com.buggyapp.message.ServerMessageFactory_Impl.privatCreateMessage(ServerMessageFactory_Impl.java:112)
at
com.buggyapp.message.ServerMessageFactory_Impl.createMessage(ServerMessageFactory_Impl.java:93)
at
com.buggyapp.message.ServerMessageFactory_Impl$$EnhancerByCGLIB$$3012b84f.CGLIB$createMessage$1(<generated>)
at
com.buggyapp.message.ServerMessageFactory_Impl$$EnhancerByCGLIB$$3012b84f$$FastClassByCGLIB$$3c9613f4.invoke(<generated>)
6. Compare Thread States Across Dumps
A thread dump provides a snapshot of all the threads running in your application at a specific moment. However, to determine if a thread is genuinely stuck or just momentarily paused, it’s crucial to capture multiple snapshots at regular intervals. For most business applications, capturing three-thread dumps at 10-second intervals is a good practice. This method helps you observe whether a thread remains stuck on the same line of code across multiple snapshots.
By taking three thread dumps at 10-second intervals, you can track changes (or lack thereof) in thread behavior. This comparison helps you determine whether threads are progressing through different states or remain stuck, which could point to performance bottlenecks.
Why Compare Multiple Thread Dumps?
Analyzing thread dumps taken over time allows you to detect patterns indicating performance issues and pinpoint their root causes:
- High-CPU Threads: Threads consistently in the RUNNABLE state across multiple dumps may consume excessive CPU resources. This often points to busy-waiting loops, high computational load, or inefficient processing within the application.
- Lock Contention: Threads frequently found in the BLOCKED state could indicate lock contention, where multiple threads compete for shared resources. In these cases, optimizing lock usage or reducing the granularity of locks may be necessary to improve performance.
- Thread State Transitions: Monitoring threads transitioning between states (e.g., from RUNNABLE to WAITING) can reveal patterns related to resource contention, such as frequent lock acquisitions or I/O waits. These transitions can help identify areas of the application that need tuning.
By comparing thread states across multiple dumps, you can gain a clearer picture of how your application behaves under load, allowing for more accurate troubleshooting and performance optimization.
7. Deadlock
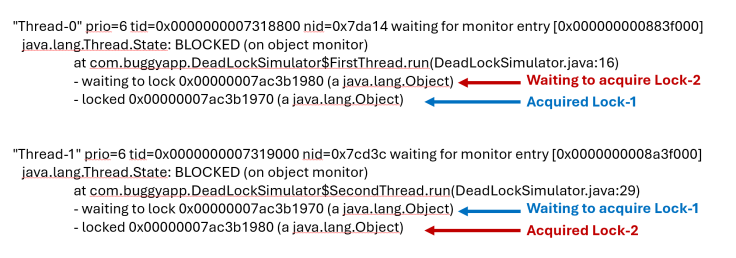
A deadlock happens when two or more threads are stuck, each waiting for the other to release a resource they need. As a result, none of the threads can move forward, causing parts of the application to freeze. Deadlocks usually occur when threads acquire locks in an inconsistent order or when improper synchronization is used. Here’s an example of a deadlock scenario captured in a thread dump:

From the stack trace, you can observe the following deadlock scenario:
- Thread-0 has acquired lock 0x00000007ac3b1970 (Lock-1) and is waiting to acquire lock 0x00000007ac3b1980 (Lock-2) to proceed;
- Meanwhile Thread-1 has already acquired lock 0x00000007ac3b1980 (Lock-2) and is waiting for lock 0x00000007ac3b1970 (Lock-1), creating a circular dependency.
This deadlock occurs because Thread-1 is attempting to acquire the locks in reverse order compared to Thread-0, causing both threads to be stuck indefinitely, waiting for the other to release its lock.
Deadlocks don’t just happen in applications; they can, unfortunately, occur in real-life marriages, too. Just like two threads in a program can hold onto resources and wait for the other to release them, partners in a marriage can sometimes get caught in similar situations. Each person might be waiting for the other to make the first move — whether apologizing after an argument, taking responsibility for a task, or initiating an important conversation. When both hold onto their position and wait for the other to act, progress stalls, much like threads in a deadlock, leaving the relationship in a stalemate. This stalemate, if unresolved, can leave both partners stuck in a cycle of frustration.
Case Study
In a real-world incident, an application experienced a deadlock due to a bug in the Apache PDFBox library. The problem arose when two threads acquired locks in opposite orders, resulting in a deadlock that caused the application to hang. To learn more about this case and how the deadlock was resolved, check out Troubleshooting Deadlock in an Apache Open-Source Library.
8. GC Threads
The number of Garbage Collection (GC) threads in the JVM is determined by the number of CPUs available on the machine, unless explicitly configured using the JVM arguments -XX:ParallelGCThreads, -XX:ConcGCThreads. On multi-core systems, this can result in a large number of GC threads being created. While more GC threads can improve parallel processing, having too many can degrade performance due to the overhead associated with increased context switching and thread management.
As the saying goes, “Too many cooks spoil the broth,” and the same applies here: too many GC threads can harm JVM performance by leading to frequent pauses and higher CPU usage. It’s important to check the number of GC threads in a thread dump to ensure they are appropriately tuned for the system and workload.
How to Identify GC Threads?
GC threads can typically be identified in a thread dump by their names, which often include phrases such as GC Thread#, G1 Young RemSet, or other GC-related identifiers, depending on the garbage collector in use. Searching for these thread names in a thread dump can help you understand how many GC threads are active and whether adjustments are needed.
Below is an excerpt from a thread dump showing various GC-related threads:
"GC Thread#0" os_prio=0 cpu=979.53ms elapsed=236.18s tid=0x00007f9cd4047000 nid=0x13fd5 runnable
"GC Thread#1" os_prio=0 cpu=975.08ms elapsed=235.78s tid=0x00007f9ca0001000 nid=0x13ff7 runnable
"GC Thread#2" os_prio=0 cpu=973.05ms elapsed=235.78s tid=0x00007f9ca0002800 nid=0x13ff8 runnable
"GC Thread#3" os_prio=0 cpu=970.09ms elapsed=235.78s tid=0x00007f9ca0004800 nid=0x13ff9 runnable
"G1 Main Marker" os_prio=0 cpu=30.86ms elapsed=236.18s tid=0x00007f9cd407a000 nid=0x13fd6 runnable
"G1 Conc#0" os_prio=0 cpu=1689.59ms elapsed=236.18s tid=0x00007f9cd407c000 nid=0x13fd7 runnable
"G1 Conc#1" os_prio=0 cpu=1683.66ms elapsed=235.53s tid=0x00007f9cac001000 nid=0x14006 runnable
"G1 Refine#0" os_prio=0 cpu=13.05ms elapsed=236.18s tid=0x00007f9cd418f800 nid=0x13fd8 runnable
"G1 Refine#1" os_prio=0 cpu=4.62ms elapsed=216.85s tid=0x00007f9ca400e000 nid=0x14474 runnable
"G1 Refine#2" os_prio=0 cpu=3.73ms elapsed=216.85s tid=0x00007f9a9c00a800 nid=0x14475 runnable
"G1 Refine#3" os_prio=0 cpu=2.83ms elapsed=216.85s tid=0x00007f9aa8002800 nid=0x14476 runnable
9. Idle Threads in a Thread Pool
In many applications, thread pools may be over-allocated, meaning more threads are created than necessary to handle the workload. This over-allocation often results in many threads being in a WAITING or TIMED_WAITING state, where they consume system resources without doing any useful work. Since threads occupy memory and other resources, excessive idle threads can lead to unnecessary resource consumption, increasing memory usage and even contributing to potential performance issues.
When analyzing thread dumps, look for threads in WAITING or TIMED_WAITING states within each thread pool. If you notice a high count of such threads, especially compared to the number of active or RUNNABLE threads, it may indicate that the thread pool size is too large for the application’s current load.
Best Practices
- Adjust thread pool sizes dynamically: Consider implementing dynamic thread pool sizing, where the pool can grow or shrink based on the workload. Using techniques like core and maximum thread pool sizes can help manage resources more efficiently.
- Monitor thread usage regularly: Regularly review thread usage patterns, especially during peak load times, to ensure that the thread pool size aligns with actual needs.
Optimizing the number of threads in a pool can help reduce memory consumption, lower CPU context switching overhead, and improve overall application performance.
Conclusion
Analyzing thread dumps is an essential skill for diagnosing performance bottlenecks, thread contention, and resource management issues in Java applications. With the insights gained from thread dumps, you are better equipped to optimize your application’s performance and ensure smooth operation, especially in production environments.
Published at DZone with permission of Ram Lakshmanan, DZone MVB. See the original article here.
Opinions expressed by DZone contributors are their own.

Comments