How to Properly Plan JVM Performance Tuning
Check out this guide to JVM performance tuning.
Join the DZone community and get the full member experience.
Join For FreeJVM performance tuning involves trade-offs between many aspects and one single aspect may greatly influence the overall performance. Therefore, it is required to comprehensively consider all possible influences. Understanding and following some basic principles and theories will make performance tuning a lot easier. To obtain a better understanding of the content of this article, you must meet the following prerequisites:
- Understand the JVM garbage collector
- Be familiar with the common tools for JVM performance monitoring
- Have the ability to read GC logs
- Perform tuning only when necessary and practical (JVM performance tuning cannot solve all performance problems)
If you are not familiar with the preceding content, you are recommended to read them up before proceeding with this article.
This article explains JVM performance tuning and shows how to perform application tuning by using parameters of a JVM. This article mainly involves the following content:
- General procedures of JVM tuning
- Key performance metrics of JVM tuning
- Important JVM tuning principles
- Tuning policies and examples
Performance Tuning Layers
To improve system performance, we need to optimize the system from various perspectives and layers.
In addition to JVM tuning, many other layers need to be optimized. Tuning a system does not only include JVM tuning. Instead, the overall tuning of systems is required to improve the system performance. This article only describes JVM tuning. Other tuning aspects will be discussed later.
Before the JVM tuning, assume that the architecture and code of a project have been tuned or are the optimal architecture and code for the current project. These two assumptions are the base of JVM tuning and architecture tuning has the most significant impact on the system performance. We cannot expect a qualitative leap from an application that has a defective architecture or requires relentless code optimization by only performing JVM tuning.
In addition, before the tuning begins, we need to have clear performance optimization goals and know the current performance bottlenecks. To optimize bottlenecks, we need to perform stress and benchmark tests on an application and use a variety of monitoring and statistics tool to confirm if an optimized application meets the desired goals.
JVM Tuning Procedure
The final goal of tuning is to make an application have a larger throughput at the lowest cost of hardware consumption. JVM tuning is no exception. JVM tuning mainly involves optimizing the garbage collector for better collection performance so that applications running on VMs can have a larger throughput while using less memory and experiencing lower latency. Note that less memory/lower latency does not necessarily mean that the less/lower the memory/latency is, the better the performance is. It is about the optimal choice.
Performance Metrics
To find and evaluate performance bottlenecks, we need to know some definitions of performance metrics. For JVM tuning, we need to know the three following definitions and use these metrics as our base of evaluation:
- Throughput: It is one of the important metrics. Throughput refers to the highest possible performance that the garbage collector allows applications to achieve, without considering the pause time or memory consumption caused by garbage collection.
- Latency: Latency measures how much pause time resulting from garbage collection is reduced to avoid application vibrations during the running process.
- Memory usage: It refers to the amount of memory required for the garbage collector to run smoothly.
Performance gains of any of the three attributes is almost at the cost of the performance loss of the other one or two attributes. The application business requirements determine how important one or two attributes are to an application.
Performance Tuning Principles
During the tuning process, the three following principles can help us implement easier garbage collection tuning to meet desired application performance requirements.
- Minor GC collection principle: Each time Minor GC should collect as many garbage objects as possible to reduce the frequency of Full GC for an application.
- GC memory maximization principle: When solving throughput and latency problems, the larger the memory used by the garbage collector, the more efficient the garbage collection and the smoother the application.
- GC tuning "two out of three" principle: We should only tune two of the three performance attributes instead of all the three attributes: throughput, latency, and memory usage.
Performance Tuning Procedure
JVM tuning involves continuous configuration optimizations and multiple iterations based on the performance test results. Before each desired system metric is met, each of the previous steps may experience multiple iterations. In some cases, to meet a specific metric, the previous parameters may need to be tuned many times, requiring all the previous steps to be tested again.
In addition, tuning generally starts with meeting the memory usage requirement of applications, then latency and throughput. Tuning should follow this sequence of steps. We cannot invert the sequence of these tuning steps. The following sections will use an example to elaborate on each tuning step.
For running JVMs, we directly select the Server mode, which is the officially recommended mode after JDK 1.6.
We use the default parallel collector in JDK 1.6-1.8 as the garbage collector. (Use parallelGC for the young generation and parallelOldGC for the old generation.)
Determine Memory Usage
Before determining memory usage, we need to know two things:
- Application operation phases
- JVM memory allocation
Operation Phase
I divide the operation of an application into the three following phases:
- Initialization: A JVM loads an application and initializes the main modules and data of the application.
- Stability: The application has been running for a long time and has received a stress test. Each performance parameter is in a stable state. The core functions have been executed and warmed up by using JIT compilation.
- Summary: In the final summary phase, some benchmark tests are conducted to generate corresponding reports. We do not have to pay attention to this phase.
Memory usage and the size of the active data should be determined in the application stability phase instead of during the project start-up stage. Before explaining how to determine memory usage, let's look at JVM memory allocation first.
JVM Memory Allocation and Parameters

The main JVM heap space consists of the young generation, the old generation, and the permanent generation. The young generation size, the old generation size, and the permanent generation size make up the total heap size. Specific object promotion methods are not discussed here. Now, let's look at how the following JVM commands specify the heap size. If the following parameters are not used to specify the heap size, a virtual machine will automatically select a proper value, which may be automatically adjusted based on the system overhead.
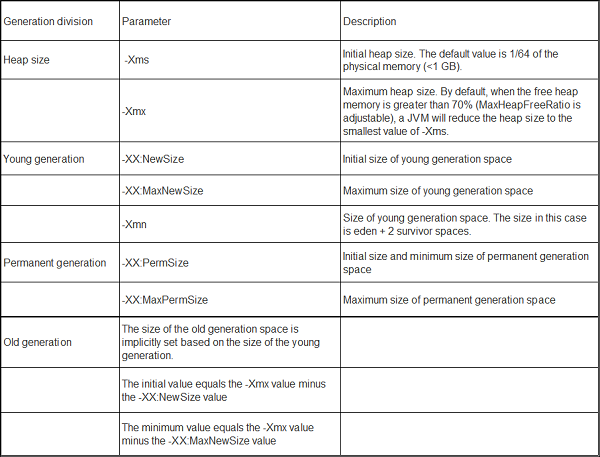
If the performance overhead is a concern, set the initial size and the maximum size of the permanent generation to the same value whenever possible, because only FullGC can implement the size adjustment for the permanent generation.
Calculate the Size of the Active Data
To calculate the size of the active data, follow these procedures:
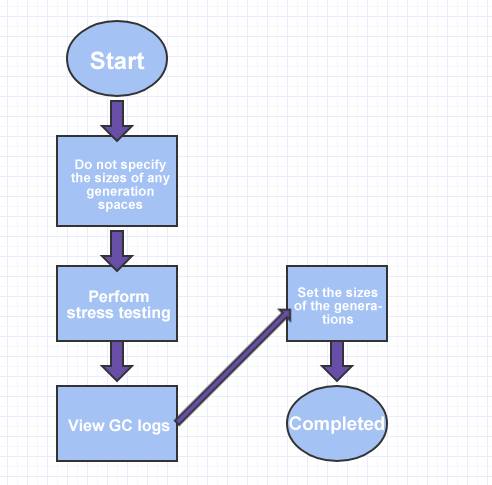
As previously mentioned, the active data size should be measured by how much space of a Java heap is occupied by the data that has been in the active state for a long time since the beginning of the application stability phase.
Be sure to meet the following requirements when calculating the active data size:
- Instead of setting start-up parameters manually, use the default JVM parameters when performing the test.
- Make sure that the application is in a stable state when Full GC occurs.
Using the default JVM start-up parameters is for the purpose of observing the required memory usage when the application is in the stable phase.
When Is an Application in the Stable Phase?
After enough stress is exerted, an application is in the stable phase only when it reaches a workload that meets the business requirements at the business peak in the production environment and stays stable after the peak is reached. Therefore, to determine if an application reaches a stable phase, stress testing is essential. How to perform stress testing on applications is not within the scope of this article. This question will be explained in a separate article later.
After determining that an application is in the stable phase, pay attention to the GC log of the application, especially the Full GC log.
GC log directive: -XX:+PrintGCTimeStamps -XX:+PrintGCDetails -Xloggc:<filename>GC logs are the best way to collect the information required for optimization. Even in the production environment, we can enable GC logs to locate problems. Enabling GC logs has minimal impact on performance while providing rich data.
A FullGC log is required. If no FullG logs are available, use monitoring tools to enforce a call or use the following command to trigger the log.
jmap -histo:live pidWe can obtain the following information when Full GC is triggered in the stable phase:
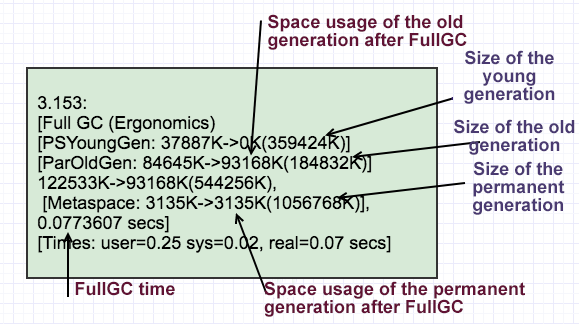
From the preceding GC log, we can roughly estimate the heap usage and GC time of the entire application during full GC. To get a more accurate estimation, collect information several times and find the average value. Or, use the longest FullGC for estimation.
In the preceding figure, after the full GC, 93168 KB (around 93 MB) of the old generation space is occupied. This volume of data is considered as the active data in the old generation space.
Other heap spaces are allocated by using the following rules.
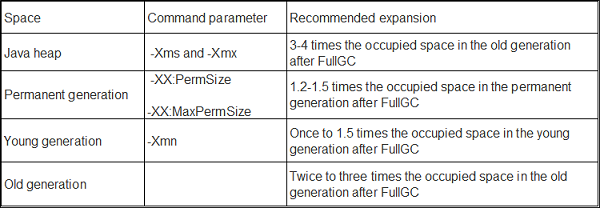
Based on the preceding rules and the FullGC information in the preceding figure, the heap spaces of the application can be planned as follows:
Java heap space: 373 MB = 93168 KB (old generation space) × 4
Young generation space: 140 MB = 93168 KB (old generation space) × 1.5
Permanent generation space: 5 MB = 3135 KB (Permanent generation space) × 1.5
Old generation space: 233 MB = 373 MB (heap space) - 140 MB (Young generation space)
The corresponding application startup parameter should be:
java -Xms373m -Xmx373m -Xmn140m -XX:PermSize=5m -XX:MaxPermSize=5mLatency Tuning
After determining the active data size of the application, we need to perform latency tuning. Because, at this point, the heap memory size and latency cannot meet the application requirements, we need to debug the application based on the actual requirements of the application.
In this phase, we may need to optimize the heap size configuration again, evaluate GC duration and frequency, and decide whether it is necessary to switch to a different garbage collector.
System Latency Requirements
Before tuning, we need to know what the system latency requirements are and which metrics can be tuned for latency.
- Acceptable average downtime of an application: This time will be compared with the measured Minor GC duration.
- Acceptable Minor GC frequency: The Minor GC frequency will be compared with the tolerable value.
- Acceptable maximum pause time: The maximum pause time will be compared with the FullGC duration in the worst case.
- Acceptable occurrence frequency of maximum pause: This is basically the frequency of FullGC.
Among the preceding metrics, pay special attention to the average downtime and the maximum pause time. The two metrics are of great importance to the user experience.
Based on the aforementioned requirements, we need to obtain the following data:
- MinorGC duration
- Number of MinorGCs
- The longest duration of FullGC
- FullGC frequency in the worst case
Optimize the Young Generation Size

For example, in the preceding GC log, the average duration of Minor GC is 0.069 seconds and MinorGC happens once every 0.389 seconds.
If the average downtime is set to 50ms, and the current duration (69ms) is obviously too long and requires adjustment.
We know that the larger the young generation space, the longer the Minor GC duration and the lower the frequency.
To shorten the duration, we need to reduce the size of the young generation space.
To reduce the frequency, we need to increase the size of the young generation space.
To minimize the impact on other sections due to changes in the young generation size, remain the original size of the old generation space if possible when you change the size of the young generation space.
For example, if the size of the young generation space is reduced by 10 percent, the size of the old generation space and the permanent generation space should not be changed. The following is the parameters after the optimization in this step:
java -Xms359m -Xmx359m -Xmn126m -XX:PermSize=5m -XX:MaxPermSize=5m

The size of the young generation is changed from 140 MB to 126 MB; the heap size is changed accordingly; the old generation has no changes at this point.
Optimize the Size of the Old Generation
Like the previous step, we also need to obtain some data from the GC log before the optimization. In this step, we focus on FullGC duration and frequency.
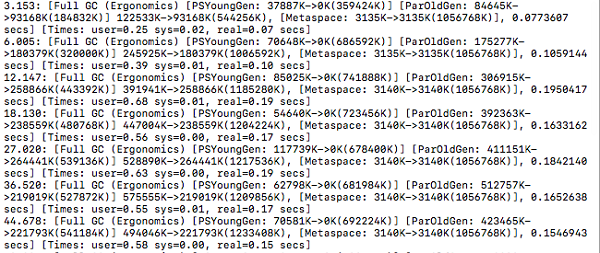
We can obtain the following information from the preceding figure:
The average FullGC frequency is 1 FullGC every 5.8s.

The average FullGC duration is 0.14s.

(This is only a test. FullGC lasts longer in real projects.)
Object Promotion Rate
Can we perform evaluation if we do not have a FullGC log? We can use the promotion rate for evaluation.
For example, in the preceding startup parameter, the size of the old generation is 233 MB.
How long it takes to occupy the available 233 MB space depends on the promotion rate from the young generation to the old generation.
Promoted usage of the old generation = Java heap usage after each MinorGC - young generation usage after MinorGC
Object promotion rate = average value (promoted old generation usage each time)/old generation space
With the object promotion rate, we can calculate the number of minorGCs required to occupy the space of the old generation and the rough duration of one fullGC.
Example:
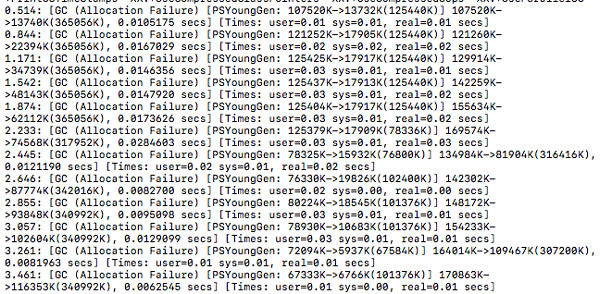
The preceding figure shows the following information:
After the first minor GC, the usage of the old generation space is 8 KB (13740 KB - 13732 KB).

After the second minor GC, the usage of the old generation space is 4489 KB (22394 KB - 17905 KB).

After the third minor GC, the usage of the old generation space is 16822 KB (34739 KB - 17917 KB).

After the fourth minor GC, the usage of the old generation space is 30230 KB (48143 KB - 17913 KB).

After the fifth minor GC, the usage of the old generation space is 44195 KB (62112 KB - 17917 KB).
The promoted usage of the old generation after each minor GC
Between the second and the first minorGCs: 4481 KB

Between the third and the second minorGCs: 12333 KB

Between the fourth and the third minorGCs: 13408 KB

Between the fifth and the fourth minorGCs: 13965 KB
After the calculation, we can obtain the following information:
The average usage promotion for each minorGC is 12211 KB (about 12 MB).

In the preceding figure, the minorGC happens once every 213ms on average.

Promotion rate = 12211 KB/213ms = 57 KB/ms

It takes about 4.185s (233*1024/57 = 4185ms) to fully occupy 233 MB of the old generation space.
The two preceding methods can be used to estimate the worst Full GC frequency. We can adjust the Full GC frequency by changing the size of the old generation. If a Full GC lasts too long and cannot meet the lowest latency requirement for an application, we need to switch the garbage collector. The next article will elaborate on how to switch to a different garbage collector (for example, switch to current-mark-sweep, CMS). Tuning CMS is slightly different.
Throughput Tuning
After the preceding tuning steps, finally, we come to the last tuning step. In this step, we perform a throughput test on the preceding result and make some fine-tuning.
Throughput tuning is mainly based on the throughput requirement of an application. An application should have a comprehensive throughput metric, which is derived from the overall application requirements and tests. When the application throughput reaches or exceeds the expected throughput goal, we can end the tuning.
If the application throughput goal still cannot be reached after optimization, we need to review the throughput requirement and assess how much the gap between the current throughput and the goal is. If the gap is around 20 percent, we can modify the parameters, increase the memory, then re-debug the application again. If the gap is too huge, we need to consider whether the design and the throughput goal are consistent from the perspective of the entire application and re-assess the throughput goal.
For a garbage collector, the goal of throughput tuning is to reduce or avoid the occurrence of Full GC or Stop-The-World CMS. Both of the two garbage collection methods can lead to reduced application throughput. Try to recycle as many objects as possible in the MinorGC phase to prevent objects from being promoted too quickly to the old generation.
Conclusion
Plumbr conducted a survey on the usage of specific garbage collectors based on 84,936 cases. Among the 13 percent of cases where garbage collectors are explicitly specified, the concurrent-mark-sweep (CMS) collector is the most frequently used collector. However, an optimal garbage collector is not selected in the majority of these cases. This majority of the cases account for around 87 percent.
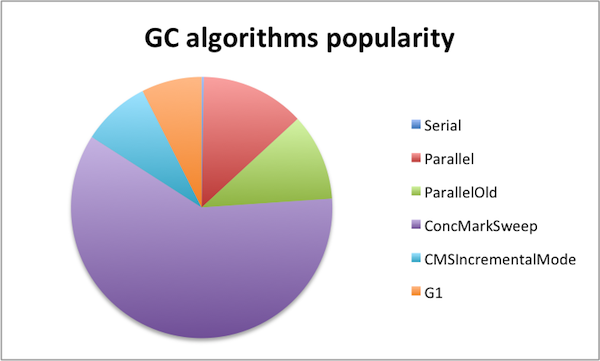
JVM tuning is a systematic and complex task. At present, the automatic adjustment under JVMs is very excellent and basic initial parameters can ensure that common applications runs stably. For some teams, application performance may not take a high priority. In this case, the default garbage collector is usually adequate enough to meet the desired requirement. Tuning should be based on your own situation.
Published at DZone with permission of Leona Zhang. See the original article here.
Opinions expressed by DZone contributors are their own.

Comments