Java Memory Consumption in Docker and How We Employed Spring Boot
If your Docker container is consuming far too much memory to achieve optimal performance, read on to see how one team found a solution.
Join the DZone community and get the full member experience.
Join For FreeRecently the team of which I'm a member faced an issue with deploying our microservices (Java+SpringMVC in Docker on AWS). The main problem was, that our pretty lightweight application consumed too much memory. As a result, we figured out many tricky moments about Java in Docker regarding memory and found the way to decrease its consumption via refactoring and migration to Spring Boot. The results of this work were pretty fascinating, and I decided to share them with you. Enjoy.
Before deployment, as devs with common sense, we decided to estimate how much memory our application would consume. To that end, we formulated a clear and easy equation to find the RSS:
RSS = Heap size + MetaSpace + OffHeap sizeHere OffHeap consists of thread stacks, buffers, libraries (*.jars), and the JVM code itself.
Resident Set Size is the amount of RAM currently allocated to and used by a process. It includes the code, data, and shared libraries.
Let's find it according to local Java VisualVM values:
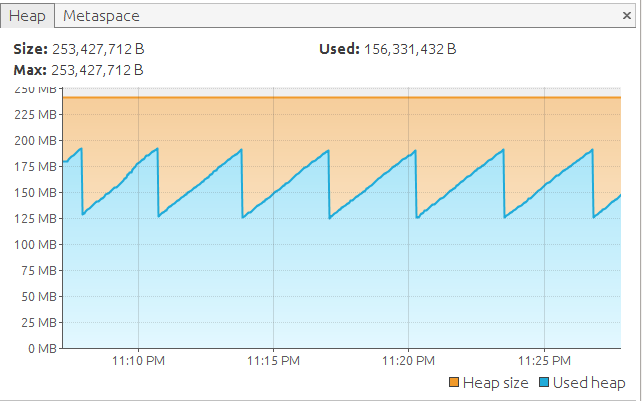
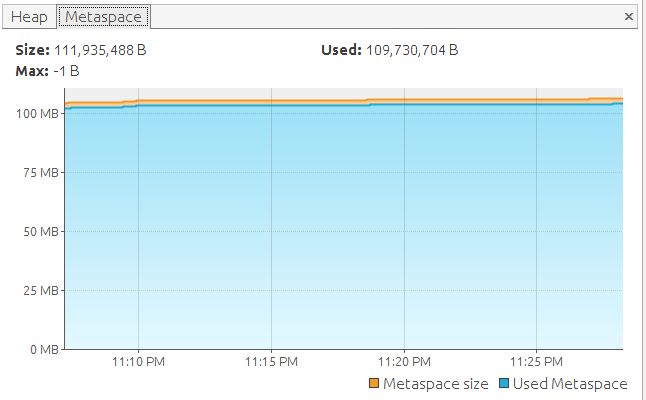
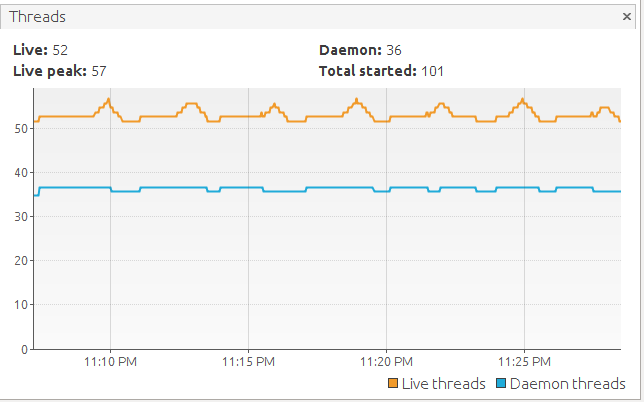
RSS = 253(Heap) + 100(Metaspace) + 170(OffHeap) + 52*1(Threads) = 600Mb (max avarage)... seems like we will have a beer soon.
So, we got the result: presumably, 600Mb will be enough. We picked a t2.micro AWS instance (with 1Gb RAM) for deployment and started to deploy our app. First of all, I want to give some information regarding our memory configuration via JVM options:
-XX:MinHeapFreeRatio=10 \
-XX:MaxHeapFreeRatio=70 \
-XX:CompressedClassSpaceSize=64m \
-XX:ReservedCodeCacheSize=64m \
-XX:MaxMetaspaceSize=256m \
-Xms256m \
-Xmx750m \
Also, as a base image for our app, we chose jetty:9-alpine, because we found it to be one of the most lightweight images for Java *.wars in Jetty.
As I've mentioned, it appeared that 600Mb would be enough, so a container was launched with the following memory limit:
docker run -m 600mAnd what do you think happened then? Our container was killed by a DD (Docker daemon), due to a memory shortage. It was really surprising because this container has been launched locally with the exact same parameters (it can be a separate topic for discussion). By increasing container's memory limit Step by step, we got up to 700... I'm joking, we got 850Mb.
Really?
After some observation and reading of useful articles, we decided to take some measurements. The results were very strange and controversial.
The Heap Size was the same as our previous (local) launch:

But Docker showed some crazy stats:

What Is Going on, Guys? The Situation Became Very Confusing...
We spent a lot of time looking for an explanation for these controversial numbers and found that we are not alone. After reading a few more sources and analyzing the application with Native Memory Tracker we got closer to the answer. I can summarize. Most of the extra memory has been used for storing compiled classes and their metadata. And what about controversial numbers of JavaVM/Docker stats, you ask? Good question. It turns out that Java VisualVM doesn't know anything about OffHeap, and, as a result, it can be very tricky to investigate your Java application's memory consumption using this tool. Also, it's crucial to understand the JVM options you use. As for me, it was the discovery that specifying -Xmx=512m tells the JVM to allocate a 512mb heap. It’s not telling the JVM to limit its entire memory usage to 512mb. There are code caches and all sorts of other off heap data. For specifying total memory, you should use the -XX:MaxRAM parameter. Be aware that with MaxRam=512m your heap will be approximately 250mb. Be careful and pay attention to your app JVM options.
Monday morning. Searching for a panacea...
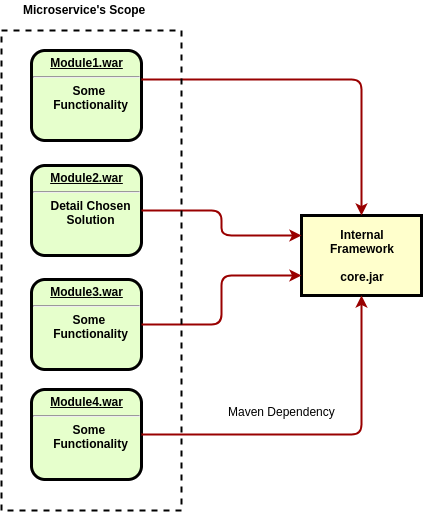
NMT and Java VisualVM Memory Sampler helped us found that our internal core framework was duplicated as a dependency in a memory multiple times. And the quantities of duplicates were equal to the count of submodules in our microservice. To get a better grasp of this, I want to illustrate our "microservice" structure:
And here is the snapshot from NMT (on my local machine) for one module (with 73MB loaded class metadata, 42MB threads, and 37MB of code including libs):
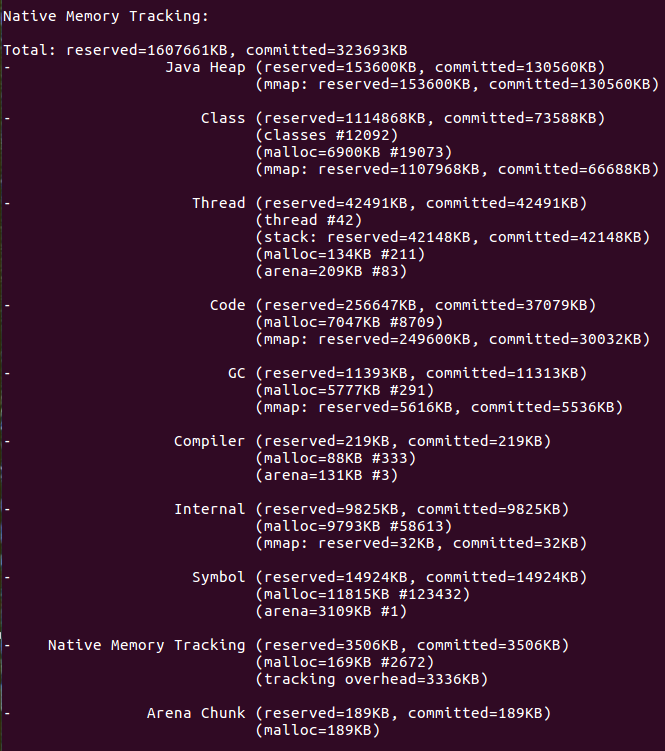
And as far as we can understand, it was the big mistake to build our application in such a way. First of all, every *.war has been deployed as a separate application in a Jetty servlet container, which is very strange, I agree, because microservice, by definition, should be the one application for deployment (deployment unit). Secondly, Jetty holds all required libs for every *.war separately in memory, even if all of these libraries have the same versions. As a result, DB connections, various base functionalities from the core framework, etc., were duplicated in memory.
A common sense solution was refactoring and making our app a true microservice. Besides, we doubted that we would need a full pack of Jetty, a fortiori, I think, that you heard this famous quote:
"Don't deploy your application in Jetty, deploy Jetty in your application.”
We decided to try Spring Boot with embedded Jetty, as it seemed to be the most used tool for standalone applications, particularly in our case. Few configurations, no XML, every Spring Framework advantage and a lot (A LOT) of plugins, which auto-configure themselves. There is a great deal of practical tutorials and articles showing how to use it over the internet. Why not? Sounds like a good choice.
Also, as we didn't need separate Jetty application server anymore, we changed our base Docker image to simple lightweight OpenJDK.
openjdk:8-jre-alpineThen, we refactored our application according to new requirements. At the end of the day we got something like:
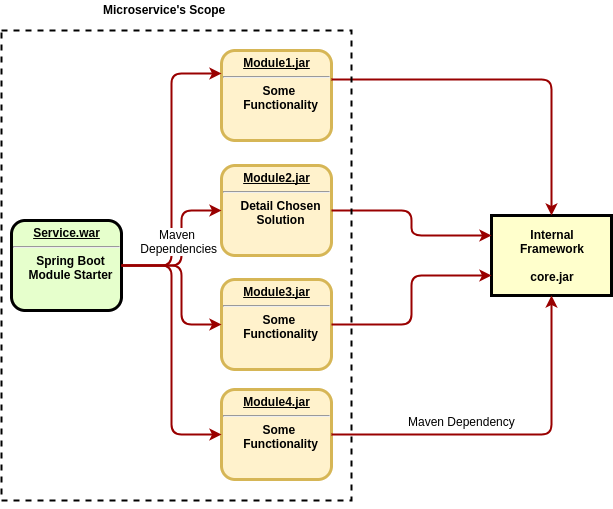
Appears that everything is ready. Time for experimentation.
Keeping the Intrigue...
Let's take measurements from our Java VirtualVM.
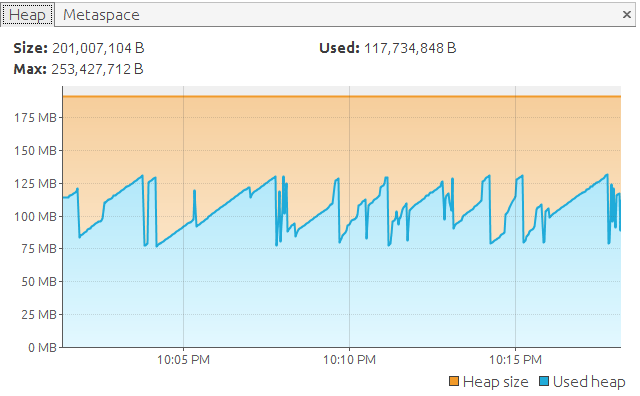
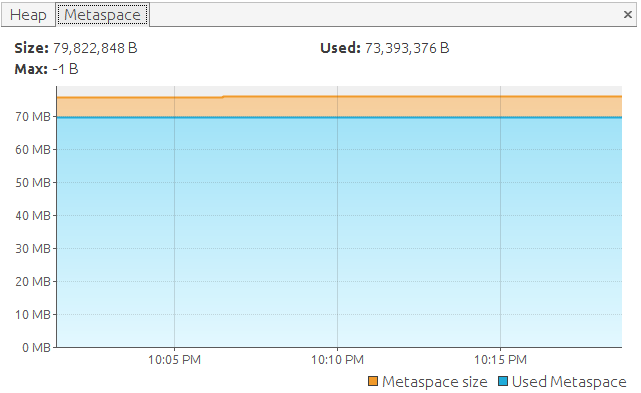
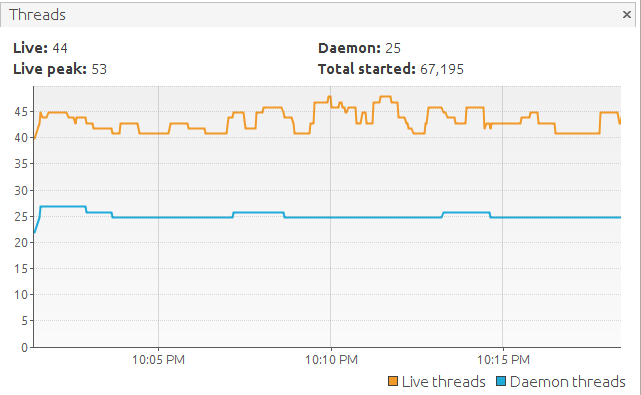
Hmm. Looks like we made an improvement, but not so big compared to all the effort and the results from previous versions of the application:

But let's take a look at the Docker stats:

Hooray! We've halved our memory consumption.
Conclusions
It was a good and interesting challenge for our team. Trying to find out the root cause of broken things can lead you to truly curious facts and make your vision of some particular area deeper and wider. Trust the Internet community, because often we are trying to solve a problem which has already been solved; you just have to know how to find the solution. Also, do not fully trust memory consumption estimation from Java VisualVM, be careful with it.
There is a very good analysis of Java memory usage in Docker containers, where you can find legible explanations and details on how it works. I strongly recommend reading this article, which will give you a deep understanding of Java memory allocation in a container. Also, I recommend taking a look at this one too. You will probably find answers to some of your questions regarding Java+Memory in Docker.
What else can I say here? Read more, improve more, investigate more, avoid routine, automate as much as possible, and, as a result, you will work less but more effectively.
Hope you'll find this helpful. Feel free to share your feedback or questions in the comments below.
Opinions expressed by DZone contributors are their own.

Comments