How to Capture Heap Dump From an Android App
Capture heap dumps from your Android app to diagnose memory leaks and other problems in order to optimize memory usage.
Join the DZone community and get the full member experience.
Join For FreeHeap dumps are vital artifacts to diagnose memory-related problems such as memory leaks, garbage collection problems, and java.lang.OutOfMemoryError. They are also vital artifacts to optimize memory usage.
In this article, we have given a few different options to capture heap dumps from Android apps. Once you have captured heap dumps, you can use great tools like HeapHero and Android Studio’s heap analyzer to analyze heap dumps.
1. Memory Profiler
Below are the steps to capture heap dumps from Memory Profiler in Android studio:
a. Run the app and select the device you want to profile from Android Studio.
b. In your Android studio, click on View >> Tool Windows >> Android Profiler

c. There will be a Memory timeline, which would be below the CPU timeline, but above the Network timeline. In this memory timeline, click on the download button (highlighted in the below image) to generate heap dump from the Android app.

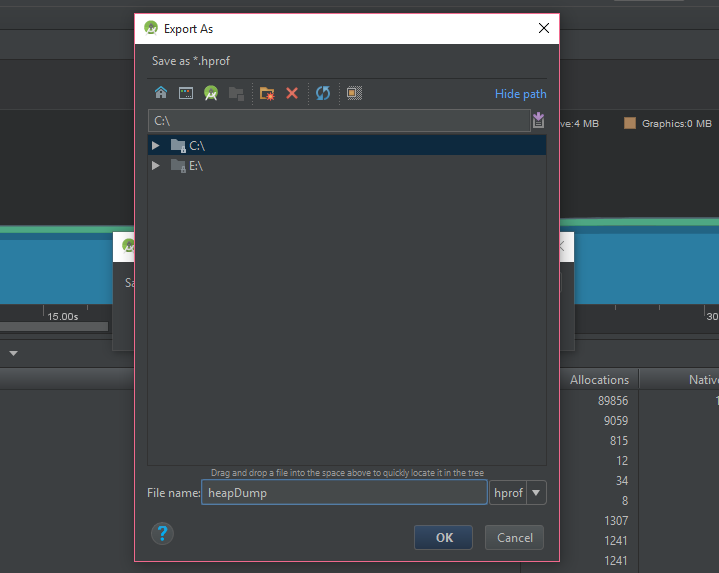
d. To store heap dump in your system, click on the highlighted icon in the below image.

e. Choose a location to save the generated heap dump file.

2. Android Debug Bridge (ADB)
Android Debug Bridge is a command line tool which allows you to interact with a device. ADB provides a variety of device actions, such as installing and debugging apps. It also gives access to the Unix shell to run a variety of commands on the device. You can use this tool to generate android heap dumps. Launch ADB shell and follow the below steps:
a. Identify your Android App’s Process Id
First step is to identify your Android App’s process Id. You can do that by issuing below command:
adb shell ps | grep <APP-NAME> The above command will return details about the process. The second number will be the PID of your app. Please check the below screenshot.
b. Create a Heap Dump:
adb shell am dumpheap <PID> <HEAP-DUMP-FILE-PATH>

PID: Your Android App Process Id
HEAP-DUMP-FILE-PATH: Location where heap dump file should be generated
Example:
adb shell am dumpheap 1769 /data/local/tmp/android.hprofc. Pull the file to your machine
The above step will generate the heap dump file in the device. For analysis, you need to pull the generated file to your machine. You do that by issuing below command:
adb pull <HEAP-DUMP-FILE-PATH>

HEAP-DUMP-FILE-PATH: Location where heap dump file
Example:
adb pull /data/local/tmp/android.hprof3. Capture Heap Dumps on OutOfMemoryError
If you place the below code in your application, it will capture heap dumps whenever your application receives an OutOfMemoryError.
public class CaptureHeapDumps extends Application {
       private static final String FILE_NAME = "heap-dump.hprof";
       @Override
       public void onCreate() {
          super.onCreate();

Thread.currentThread().setUncaughtExceptionHandler(OutOfMemoryException());

       }
       @NonNull
       private Thread.UncaughtExceptionHandler OutOfMemoryException() {
               return new Thread.UncaughtExceptionHandler() {
               @Override
               public void uncaughtException(Thread t, Throwable e) {
                  String directory = getApplicationInfo().dataDir;
                  String absolutePath = new File(directory, FILE_NAME)
                         .getAbsolutePath();
                  try {
                      Debug.dumpHprofData(absolutePath);
                  } catch (IOException e) {
                      e.printStackTrace();
                  }
               }
        };
    }
}
This would generate the heap dump file in this location: /data/user/0/appname/heap-dump.hprof
Opinions expressed by DZone contributors are their own.

Comments