How to Automate JMeter and Selenium Tests
In this article, learn how to integrate automated load testing and browser testing into the Continuous Integration cycle.
Join the DZone community and get the full member experience.
Join For FreeContinuous testing and Continuous Integration are the best ways to ensure that your product constantly performs optimally. Load testing with JMeter or other tools and browser testing with Selenium can be integrated into the CI cycle. This post will cover how to automate these tests, and is based on Alon Girmonsky’s talk at Jenkins World 2016, which you can view here.
Using Taurus for Load and Browser Test Automation
Taurus, an open-source test automation framework, can help you automate open-source tools like JMeter, Selenium, The Grinder, Gatling, Locust, and Siege. This lets you run tests automatically and in parallel to achieve better test coverage. If you run the load and functional tests in the cloud, you will also be able to view and analyze test results for JMeter and Selenium through rich reports and identify issues and trends.
A few words about Taurus: Taurus is a command-line tool that lets you define your test universe by using YAML, which is a readable and writeable language, or through the JSON format, which you can generate in your code. Taurus builds and runs the tests in real-time through a configuration file, and then analyzes and communicates the results. Taurus supports multiple cloud locations from different providers: Amazon, Google, Azure, etc.
Automating JMeter and Selenium Tests
How does it work? Let’s look at this example.
1. Download Taurus.
2. Build or import two scripts (one for Selenium that automates the browser, one for JMeter commands) for reaching scales. If you add thresholds to the test, they will be shown on the Taurus local interface when the results are in.
The Selenium script automates the default browser Firefox for this URL from five different locations, for a 10 second ramp-up, and for a full test duration of five minutes and for one VU. We also added pass/fail criteria; if the average response time is more than 150 milliseconds for more than 30 seconds, then the test will stop as failed.
The JMeter script tests two requests: one GET request to this URL, one POST request to the same URL with two body parameters. The test is run from 5 different locations for a 60-second ramp-up for a full test duration of five minutes and for 20 VUs.
The scripts:
--- execution:
- executor: selenium concurrency: 1 hold-for: 5m ramp-up: 10s
locations: us-east-1: 1 us-west-1: 1 us-west-2: 1 eu-west-1: 1 eu-central-1: 1 scenario: Thread Group scenarios: Thread Group: requests:
- label: blazedemo method: GET url: http://www.blazedemo.com/ services:
- module: passfail criteria:
- avg-rt of blazedemo>150ms for 30s, stop as failed --- execution:
- executor: jmeter concurrency: 20 hold-for: 5m ramp-up: 60s
locations: us-east-1: 1 us-west-1: 1 us-west-2: 1 eu-west-1: 1 eu-central-1: 1 scenario: Thread Group scenarios: Thread Group: requests:
- label: blazedemo_jmeter method: GET url: http://blazedemo.com/
- body: fromPort: Paris toPort: Buenos Aires label: reserve method: POST url: http://blazedemo.com/reserve.php
3. Run the test locally at first to ensure that it runs well before committing it. Your browser will probably open up many times during the test run. This is normal.
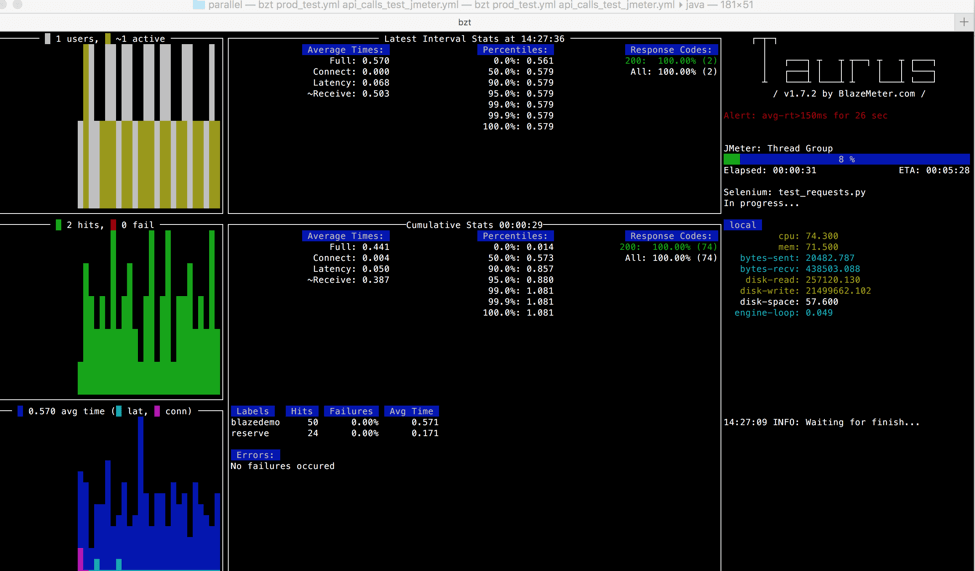
Both systems are operated by Taurus and run in parallel on the local machine. They can be viewed in real-time. This is the Taurus dashboard for these two tests:

In the top right you can see the two tests running in parallel (JMeter: Thread Group; Selenium: test_requests.py). Taurus can run Selenium from different programming languages such as Java, Python, and Ruby. The default language is Python.
In the top right, the alert for the pass/fail criteria that is about to be met, is displayed.
In the middle, you can see the cumulative statistics (for Selenium and JMeter) for the requests in different KPIs, such as latency, connect time, error rate, etc.
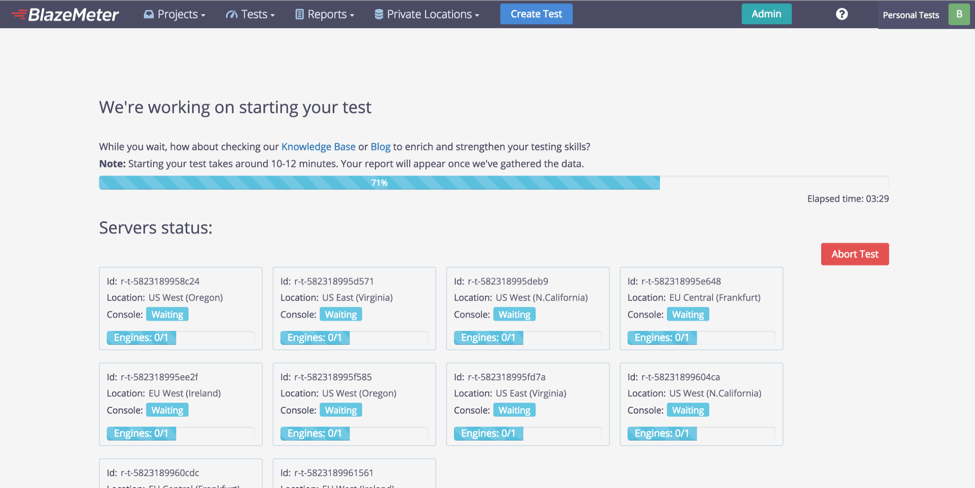
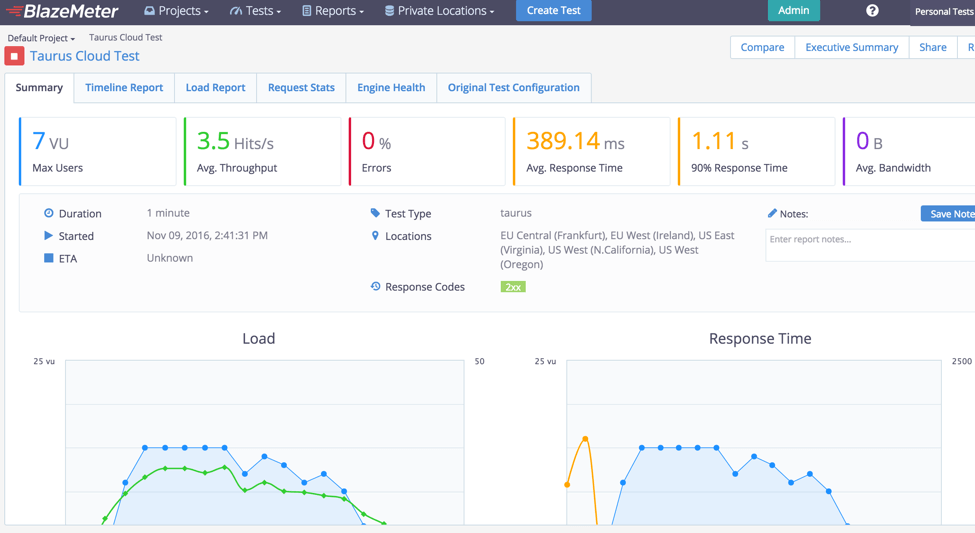
4. Now, run the tests in the cloud by adding -cloud to the command line. The tests will be opened in CA BlazeMeter and run in parallel from multi geolocations.


CA BlazeMeter provides rich reports for analyzing different KPI correlations, trends and discovering bottlenecks. You can read more here.
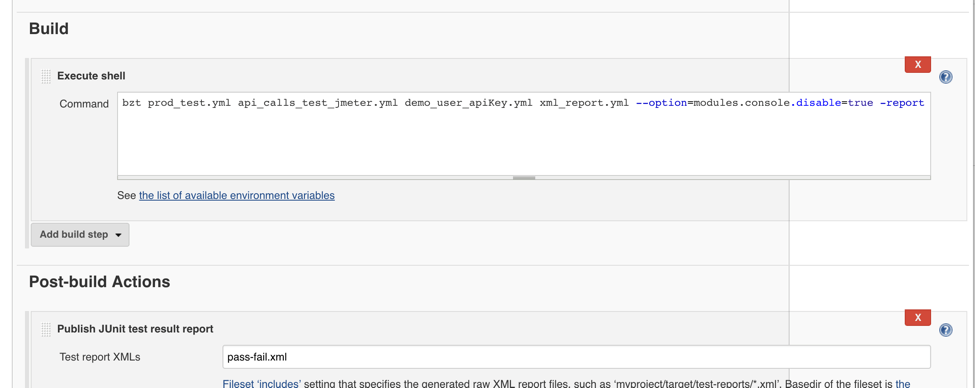
5. Taurus can be added to Jenkins through the ‘Execute shell’ build step. Read more here.

Congratulations! You are now ready to automate your JMeter and Selenium tests in parallel on Taurus and as part of the CI cycle. Click here to learn more about load testing with CA BlazeMeter.
Published at DZone with permission of Guy Salton, DZone MVB. See the original article here.
Opinions expressed by DZone contributors are their own.

Comments