How a Service Mesh Simplifies Microservice Observability
Observability is a wide umbrella covering several moving pieces. Service meshes cover a lot of ground without requiring us to write a single line of code.
Join the DZone community and get the full member experience.
Join For FreeThis is an article from DZone's 2022 Microservices and Containerization Trend Report.
For more:
Read the Report
Service meshes and observability are hot topics within the microservices community. In this Trend Report, we’ll explore in detail how a service mesh, along with a good observability stack, can help us overcome some of the most pressing challenges that we face when working with microservices.
Common Microservices Challenges
Adopting microservices is hard. Debugging and making sure they keep running is even harder. Microservices introduce a significant amount of overhead in the form of Day 2 operations. Let's dive into a few aspects that make working with microservices difficult.
Debugging Errors in a Distributed System Is a Nightmare
The distributed nature of microservices makes debugging errors difficult. In a monolith, just going through the logs and stack trace is enough to identify the root cause of a bug. Things aren’t so straightforward when it comes to microservices. In the case of errors, digging through a microservice’s logs may not directly point to the precise problem. Instead, it could simply mention an error present in the request and/or response received from a dependent microservice.
In other words, we’ll have to follow the entire network trace to figure out which microservice is the root cause of the problem. This is an extremely time-consuming process.
Identifying Bottlenecks in the System Isn’t Easy
In monoliths, identifying performance bottlenecks is as easy as profiling our application. Profiling is often enough to figure out which methods in your codebase are consuming the most time. This helps you focus your optimization efforts to a narrow section of code. Unfortunately, figuring out which microservice is causing the entire system to slow down is challenging.
When tested individually, each microservice may seem to be performant. But in a real-world scenario, the load on each service may differ drastically. There could be certain core microservices that a bunch of other microservices depend on. Such scenarios can be extremely difficult to replicate in an isolated testing environment.
Maintaining a Microservice Dependency Tree Is Difficult
The entire point of microservices is the agility at which we can release new software. Having said that, it is important to note that there can be several downstream effects when releasing a microservice. Certain events that often break functionality are:
- Releasing a dependent microservice before its upstream dependency
- Removing a deprecated API that a legacy system still depends on
- Releasing a microservice that breaks API compatibility
These events become difficult to avoid when there is no clear dependency tree between microservices. A dependency tree makes it easier to inform the appropriate teams and plan releases better.
Observability: The Solution to the Microservices Problem
All the problems I’ve mentioned above can be resolved through observability. According to Jay Livens, observability is the practice to capture the system’s current state based on the metrics and logs it generates. It’s a system that helps us with monitoring the health of our application, generating alerts on failure conditions, and capturing enough information to debug issues whenever they happen.

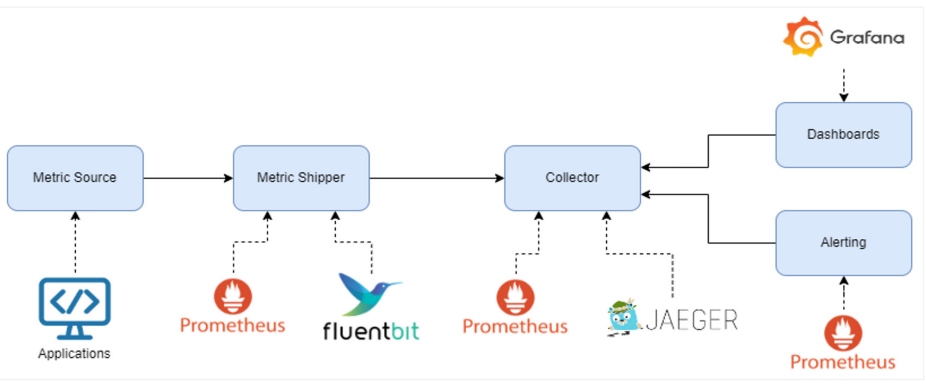
Figure 1: Components of an observability stack with open-source examples
Any observability stack will have the following components:
- Source of metrics/logs – an agent or library we use to generate data
- Metric/log shipper – an agent to transport the data to a storage engine; often embedded within the metric source
- Collector/store – a stateful service responsible for storing the data generated
- Dashboards – fancy charts that make the data easy for us to interpret and digest
- Alert manager – the service responsible for triggering notifications
Luckily for us, there are some powerful open-source tools to help simplify the process of setting up an observability stack.
Introducing Service Meshes
A major aspect of observability is capturing network telemetry, and having good network insights can help us solve a lot of the problems we spoke about initially. Normally, the task of generating this telemetry data is up to the developers to implement. This is an extremely tedious and error-prone process that doesn’t really end at telemetry. Developers are also tasked with implementing security features and making communication resilient to failures.
Ideally, we want our developers to write application code and nothing else. The complications of microservices networking need to be pushed down to the underlying platform. A better way to achieve this decoupling would be to use a service mesh like Istio, Linkerd, or Consul Connect.
A service mesh is an architectural pattern to control and monitor microservices networking and communication.
Let’s take the example of Istio to understand how a service mesh works.

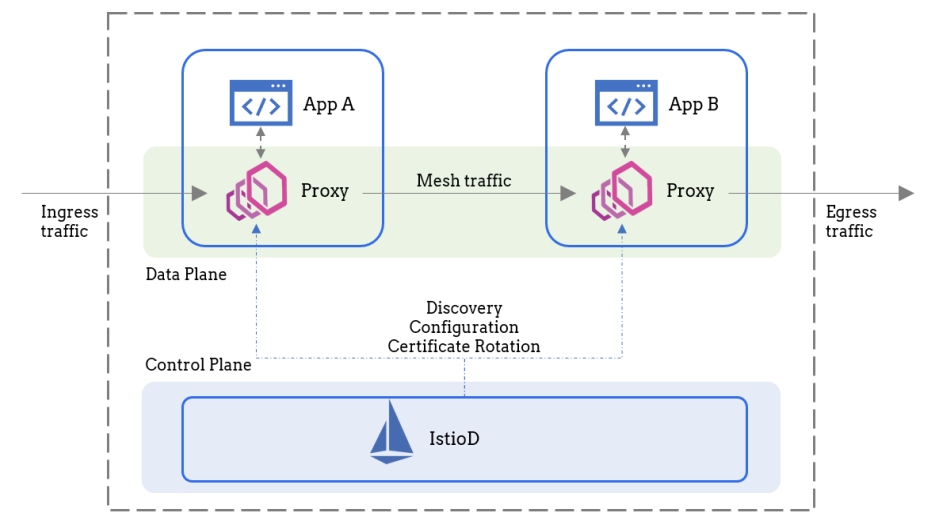
Figure 2: Typical service mesh architecture
Source: Image adapted from Istio documentation
A service mesh has two major components: the data plane and the control plane. The data plane is responsible for managing all the network traffic our microservices will generate. To achieve this, a service mesh injects a sidecar proxy alongside each one of our microservices. This sidecar, which is usually Envoy, is responsible for transparently intercepting all traffic flowing through the service. The control plane, on the other hand, is merely responsible for configuring the proxies. No application traffic ever reaches the control plane.
The service mesh architecture, as illustrated in Figure 2, helps you abstract away all the complexities we spoke about earlier. The best part is that we can start using a service mesh without having to write a single line of code. A service mesh helps us with multiple aspects of managing a microservices-based architecture. Some of the notable advantages include:
- Obtaining a complete overview of how traffic flows
- Controlling the flow of network traffic
- Securing microservices communication
Obtaining a Complete Overview of How Traffic Flows
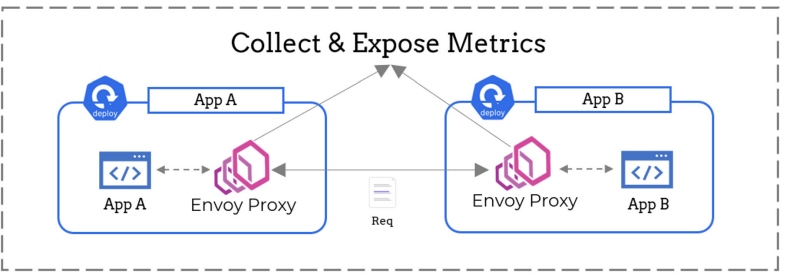
In Figure 3, App A is making a request to App B. Since the Envoy proxies sitting beside each app are intercepting the request, they have complete visibility over the traffic flowing through these two microservices. The proxies can inspect this traffic to gather information like the number of requests being made and the response status code of each request.
In other words, a service mesh can help us answer questions like:
- Which service is talking to which?
- What's the request throughput observed by each microservice?
- What’s the error rate of each API?

Figure 3: A service mesh can help collect metrics
Controlling Network
A service mesh isn’t just a silent spectator. It can actively take part in shaping all network traffic. The Envoy proxies used as sidecars are HTTP aware, and since all the requests are flowing through these proxies, they can be configured to achieve several useful features like:
- Automatic retires – ability to replay a request whenever a network error is encountered
- Circuit breaking – blacklisting an unhealthy replica of an upstream microservice that has stopped responding
- Request rewriting – ability to set headers or modify the request URL when certain conditions are met

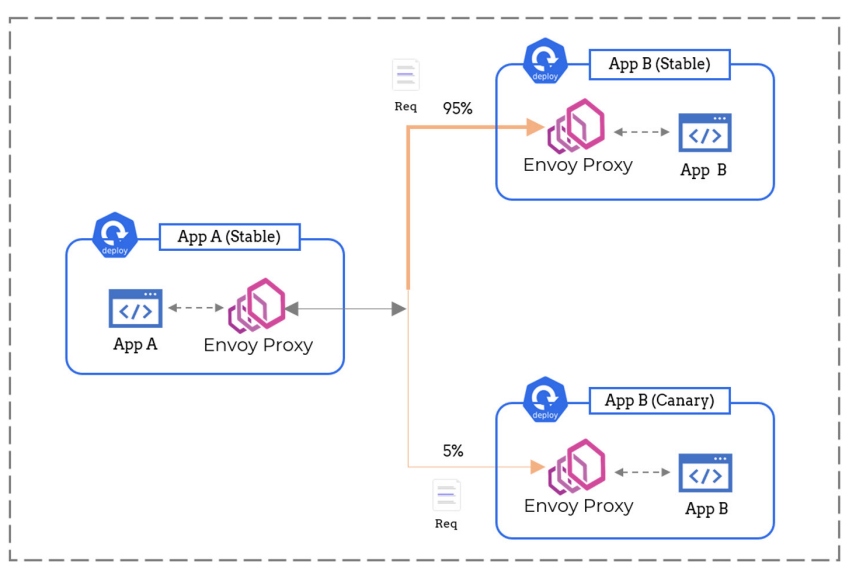
Figure 4: A service mesh can shape network traffic
And it doesn’t end here. The proxies can also split traffic based on a certain weight. For example, we can configure the proxies to send 95% of the incoming traffic to the stable version of the service while the rest can be redirected to the canary version. This can help us simplify the release management process by powering advanced practices like canary deployments.
Securing Microservices Communication
Another great advantage of using a service mesh is security. Our sidecar proxies can be configured to use mutual TLS. This ensures that all network traffic is automatically encrypted in transit. The task of managing and rotating the certificates required for mTLS is fully automated by the service mesh control plane.
A service mesh can assist in access control as well by selectively allowing which service is allowed to talk to which. All this can help us completely eradicate a whole breed of security vulnerabilities like man-in-the-middle attacks.

Figure 5: A service mesh can secure network traffic
How Does a Service Mesh Help With Observability?
We just saw how a service mesh can capture telemetry data. Let’s dig a bit deeper to understand what kind of use cases this data can power.
Distributed Tracing
We've discussed how difficult it is to debug microservices. One way to solve this debuggability problem is by means of distributed tracing — the process of capturing the lifecycle of a request. One graph alone can make it so much easier to figure out the root cause of the problem.
Most service meshes automatically collect and ship network traces to tools like Jaeger. All you need to do is forward a few HTTP headers in your application code. That’s it!
Traffic Flow Metrics
A service mesh can help us collect three out of the four golden signals one must monitor to determine a service’s health:
- Request throughput – the number of requests being serviced by each microservice
- Response error rate – the percentage of failed requests
- Response latencies – the time it takes for a microservice to respond; this is a histogram from which you can extract n percentiles of latency
There are many more metrics that a service mesh collects, but these are by far the most important ones. These metrics can be used to power several interesting use cases. Some of them include:
- Enabling scaling based on advanced parameters like request throughput
- Enabling advanced traffic control features like rate limiting and circuit breaking
- Performing automated canary deployments and A/B testing
Network Topology
A service mesh can help us automatically construct a network topology, which can be built by combining tracing data with traffic flow metrics. If you ask me, this is a real lifesaver. A network topology can help us visualize the entire microservice dependency tree in a single glance. Moreover, it can also highlight the network health of our cluster. This can be great for identifying bottlenecks in our application.
Conclusion
Observability is a wide umbrella covering several moving pieces. Luckily for us, tools like service meshes cover a lot of ground without requiring us to write a single line of code. In a nutshell, a service mesh helps us by:
- Generating distributed tracing data to simplify debugging
- Acting as a source for critical metrics like the golden signals for microservices monitoring
- Generating a network topology
As next steps, you can check out the following guides to dive deeper into the world of service meshes and observability.
- Get started with Istio (video)
- Get started with LinkerD (video)
- Get started with Kuma (video)
- "How to Set Up Monitoring Using Prometheus and Grafana" (article)
This is an article from DZone's 2022 Microservices and Containerization Trend Report.
For more:
Read the Report
Opinions expressed by DZone contributors are their own.

Comments