How a Data Science Company Uses Comics to Make Data Less Complicated
Tell a more engaging story with your data.
Join the DZone community and get the full member experience.
Join For FreeYou could be the best writer in the world, but no one will receive your message if they don't read your work. Writers often struggle to write stories about complex, data-driven topics in a way that engages an audience who won't read a report, long article, or deep-dive analysis. One way to communicate with less effort is graphics, pictorials, and cartoons.
I spoke to Naveen Gattu, Chief Operations Officer at Gramener about their efforts to tell insightful stories from data. Gramener was founded in 2010 by a team of ex-IBMers. The founding team had mostly worked together in the 1990s and then went their own ways — mostly into IT services and consulting firms, such as Birlasoft, Infosys, Accenture, BCG, etc. In 2010, the team decided to venture into their own enterprise. Gattu explained:
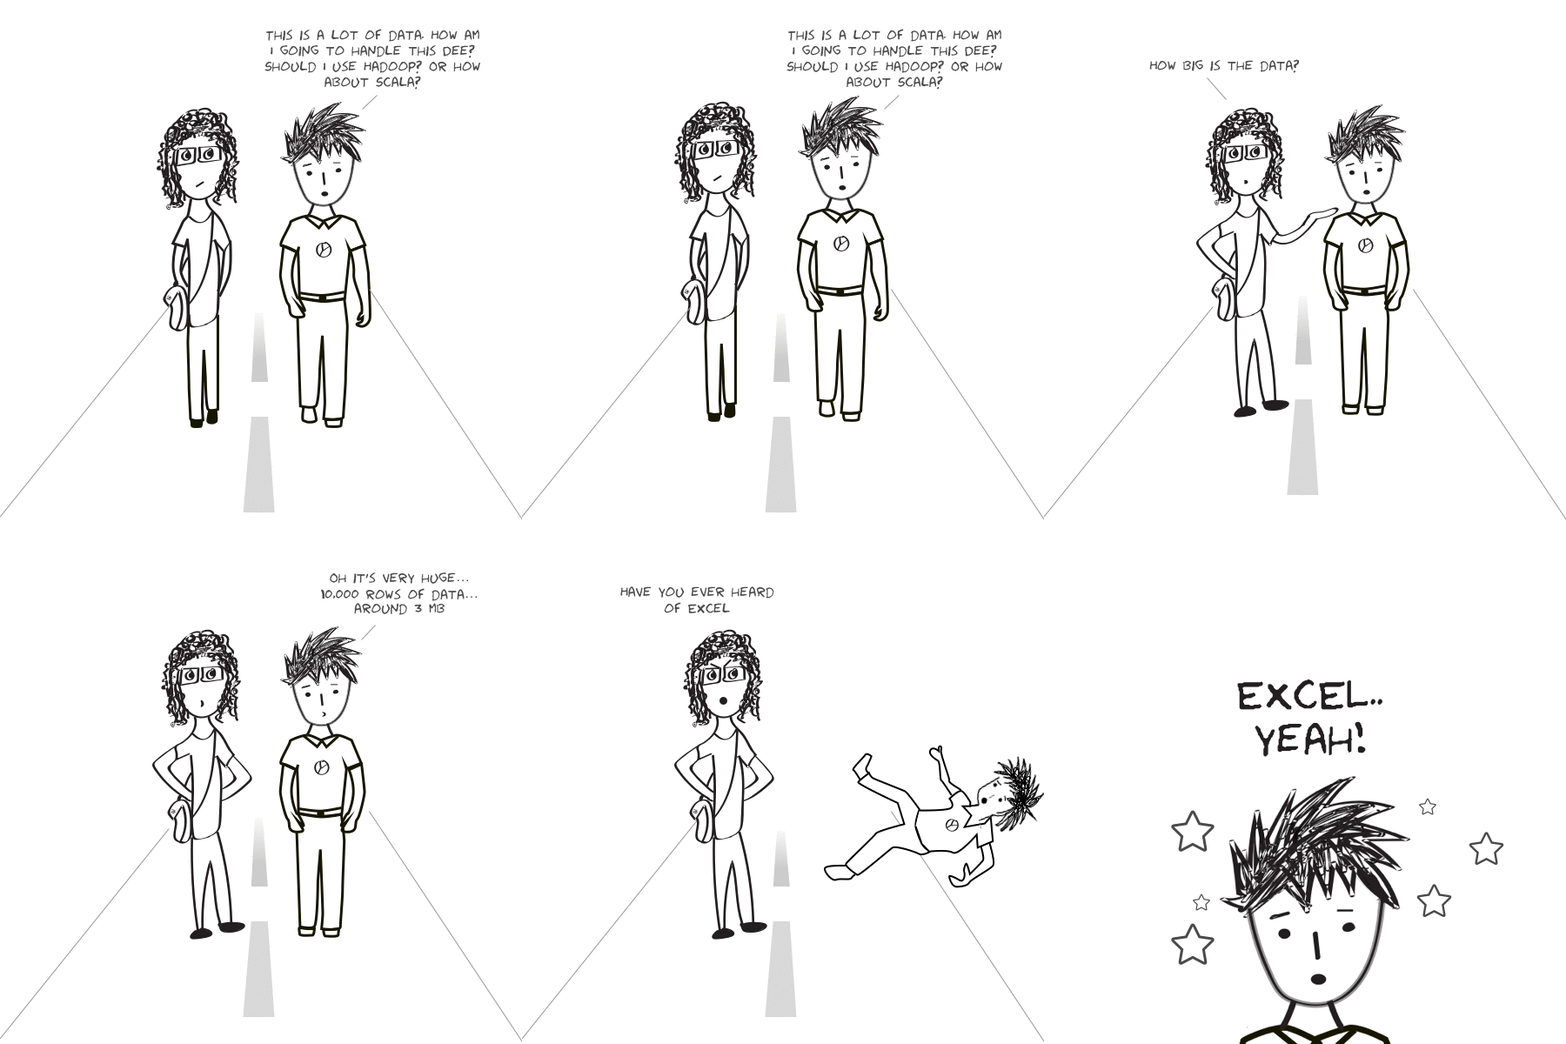
"Gramener is a Design-led Data Science Company. Its vision is to narrate data-driven insights as stories. The objective is to make complex data comprehensive and consumable through insights told through stories. Why? Because stories live forever."
One of the methods the company has created to help people tell important stories is an open source tool built with JavaScript called Comicgen and a simple API.

Why Comics?

You might not think of comics as having suitable gravitas, but it's a medium with several selling points:
- Comics are "catchy": That makes them a powerful way of engaging the audience.
- Comics make things simpler: Comics are a signal that the content is simple, interesting and often funny.
- Comics nudge authors: Comics push authors into making their content simpler, more interesting, and funny — making this a virtuous cycle.
- Comics drive emotion: The pictures convey emotions better than just words alone. That makes the stories more memorable

Comicgen enables anyone, including non-designers, non-programmers, and non-storytellers to tell stories through comics and create simple comic strips. You can:
Add characters. Characters can be split into layers (like face an body). By combining these cleverly more characters can be created.
Add layers think objects like speech bubbles, panels, headings, objects, scenery, backgrounds, etc.
Integrate into your existing workflow. Comicgen is easily to use with existing tools such as:
- Illustrator/Sketch.
- HTML/JS.
- Tableau/Power BI.
- e-mail/MS Office.
Successful Storytelling

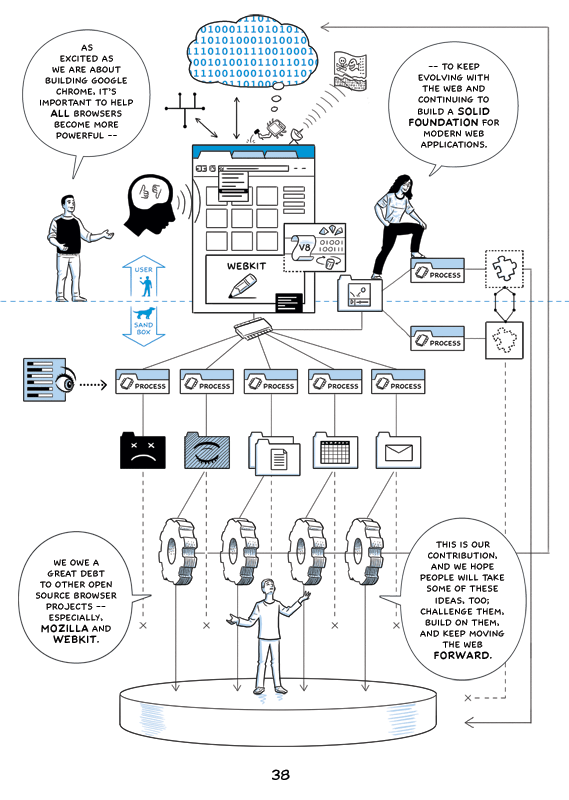
Google's Scott McCloud used ComicGen to explain Google Chrome to great effect. Julia Evans created a number of zines, including Bite-sized command line, a zine that explains UNIX commands with comics. I particularly liked the story Naveen shared — "An admin manager sent his status report as a pair of comic characters conversing. Their CEO read this report fully for the first time."
Beyond comics, the company has also visualized Trumps tweets, visualized supply chain analytics, a visual report of World Bank research into Innovation, Technology, and Entrepreneurship, and a visual of the grants administered by Bill and Melinda Gates. If you've ever spent hours senselessly pouring over dense, dull white papers and reports, you 'll find the opportunity to use imagery and graphics might just be what you're looking for.
Opinions expressed by DZone contributors are their own.

Comments