Data Modeling and ETL Design Using AWS Services
This article discusses storing, designing, modeling, and analyzing data based on crypto data using AWS services. Learn more!
Join the DZone community and get the full member experience.
Join For FreeAs the data industry evolves, data insights become increasingly accessible, forming the fundamental elements for various time-centric applications such as fraud detection, anomaly detection, and business insights. An essential and widely recognized component in unlocking the value and accessibility of this data is comprehending its nature and interrelationships and extracting meaningful values.
Data modeling serves as the crucial blueprint akin to architectural plans for a house, defining how data is structured, modeled, and interconnected to facilitate informed decision-making efficiently. Additionally, data modeling elevates raw data collection to a level that is ready to be transformed into information, empowering the users to derive valuable insights. This article highlights the significance of data modeling, data storage, and ETL (Extract, Transform, Load) design tailored for downstream analytics. It draws insights from sample data obtained through the Binance crypto open API.
![data ingestion]() Data Storage: (Data Lake)
Data Storage: (Data Lake)
Data is ingested by utilizing the Binance API; for further information on the data acquisition process, please refer to this article. This data is regularly ingested into S3 and serves as the foundational Data Lake, representing the primary source for all analyses. Each dataset may have its distinct ingestion method; however, in our case, we use a single method of ingestion using a container. Exposing the data by means of data-lake through Data Crawling, Data Cataloging, and Data querying mechanisms enables the users/jobs to query the underlying data for analytics.
-
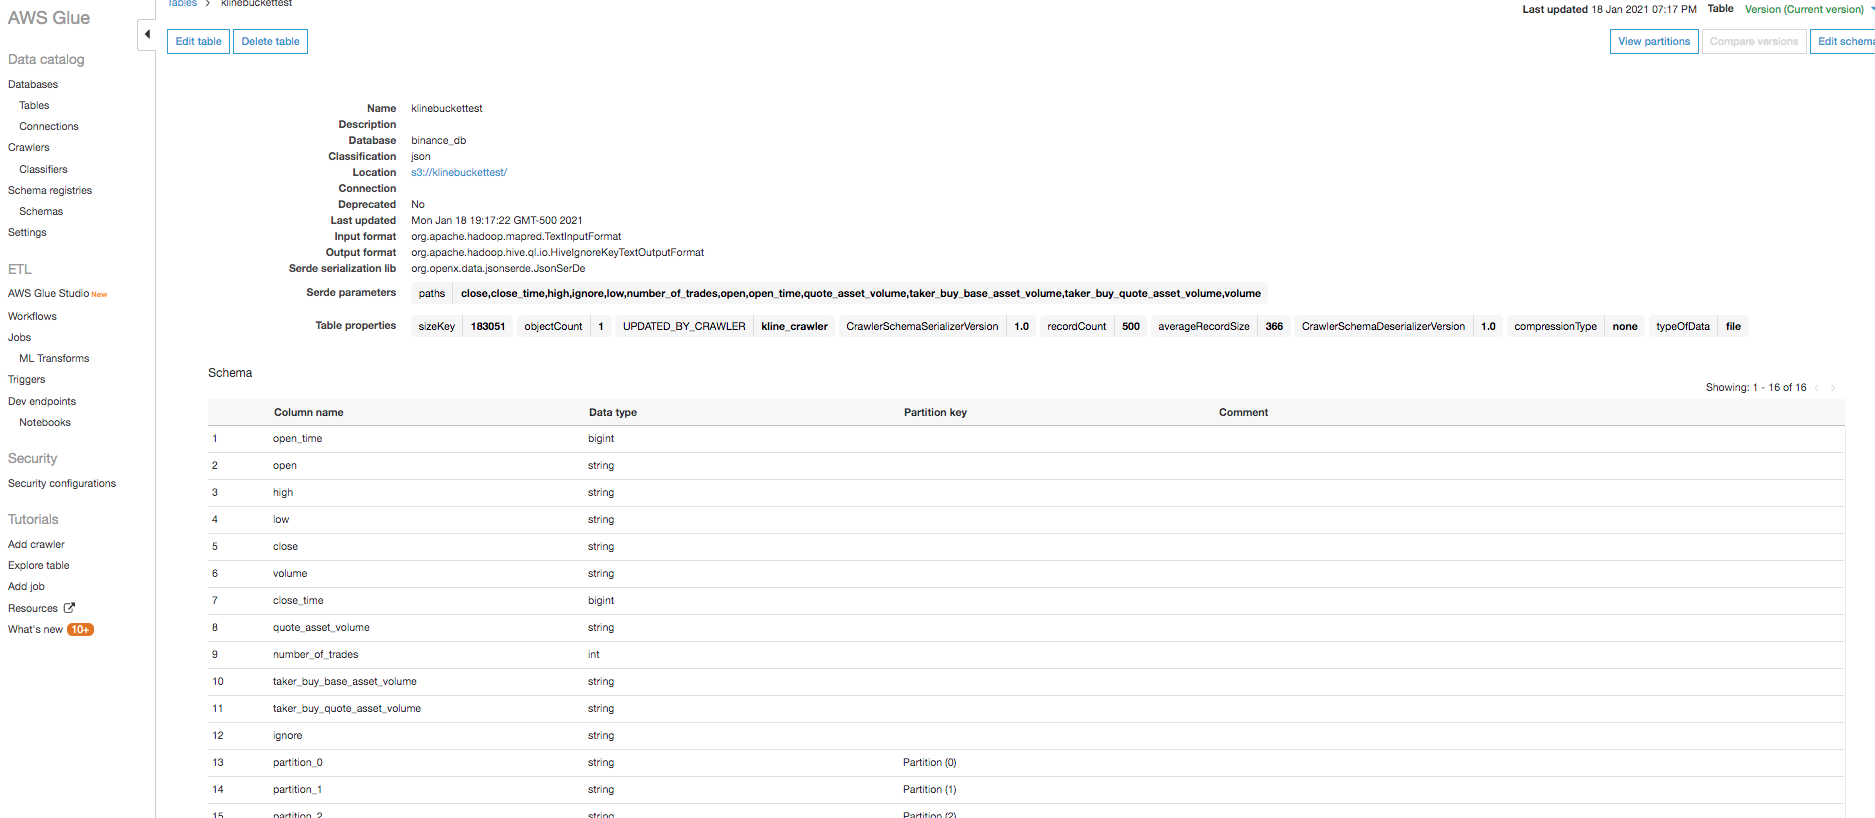
Glue Crawler scans through the ingested data, creating the Glue Catalog.
-
These crawlers can be scheduled to run at various intervals, such as hourly or daily, enabling them to identify changes in schemas and update the Glue Catalogs accordingly.
-
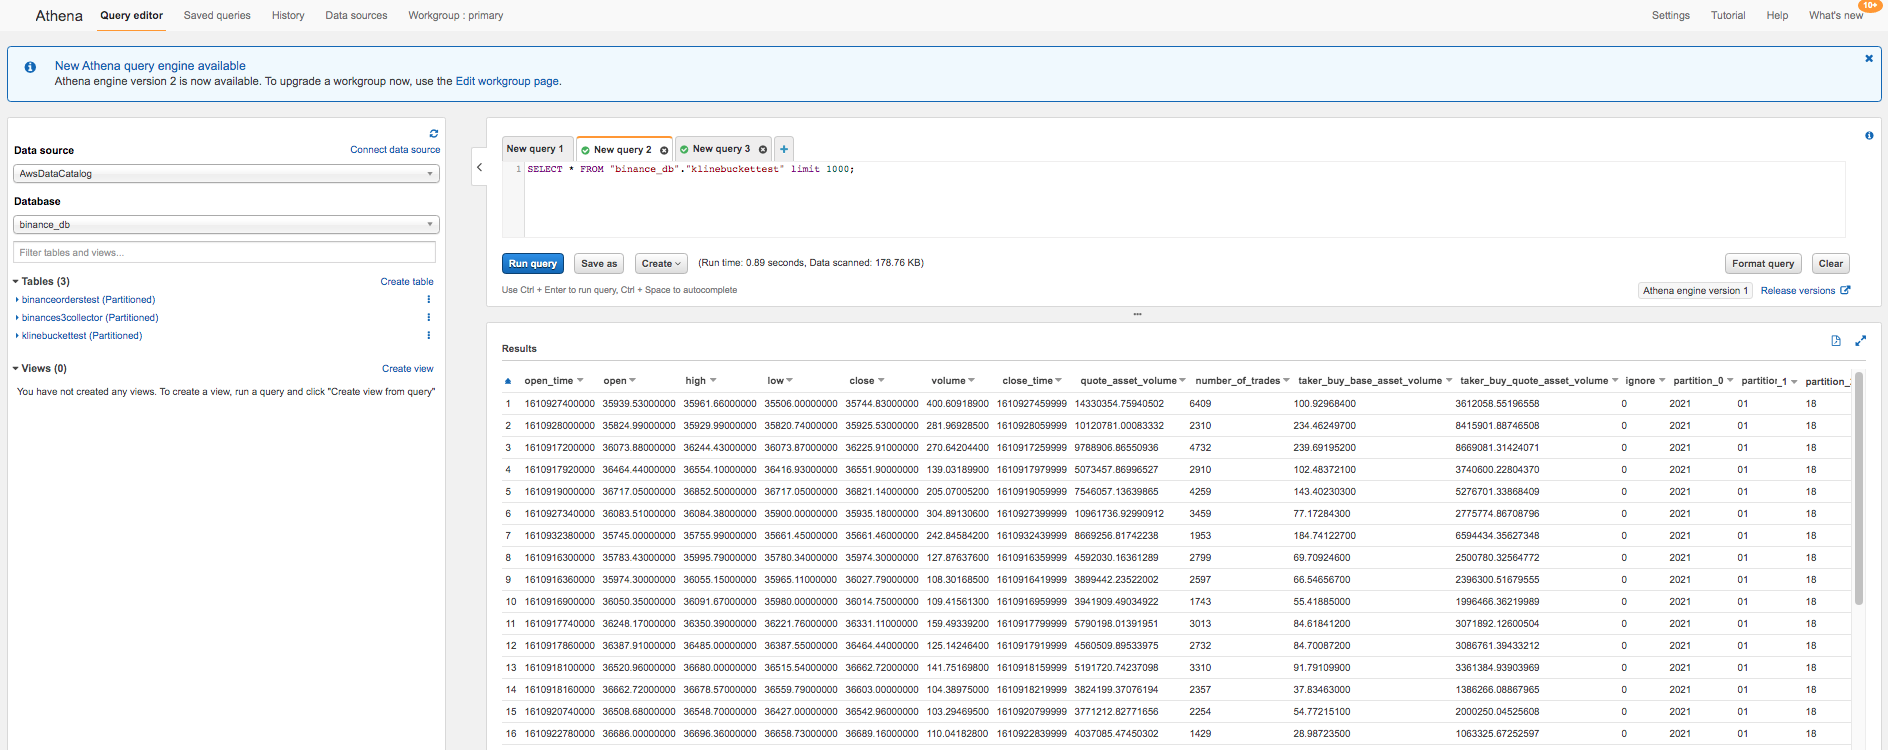
Analysis can be performed using Athena, a server-less-interactive analytics service over the underlying data for near real-time analytics (in s3 can, in turn, be referred to by redshift spectrum).

Sample glue catalog data

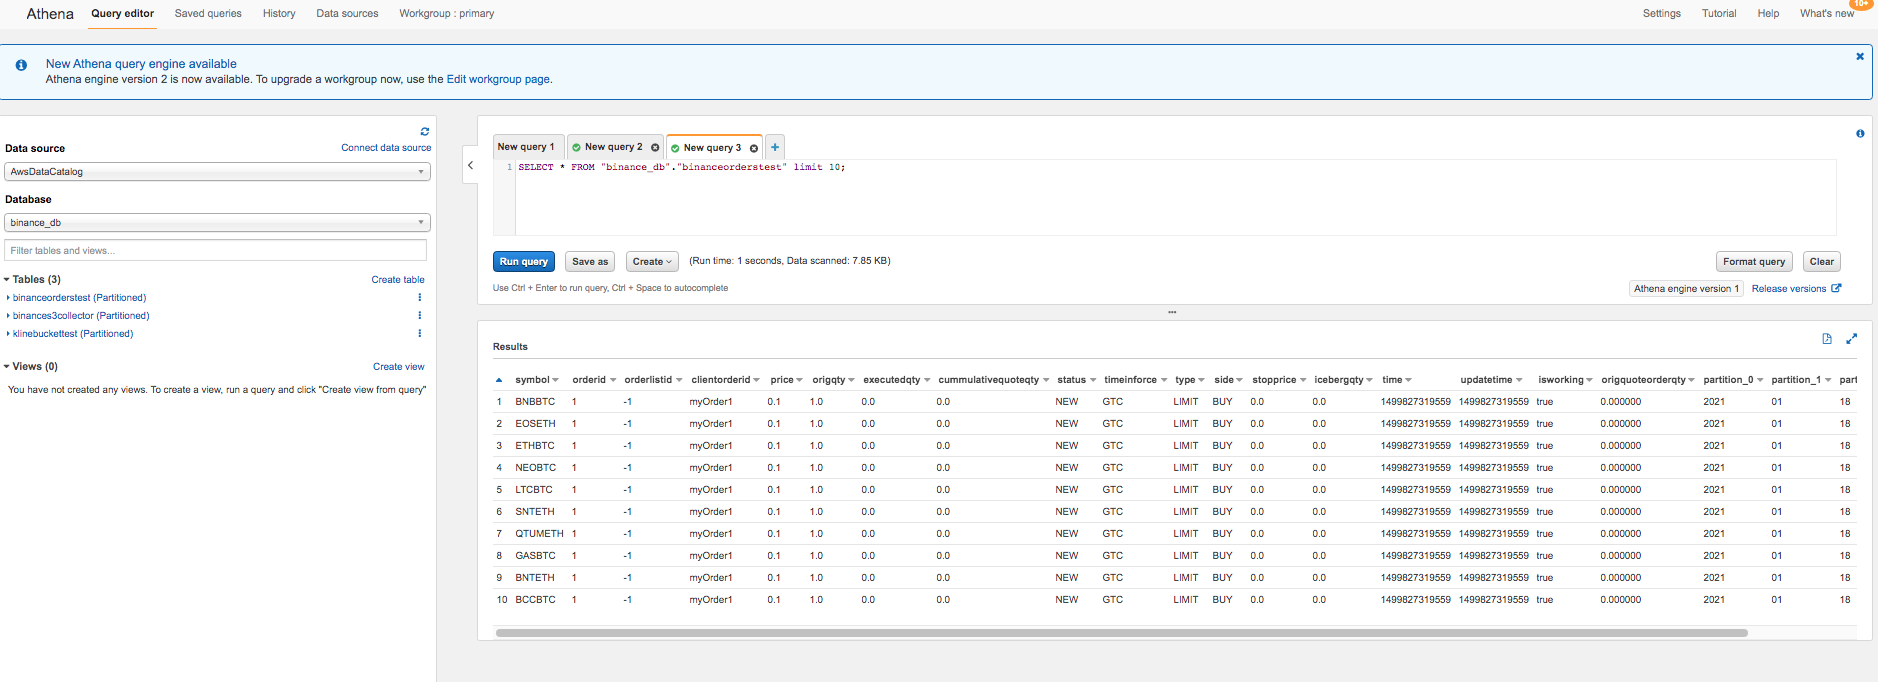
Sample data queried using Athena

Sample Data for kline/candle grain and orders of 1 min
ETL Design: (Redshift/Redshift Spectrum)
As observed in the preceding section, data is currently accessible within a data lake, allowing querying via Athena for ad hoc analytics or Redshift Spectrum for direct data manipulation on S3. Additionally, we can execute Glue ETL processes on this S3 data to generate the required tables. Despite the array of available options, for simplicity's sake, we have opted to transfer the data to a data warehousing platform. This choice enables discussions on data modeling using standard SQL queries instead of SPARK APIs. In our case, we have selected AWS's Redshift as our data warehousing platform.
- After data arrives in S3, it can be transferred into the Redshift cluster using the copy command from S3. When loading data into the Redshift cluster, it utilizes Redshift compute, not Redshift Spectrum's compute. Storing data locally within the Redshift cluster is a preferable choice because ETL jobs operate on this raw data for multiple iterations. For instance, querying this table to generate aggregated tables at daily or hourly granularities is an everyday use case, and Redshift compute would provide optimal compute cost.
- The loading of this data and the subsequent ETL steps can be executed through AWS Data Pipeline, Apache Airflow, or alternative data orchestration and scheduling tools, allowing flexibility in setting the frequency hourly or daily.
- Data can undergo merging (upsert - combining update and insert operations) into Redshift based on the primary key. Utilizing transactional blocks for the merge ("upsert") ensures data integrity throughout updates, inserts, and deletes.
There are instances where we can merge batch and real-time analytics queries by establishing a view that integrates Redshift and Redshift Spectrum queries, aligning column names accordingly. Typically, BI or data scientists query solely real-time data for ad hoc analysis and sentiment analysis, with very few cases requiring the combination of batch and real-time data. Maintaining a view remains valuable, but it should be employed only when there is a demanding business use case for batch and real-time data. In the following section, we will delve into the design and modeling of this data for analytics purposes.
Data Modeling: (Star Schema)
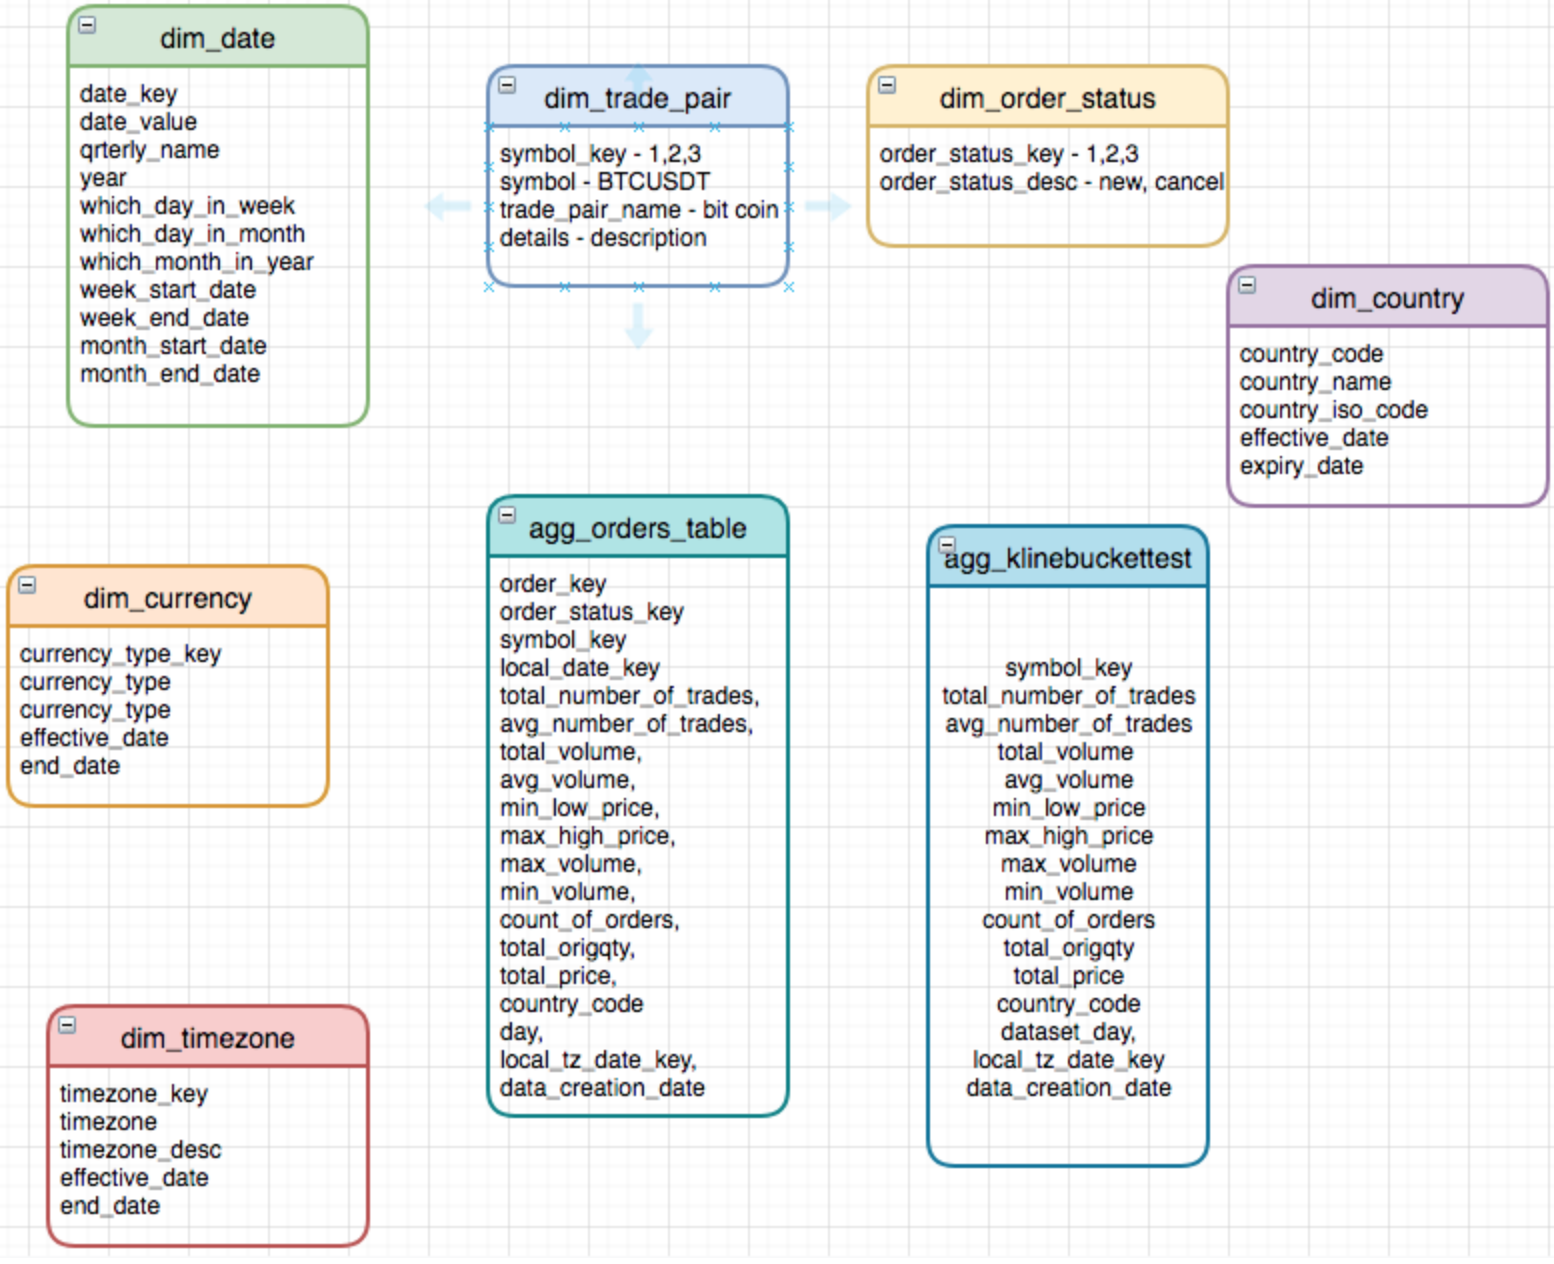
The fundamental components of data modeling comprise Facts, Dimensions, and Attributes. Facts represent the measurements within a business process, Dimensions offer the contextual framework for a business process, and attributes delineate the specific characteristics of a business process. For this article, We will adopt a method that entails building the model using a simple star schema. In the starting schema, the central focus lies on the fact table positioned at the core of the star, while the dimension tables encircle and form the points around it.
Within our illustration:
- The dimensional tables can be fashioned utilizing currency, date, trading pair, and country data, encompassing attributes that define each dimension (such as the year attribute for date), facilitating the slicing and dicing of measures.
- The fact tables can be formulated using order data, encapsulating aggregated information. For instance, these tables may exhibit data like the count of orders placed for a specific date within a particular country.
I've generated aggregate tables and sample queries to address a hypothetical business scenario aiming to determine the count of orders for a specific day. The primary goal of this endeavor is to cultivate an understanding of dimensional modeling by tackling a simple use case. Let's designate the tables "agg_orders" and "agg_klinebuckettest" as the aggregated tables housing facts related to orders placed on a given day and candlestick orders for a particular day, respectively.

It's essential to note that these aggregate tables can be formulated based on daily or hourly granularity as per the business requirements. They can also be generated as distinct tables, catering to the preferences of various users or stakeholders. For instance, a BI Analyst might find a weekly or monthly report more useful using a daily granularity aggregate table. On the other hand, a Sales Analyst might require data at an hourly level to analyze order and sales patterns. Therefore, creating two separate aggregate tables at daily and hourly levels can accommodate these diverse use cases.
ETL Query for aggregation (How agg_klinebuckettest table is populated):
insert  into binance_db.agg_klinebuckettest (

with agg_orders_table as
(
select count(distinct orderid) count_of_orders,
sum(origqty) total_origqty,
sum(price) total_price,
{dataset_day},
symbol
from
binance_db.binanceorderstest
where
time > trunc({dataset_day})-2
group
by symbol,
{dataset_day}
)
select
sum(kline.number_of_trades) total_number_of_trades,
avg(kline.number_of_trades) avg_number_of_trades,
sum(kline.volume) total_volume,
avg(kline.volume) avg_volume,
min(kline.low_price) min_low_price,
max(kline.high_price) max_high_price,
max(kline.volume) max_volume,
min(kline.volume) min_volume,
agg_orders.count_of_orders,
agg_orders.total_origqty,
agg_orders.total_price,
{dataset_day}
from binance_db.klinebuckettest kline
join agg_orders_table agg_orders on kline.symbol = agg_orders.symbol
where
(kline.open_time > trunc({dataset_day})-2
group by kline.symbol
group by {dataset_day}
);
Analytics Query to find the volume for a given time range for BTC:
select sum(volume), avg(volume)
from binance_db.agg_klinebuckettest
where
open_time > {start_time}
and open_time < {end_time}
and symbol = 'BTCUSDT';
What is the 52-week high and low for all the items sold in the past three months?
with qualified_order as
(select
kline.symbol,
high_price,
low_price,
volume
from
binance_db.agg_klinebuckettest kline
join
"binance_db"."binanceorderstest" orders on kline.symbol = orders.symbol
where orders.time > (select {dataset_day} - interval '3 month'))

select
max(qual_order.low_price),
max(qual_order.high_price),
from qualified_order qual_order
join binance_db.klinebuckettest kline on kline.symbol = order.symbol
where
to_timestamp(partition_0||partition_1||partition_2||partition_3,'yyyymmddhh24') > select {dataset_day} - interval '52 week';
Data Governance in Data Lake
As data sets within the data lake grow, ensuring proper governance, establishing permission models over datasets, and securing access to sensitive data becomes increasingly challenging. This encompasses tasks such as granting access to particular datasets, auditing data access, and eliminating redundant data. AWS's Lake Formation offers a solution by enabling the creation of data lakes with robust security policies and access controls. Leveraging capabilities from AWS Glue, Lake Formation incorporates data cataloging functionalities and utilizes them effectively.
Data Lineage
With increasing transformation rules applied across multiple data sources using various pipelines, tracking and identifying a specific dataset's path, origin, and transformation rules becomes exceedingly challenging. This situation has led us to recognize the need for a data lineage tool to trace links and uncover both intermediate stages and the data source. Data engineers invest significant time in tracing lineage to resolve data issues, which becomes more complex with the continuous addition of new pipelines and datasets. There is an urgent requirement for a data lineage framework to streamline this process. Marquez serves as an open-source metadata service designed for collecting, aggregating, and visualizing metadata within a data ecosystem. This service addresses the need for a metadata layer atop datasets, allowing the construction of any wrapper necessary to achieve lineage tracking.
Conclusion
This article presents an overview of approaches to data storage across multiple tiers customized for analytical purposes. It explores various computing options applicable to analytics, the creation of queries to facilitate data transformation and loading, and the strategic structuring of stored data to establish a comprehensive data model.
Moreover, it delves into the potential benefits of employing real-time and batch analytics, addressing crucial prerequisites within data lake architecture and spotlighting tools proficient in managing associated challenges. Additionally, it touches on the importance of data governance and data lineage.
In real-world implementations, considerations may extend to research more modeling methods and additional schema options, such as the snowflake schema, to resolve complex data designs and challenges. This article aims to provide valuable guidance and insights for crafting a data model, mainly focusing on AWS data storage suitable for moderate-level analytics requirements. It is also poised to play a crucial role in assessing needs from storage, design, and modeling perspectives for a business problem. I believe that this article will assist you in enhancing your ETL design and data modeling, thereby enriching and expanding your capabilities in the realm of data analytics.
Opinions expressed by DZone contributors are their own.

 Data Storage: (Data Lake)
Comments