Creating Visualizations in Grafana
For those getting started with Grafana for monitoring, this tutorial will help you create a visualization using your Prometheus metrics.
Join the DZone community and get the full member experience.
Join For FreeIn this article, we will learn how to create visualizations in Grafana for monitoring. Our aim is to create a visualization that shows the hit count of an endpoint.
Assumptions
- You have a REST application which exposes Prometheus metrics as an endpoint (in our case, http://localhost:9000/actuator/prometheus). Follow this article for a step by step guide to expose metrics. You can get the application I used from this GitHub repository.
- You have a working instance of Prometheus and Grafana running. If not, follow the steps in this article to set things up and running.
Let's create our visualization following the steps below:
- Add your metrics endpoint as a datasource in Grafana. You can follow this article for a step-by-step guide.
- Create a visualization
- Click in the "+" icon on right sidebar.
- From the Create menu, select "Dashboard."
![dashboard dashboard]()
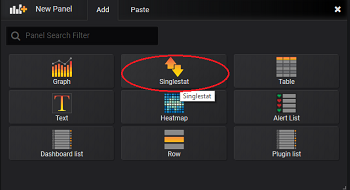
- Select "Singlestat" in the "add" tab in a new panel (as we only have a single count gauge).
![Image title]()
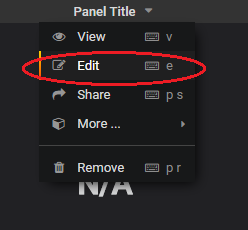
- A blank panel will be added to the screen. Click on the drop-down icon on the panel title. Select "Edit" from the options.
![Image title]()
- Select "General" from the tabs. You can edit basic information from this screen. In the title section, you can rename the title for the panel — let's say "Get Person Count."
![Image title]()
- Select the "Metrics" tab and from the "Data Source" drop-down, select "prometheus-local" (remember that we added this as our datasource in an earlier step). Add the below query in the query section provided: http_server_requests_seconds_count{exception="None",instance="localhost:9000",job="person-app",method="GET",status="200",uri="/person"}
![Image title]()
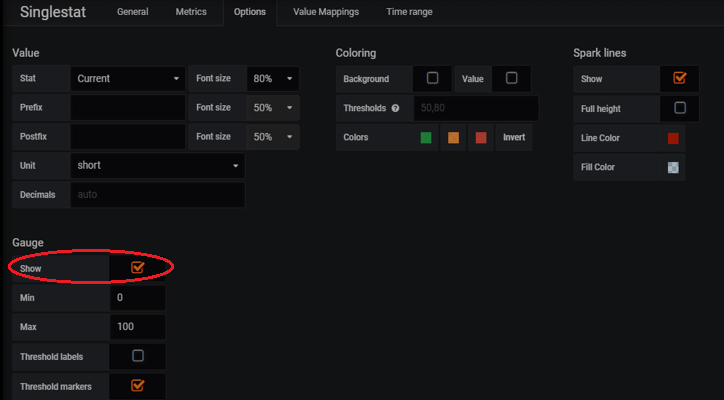
- In the "Options" tab, click on to the checkbox for "show" in the Gauge section. You can change the colors and other options if you want to.
![Image title]()
- Save the changes by pressing "CTRL + S". Enter comments and click "save."
![Image title]()
- You should be able to see the total hit count for the "/person" api in a guage.
![Image title]()
- Congratulations! We got our gauge showing the total hit count. Below is a sample dashboard created for JVM monitoring.
![Image title]()
In our next article, we shall be monitoring a MySQL database using Grafana.
Visualization (graphics)
Grafana
Opinions expressed by DZone contributors are their own.


Comments