Code Coverage Isn't Only for Unit Tests
A look at the basics and subtypes of code and test coverage, and a tutorial on how to measure it.
Join the DZone community and get the full member experience.
Join For FreeWhat is Code (or Test) Coverage?
Code coverage (or test coverage) shows which lines of the code were (or were not) being executed by the tests. It is also a metric which helps you to find out the percentage of your covered (executed) code by the tests. E.g.: It tells you that your codebase consists of 10 lines, 8 lines were being executed by your tests, so your coverage is 80%. (It tells you nothing about the quality of your software or how good your tests are.)
If you want to read more about code coverage, check these links:
What Are the Subtypes of Test Coverage?
Basically, test coverage can be measured for all levels of tests, like unit-, integration-, acceptance tests, etc. For example, unit test coverage is a subtype of test coverage, it shows which lines of the source code were (or were not) being executed by the unit tests.
How Do You Measure Code Coverage?
The usual way (at least in the Java world) to measure code coverage is instrumenting the code. Instrumentation is a technique to track the execution of the code at runtime. This can be done in different ways:
Offline instrumentation
Source code modification
Byte code manipulation
On-the-fly instrumentation
Using an instrumenting ClassLoader
Using a JVM agent
Offline Instrumentation
Offline instrumentation is a technique to modify the source code or the byte code at compile time in order to track the execution of the code at runtime. In practice, this means that the code coverage tool injects data collector calls into your source or byte code to record if a line was executed or not.
Offline Instrumentation Example (Clover)
Clover uses source code instrumentation but I only show you the decompiled code because it is easier to get the byte code.
The original method is the following:
public static void main(String[] args) {
    SpringApplication.run(CoverageDemoApplication.class, args);
}
After instrumenting-compiling-decompiling the code, we get something like this:
public static void main(String[] var0) {
    CoverageDemoApplication.__CLR4_1_144in3j646t.R.inc(4);
    CoverageDemoApplication.__CLR4_1_144in3j646t.R.inc(5);
    SpringApplication.run(CoverageDemoApplication.class, var0);
}
The instrumented code is a bit more sophisticated, here you can check the whole file: instrumented and decompiled code
Offline Instrumentation Demo Project
I created a GitHub repo where I hack the Gradle Clover plugin in order to see the instrumented files. So if you want the red pill, I can show you how deep the rabbit hole goes: what the Clover plugin does under the hood and how to get the instrumented class files: Offline instrumentation demo
On-the-fly Instrumentation
This instrumentation process happens on-the-fly during class loading by using a Java Agent or a special Class Loader so the source/byte code remains untouched.
Picking the "Right" Coverage Tool
This question becomes more interesting above unit testing level. For example, in order to run integration tests, you need to:
Start the application
Run the tests
Stop the application
This process is a bit more complicated than running unit tests. Suppose that we have a classic, servlet-based web application which runs in Tomcat (or in any other Servlet Container) and we want to measure the integration test coverage. In this case, the integration testing consists of the following steps:
Compile the code and create the application package (a war file in our case)
Start the app in Tomcat
Run the integration tests and track execution data
Stop the app
Generate report from the collected data
If our coverage tool instruments the code offline, we will end up with two packages: one for the test environments (in order to be able to measure test coverage) and one for non-testing environments (e.g.: production). Having different packages for the same application is something that we really want to avoid.
If our coverage tool instruments the code on-the-fly, we can deploy the same package to each of our environments. The only difference will be the configuration for the different environments, e.g.: an additional JVM option where we configure the coverage tool which seems much more convenient.
Demo Project
I created a GitHub repo to show this scenario in action. So here is what you need:
Separate source sets for unit- and functional tests: functionalTest.gradle
To use the JaCoCo plugin and get the JaCoCo Agent: jacoco.gradle
To deploy and undeploy the application using the agent: deploy.gradle
Configure the JaCoCo plugin to create coverage report for unit- and functional tests: jacoco.gradle, functionalTest.gradle
Configure the JaCoCo plugin to create a merged report which aggregates the coverage data of the unit- and functional tests: functionalTest.gradle
Wire up the tasks (set task dependencies)
So if you clone this repo and run ./gradlew build, you should see something like this in the console:
$ ./gradlew build

[...]
:jar
:bootRepackage
:assemble

:compileTestJava
[...]
:test

:unZipJacocoAgent
:deploy
:compileFunctionalTestJava
[...]
:functionalTest
:undeploy

:jacocoFunctionalTestReport
:jacocoTestReport
:jacocoMerge
:mergedReport
:check
:build
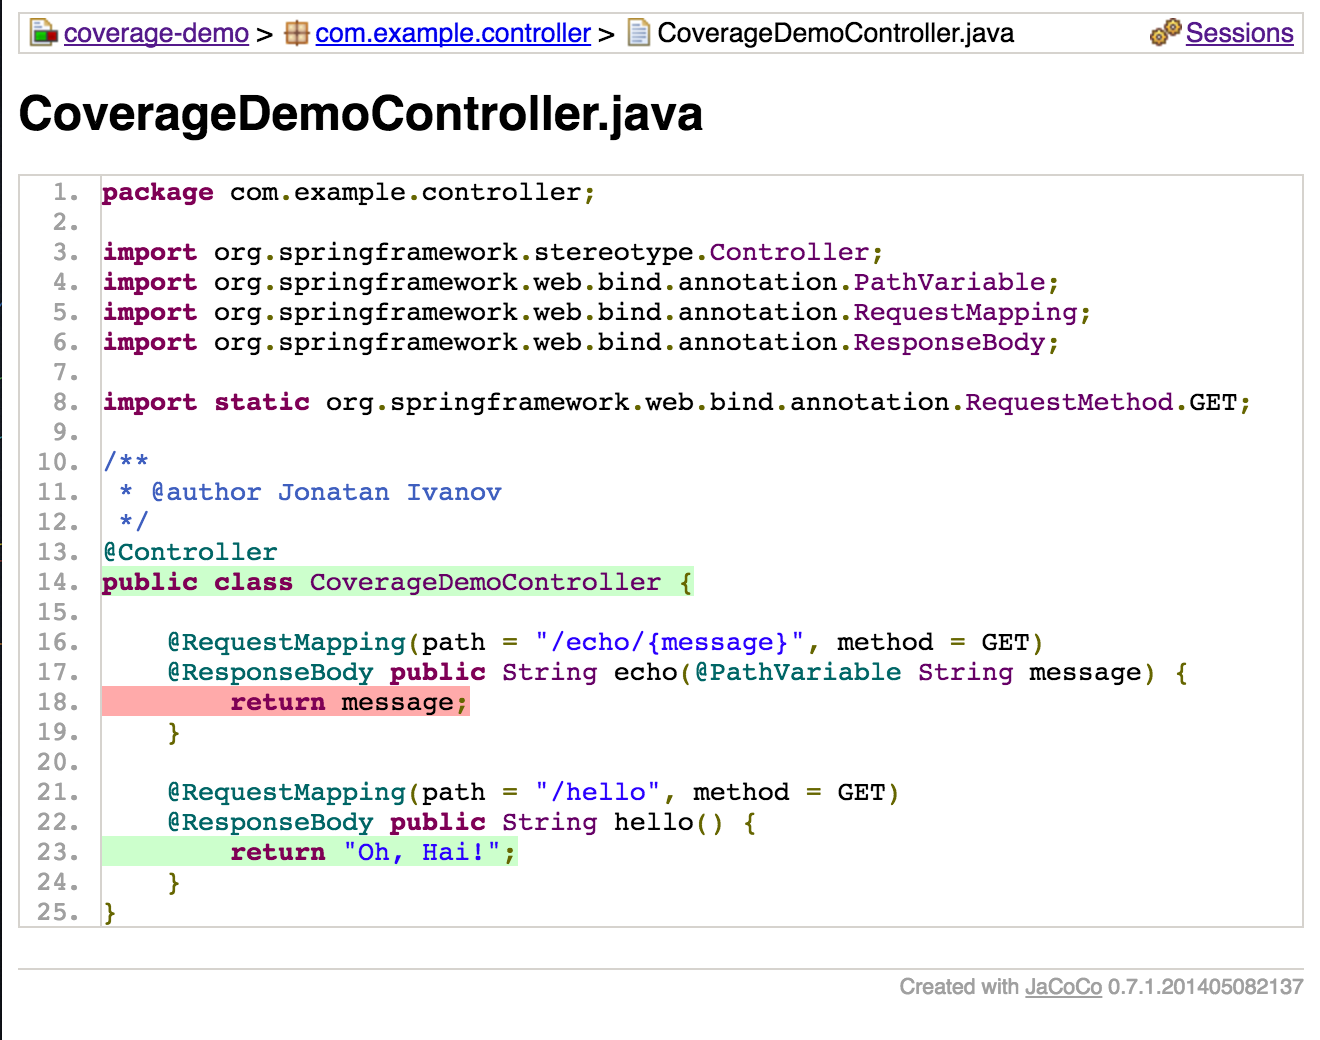
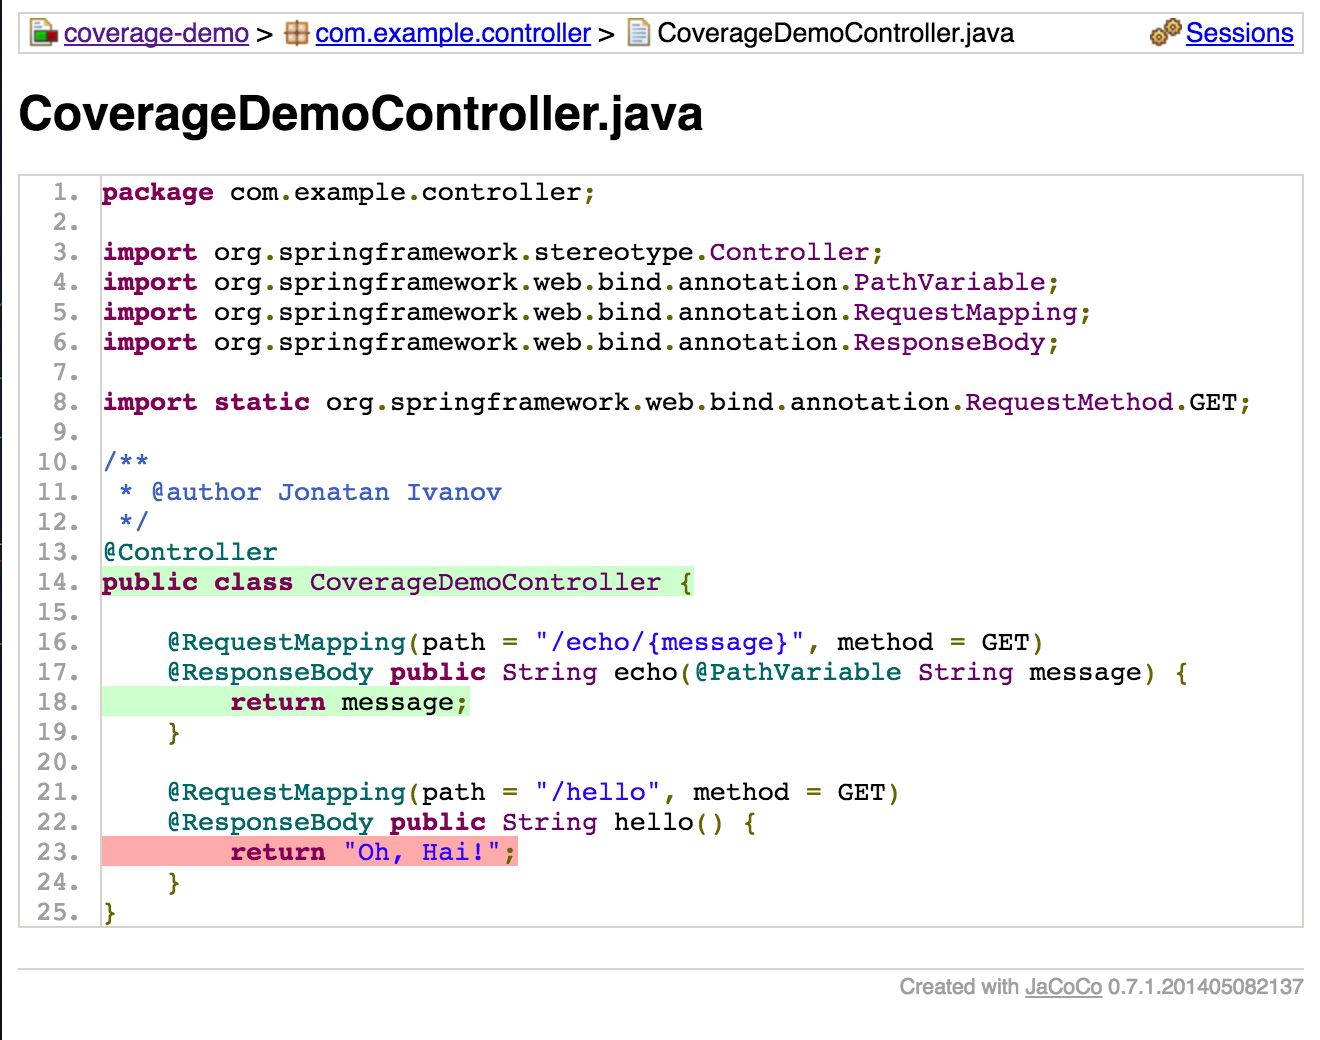
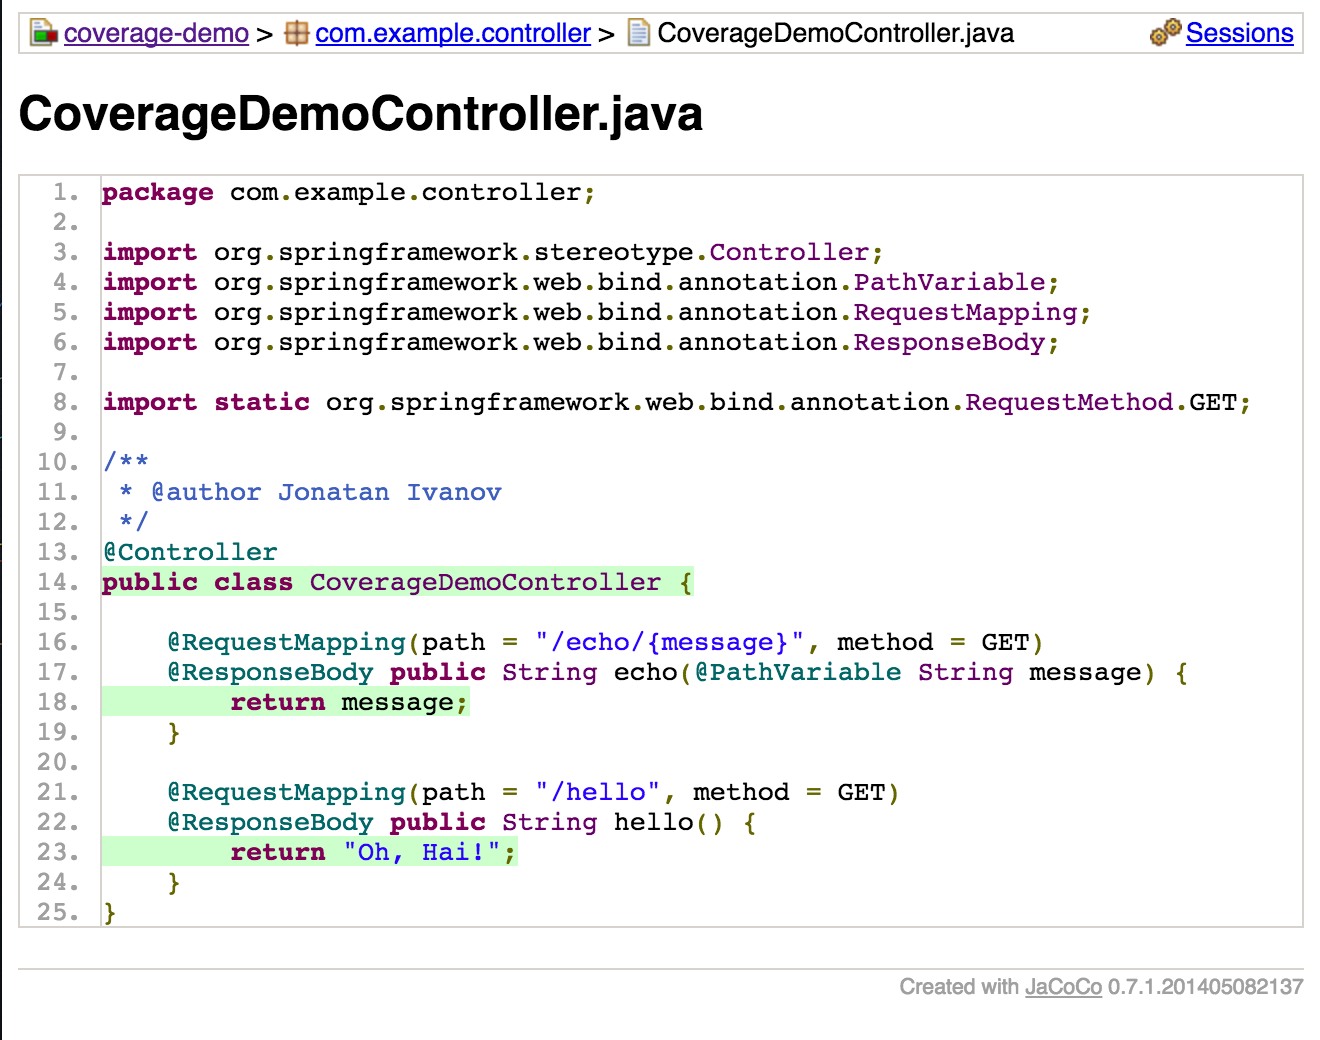
And you should see three reports in the build/reports/jacoco directory. Or in the resources directory of this repo.
Covered Lines (Unit Tests, Functional Tests, Merged)


Stats (Unit Tests, Functional Tests, Merged)


Featured image: vladstudio.com
Published at DZone with permission of Jonatan Ivanov. See the original article here.
Opinions expressed by DZone contributors are their own.

Comments