Building a Data Warehouse, Part 5: Application Development Options
Join the DZone community and get the full member experience.
Join For Freesee also:
- part i: when to build your data warehouse
- part ii: building a new schema
- part iii: location of your data warehouse
- part iv: extraction, transformation, and load
in part i we looked at the advantages of building a data warehouse independent of cubes/a bi system and in part ii we looked at how to architect a data warehouse’s table schema. in part iii, we looked at where to put the data warehouse tables. in part iv, we are going to look at how to populate those tables and keep them in sync with your oltp system. today, our last part in this series, we will take a quick look at the benefits of building the data warehouse before we need it for cubes and bi by exploring our reporting and other options.
as i said in part i, you should plan on building your data warehouse when you architect your system up front. doing so gives you a platform for building reports, or even application such as web sites off the aggregated data. as i mentioned in part ii, it is much easier to build a query and a report against the rolled up table than the oltp tables.
to demonstrate, i will make a quick pivot table using sql server 2008 r2 powerpivot for excel (or just powerpivot for short!). i have showed how to use powerpivot before on this blog , however, i usually was going against a sql server table, sql azure table, or an odata feed. today we will use a sql server table, but rather than build a powerpivot against the oltp data of northwind, we will use our new rolled up fact table.
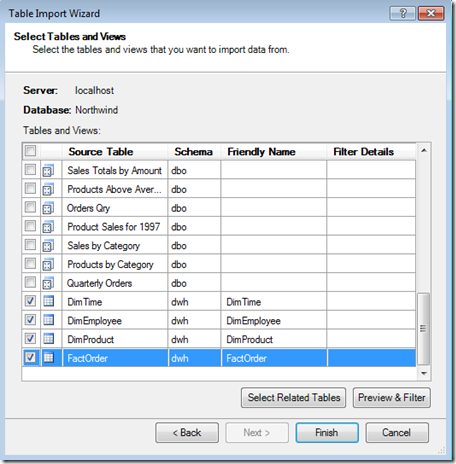
to get started, i will open up powerpivot and import data from the data warehouse i created in part ii. i will pull in the time, employee, and product dimension tables as well as the fact table.
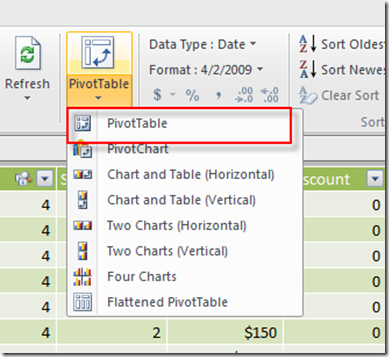
once the data is loaded into powerpivot, i am going to launch a new pivottable.
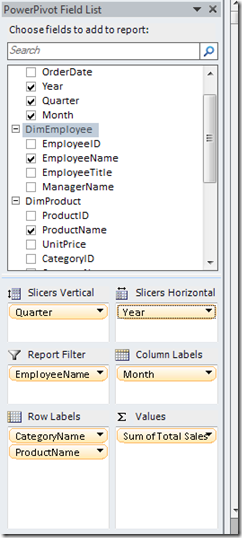
powerpivot understands the relationships between the dimension and fact tables and places the tables in the designed shown below. i am going to drag some fields into the boxes on the powerpivot designer to build a powerful and interactive pivot table. for rows i will choose the category and product hierarchy and sum on the total sales. i’ll make the columns (or pivot on this field) the month from the time dimension to get a sum of sales by category/product by month. i will also drag in year and quarter in my vertical and horizontal slicers for interactive filtering. lastly i will place the employee field in the report filter pane, giving the user the ability to filter by employee.
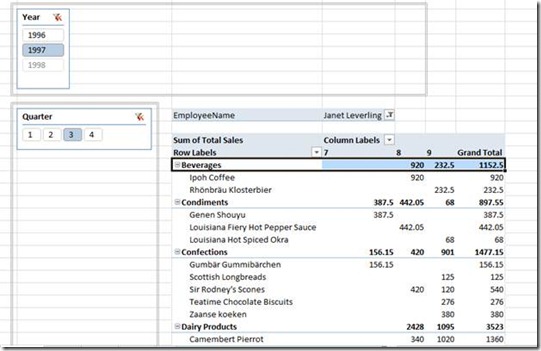
the results look like this, i am dynamically filtering by 1997, third quarter and employee name janet leverling.
this is a pretty powerful interactive report build in powerpivot using the four data warehouse tables. if there was no data warehouse, this pivot table would have been very hard for an end user to build. either they or a developer would have to perform joins to get the category and product hierarchy as well as more joins to get the order details and sum of the sales. in addition, the breakout and dynamic filtering by year and quarter, and display by month, are only possible by the dimtime table, so if there were no data warehouse tables, the user would have had to parse out those dateparts. just about the only thing the end user could have done without assistance from a developer or sophisticated query is the employee filter (and even that would have taken some powerpivot magic to display the employee name, unless the user did a join.)
of course pivot tables are not the only thing you can create from the data warehouse tables you can create reports, ad hoc query builders, web pages, and even an amazon style browse application. (amazon uses its data warehouse to display inventory and oltp to take your order.)
i hope you have enjoyed this series, enjoy your data warehousing.
Published at DZone with permission of John Cook, DZone MVB. See the original article here.
Opinions expressed by DZone contributors are their own.


Comments