Best Practices to Create High-Performant Applications in Mule 4
This article shares a few best practices that can help create high-performant applications in Mule 4 from both Infrastructure and Coding perspectives.
Join the DZone community and get the full member experience.
Join For FreeIn this blog, I would like to share a few best practices which can help in creating high-performant applications in Mule 4 from both Infrastructure and Coding perspectives.
I will start with Best Practices from an Infrastructure standpoint (we will look at only CloudHub 1.0 as a deployment option here), then I will take you through Best Practices from a Coding standpoint (achieved via API Manager or while implementing the APIs/Applications in Anypoint Studio).
Following good practices in Infrastructure comes with extra cost.
Most of the configuration details (only relevant to performance) shared here are taken from MuleSoft Documentation/Articles.
From Infrastructure Perspective
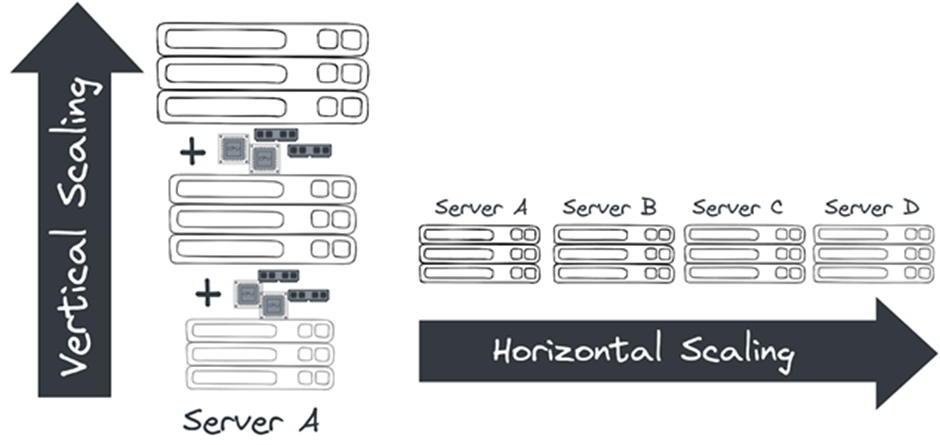
1. Vertical Scaling and Horizontal Scaling![]()
- By scaling up the worker node (by increasing the worker’s vCore size), CPU cores and memory are enhanced, thereby helping to enhance the performance of your deployed Mule application.
- By scaling out with additional worker node(s), new demands can be coped with by delegating and sharing the workload among several worker nodes, thereby enhancing the performance of your deployed Mule application.
2. CloudHub Autoscaling
This OOTB solution is ONLY for Enterprise License Agreement (ELA) customers. You can define policies that respond to CPU or memory usage thresholds by scaling up or scaling down the processing resources used by an application.
This is how you can configure Autoscaling in CloudHub:
- Click the Applications tab of Runtime Manager.
- Select an application deployed to CloudHub to open its panel.
- In the panel, click Manage Application.
- In the Settings section, select the Autoscaling tab.
You can see all existing Autoscaling policies, activate or deactivate them, create or delete them, and create associated Alerts on Runtime Manager; see below:
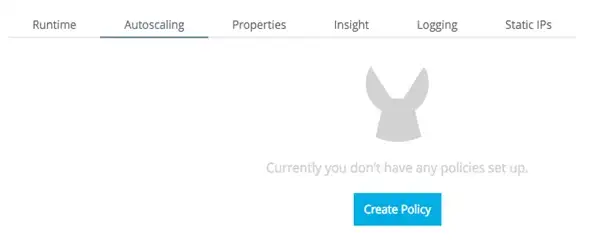
- Click the Create Policy button, then configure the fields to set your policy up.
- Provide a Name for your policy.
- Determine if the scaling will be based on Memory or CPU usage.
- Determine the Rules for your scaling. You must provide the following values for both the upscale and the downscale conditions:
- A usage percentage.
- A period of time throughout which this level must be sustained before the policy is applied.
- A cool-down period that blocks this and other policies from affecting scaling from being applied.
- Define what action will be performed when the policy is applied:
- If it will affect the number of workers or the size of them.
- Set a maximum and minimum value to fluctuate in between.
![Create]() 3. Load Balancing
3. Load Balancing
With Load Balancers in place, no worker bears heavy demand. Application responsiveness (performance) increases by spreading the work evenly in the load balancers.
CloudHub provides two types of load balancers:
- Shared Load Balancer (SLB) — CloudHub provides a default shared load balancer that is available in all environments.
- Dedicated Load Balancer (DLB) — Customers themselves can handle load balancing among the different workers.
Prefer DLB over SLB when it comes to better performance.
From Coding Perspective
1. Server Caching — Define Caching Policy in the API Manager.
This policy enables you to cache HTTP responses for reuse. Caching these responses speeds up the response time for user requests and reduces the load on the backend.
This policy can be configured in API Manager as follows:
- Select the policy version, then click on configure.

- In the next screen, add your cache key and other parameters like the below:
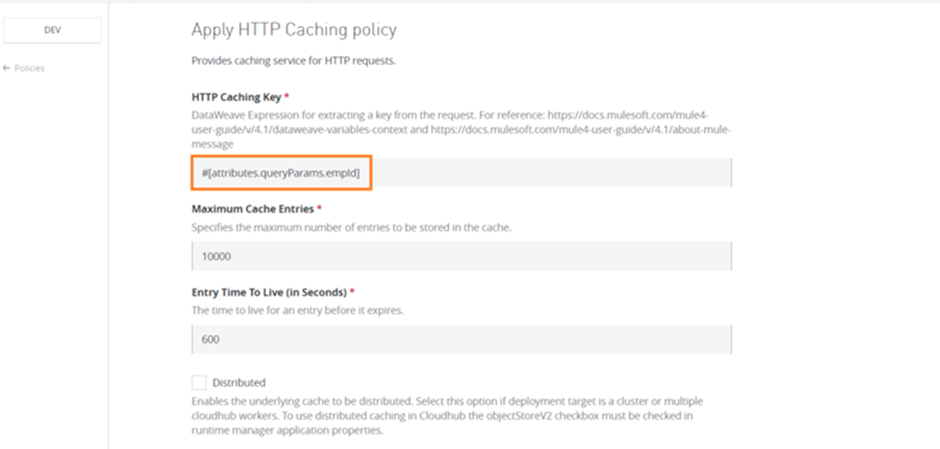
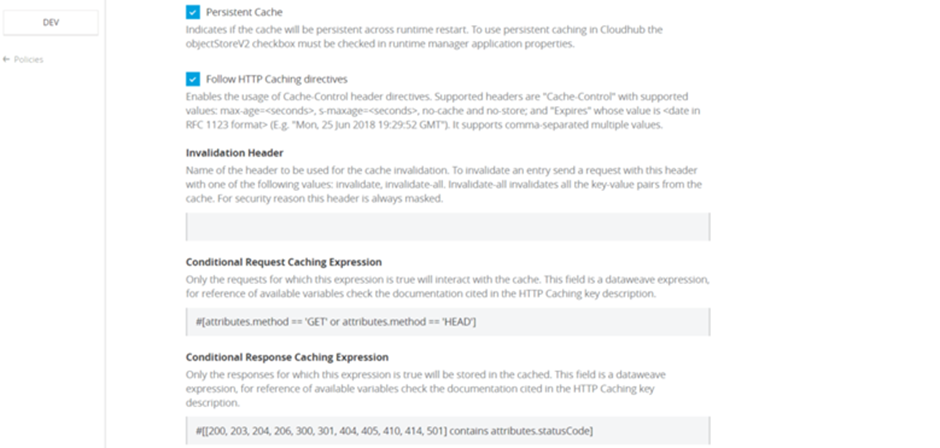
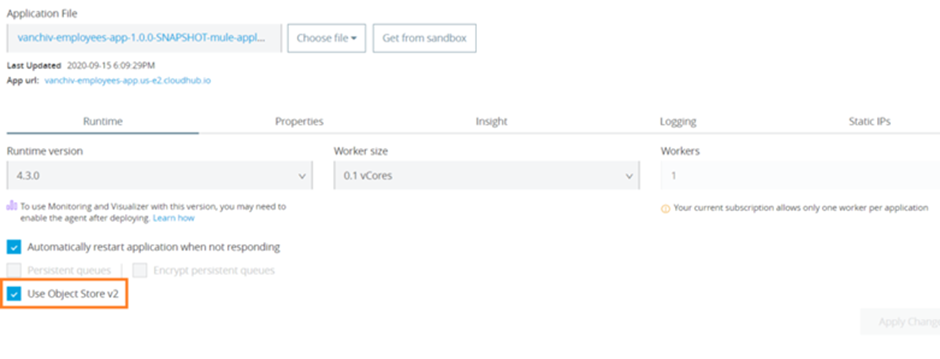
- If you want to use distributed or persistent cache, then you must check the Use Object Store V2 while deploying the application:
 2. Client Caching — Use Cache Scope.
You can use a Cache scope to reduce the processing load on the Mule Application and to increase the speed of message processing within a flow.
The Cache scope caches repeatable streams. It does not cache nonrepeatable streams, which can be read only once before they are lost.
This is how you can implement Cache Scope:

- In your Mule app, add a Cache scope to a flow.
- Click to open the General tab for the Cache scope.
- Configure the Cachescope:
- Provide a Display Name.
- Select a Caching Strategy.
- Opt to set up a filter for specific payloads if you need one.
- If the message matches the expression(s), Mule executes the Caching Strategy.
- If the message does not match expression(s), Mule processes the message through all message processors within the Cache scope but never saves or produces cached responses.
3. Asynchronous Processing — Use Async scope | Use Transient VM Queues
Use Async scope:
 Async scope can be configured by the below fields:
- Display Name (name): Name for the Async scope.
- Max Concurrency (maxConcurrency): Sets the maximum number of concurrent messages that the scope can process. By default, the container thread pool determines the maximum number of threads to use to optimize the performance when processing messages.
Use Transient VM Queues:
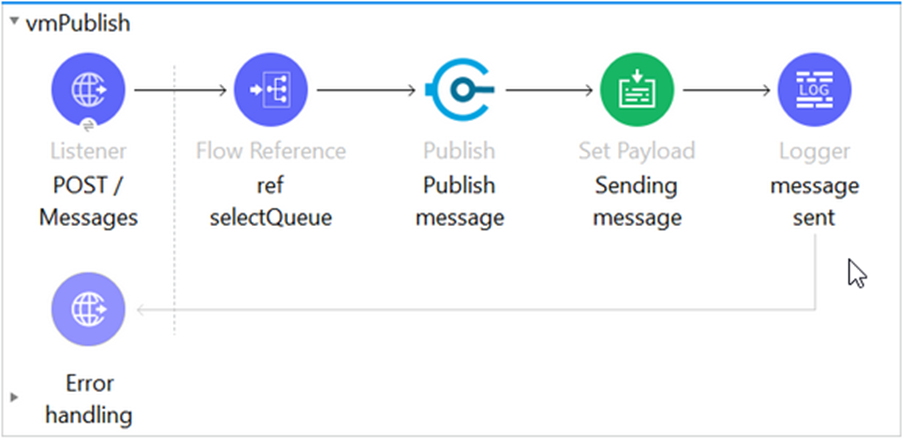 Instead of using Persistent VM Queues or External Third Party Message Brokers to handle user requests, Transient VM Queues are much faster because data is stored in memory, thereby enhancing application performance.
Transient Queues are not reliable when compared to other two.
4. Parallel Processing — Use Async scope | Use Parallel For Each scope | Use Batch job | Use Scatter-Gather router.
Use Async Scope
See above for more details on configuration.
Use Parallel For Each Scope
 This scope enables you to process a collection of messages by splitting the collection into parts that are parallelly processed in separate routes. After all, messages are processed, the results are aggregated following the same order they were in before the split.
Anypoint Studio versions prior to 7.6 do not provide this feature in the Mule Palette view.
The Parallel For Each scope can be configured using the below fields:
- Collection/Collection Expression (collection): Specifies the expression that defines the collection of parts to be processed in parallel. By default, it uses the incoming payload.
- Timeout (timeout): Specifies the timeout in milliseconds for each parallel route. By default, there is no timeout.
- Max Concurrency (maxConcurrency): Specifies the maximum level of parallelism for the router to use. By default, all routes run in parallel.
Use the Batch Job Component:
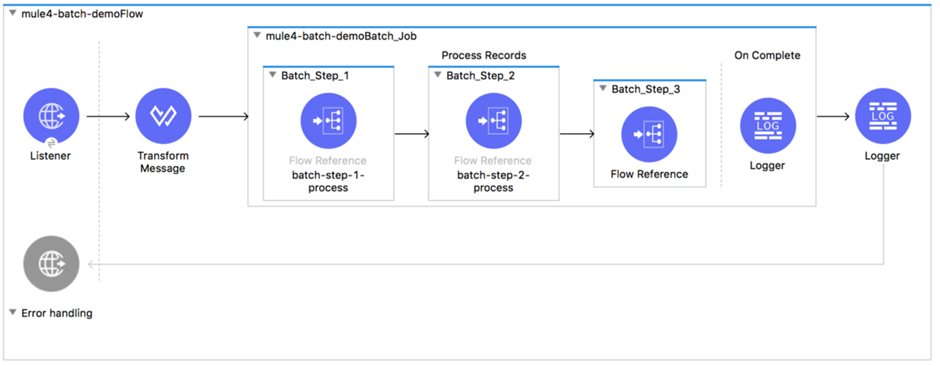
This component is designed for reliable, asynchronous processing of larger-than-memory data sets. It automatically splits source data and stores it into persistent queues, which makes it possible to process large data sets.
This component can be configured as follows:
- Filtering Records to Process within a Batch Step: To filter records, the Batch Step supports acceptExpression and acceptPolicy. Both are optional.
Sample code in XML:
<batch:job jobName="batchJob">
  <batch:process-records >
    <batch:step name="adultsOnlyStep" acceptExpression="#[payload.age > 21]">
      ...
    </batch:step>
  </batch:process-records>
</batch:job>

<batch:job jobName="batchJob">
  <batch:process-records >
   <batch:step name="batchStep1" >
      <!-- Check for contact -->
    ...
    </batch:step>
    <batch:step name="batchStep2" accept-policy="ONLY_FAILURES">
      <!-- Accept records that failed -->
    ...
    </batch:step>
  </batch:process-records>
</batch:job>- Performing Bulk Operations from a Batch Aggregator: Aggregation is useful for sending multiple records within an array to an external server. Within the Batch Aggregator component, you can add an operation, such as a bulk upsert, insert, or update operation, to load multiple records to a server with a single execution of an operation instead of running an operation separately on each record.
Sample code in XML:
<batch:job jobName="batchJob">
  <batch:process-records >
    <batch:step name="batchStep">
      <batch:aggregator size="200">
        <salesforce:upsert doc:name="Upsert" ... />
      </batch:aggregator>
    </batch:step>
  </batch:process-records>
</batch:job>- Changing the Record Block Size: To improve performance, Mule runtime queues and schedules batch records in blocks of up to 100 records per thread. This behavior reduces the number of I/O requests and improves an operation’s load. Batch jobs use Mule thread pools, so there is no default for the job. Each thread iterates through that block to process each record, and then each block is queued back, and the process continues.
Sample code in XML:
<batch:job jobName="batch_Job" blockSize="200">
  ...
</batch:job>- Setting a Max Concurrency Limit on Batch Job Instances: The Max Concurrency (maxConcurrency) field limits the number of record blocks to process concurrently.
Sample code in XML:
<batch:job jobName="test-batch" maxConcurrency="${batch.max.concurrency}">
...
</batch:job>
Use Scatter-Gather Router

The Scatter-Gather router component is a routing event processor that processes a Mule event through different parallel processing routes that contain different event processors. It executes each route in parallel, not sequentially. Parallel execution of routes can greatly increase the efficiency of your Mule application.
This component can be configured using these fields:
- Timeout (timeout): Sets the timeout for responses from sent messages in milliseconds. A value of 0 or lower than 0 means no timeout.
- Max Concurrency (maxConcurrency): Determines the maximum amount of concurrent routes to process. By default, all routes run in parallel. By setting this value to one, scatter-gather processes the routes sequentially.
5. Thread Management Tuning — Tune at Application-level and Server-level
Tuning (by configuring the thread pool) can be done both at Application-level, which works for all Runtime planes, as well as at Server-level, which works only for the On-Prem Runtime plane.
Tune at Application-Level
You can define the pooling strategy to use in an application.
Sample configuration:
<ee:scheduler-pools poolStrategy="UBER" gracefulShutdownTimeout="15000">
   <ee:cpu-light
           poolSize="2"
           queueSize="1024"/>
   <ee:io
           corePoolSize="1"
           maxPoolSize="2"
           queueSize="0"
           keepAlive="30000"/>
   <ee:cpu-intensive
           poolSize="4"
           queueSize="2048"/>
</ee:scheduler-pools>
The gracefulShutdownTimeout parameter specifies the maximum time (in milliseconds) to wait until all tasks in all the artifact thread pools have completed execution when stopping the scheduler service.
The configurable properties/fields are as follows:
- Pool Size (poolSize): The number of threads to keep in the pool, even if they are idle.
- Queue Size (queueSize): The size of the queue to use for holding tasks before they are executed.
- Core Pool Size (corePoolSize): The number of threads to keep in the pool.
- Max Pool Size (maxPoolSize): The maximum number of threads to allow in the pool.
- Keep Alive (keepAlive): When the number of threads in the pool is greater than the indicated core pool size, this value sets the maximum time (in milliseconds) for excess idle threads to wait for new tasks before terminating.
If you define pool configurations at the application level for Mule apps deployed to CloudHub, be mindful about worker sizes because fractional vCores have less memory.
Tune at Server-Level
Tuning can be done by editing MULE_HOME/conf/schedulers-pools.conf file in your local Mule instance.
Configure the org.mule.runtime.scheduler.SchedulerPoolStrategy parameter to switch between the two available strategies:
- UBER — Unified scheduling strategy. Default.
- DEDICATED — Separated pools strategy. Legacy.
Sample configuration:
# The strategy to be used for managing the thread pools that back the 3 types of schedulers in the Mule Runtime
# (cpu_light, cpu_intensive and I/O).
# Possible values are:
#    - UBER: All three scheduler types will be backed by one uber uber thread pool (default since 4.3.0)
#    - DEDICATED: Each scheduler type is backed by its own Thread pool (legacy mode to Mule 4.1.x and 4.2.x)

org.mule.runtime.scheduler.SchedulerPoolStrategy=UBER
When the strategy is set to UBER, the following configuration applies:
- org.mule.runtime.scheduler.uber.threadPool.coreSize=cores
- org.mule.runtime.scheduler.uber.threadPool.maxSize=max(2, cores + ((mem - 245760) / 5120))
- org.mule.runtime.scheduler.uber.workQueue.size=0
- org.mule.runtime.scheduler.uber.threadPool.threadKeepAlive=30000
When the strategy is set to DEDICATED, the parameters from the default UBER strategy are ignored. To enable this configuration, uncomment the following parameters in schedulers-pools.conf file:
- org.mule.runtime.scheduler.cpuLight.threadPool.size=2*cores
- org.mule.runtime.scheduler.cpuLight.workQueue.size=0
- org.mule.runtime.scheduler.io.threadPool.coreSize=cores
- org.mule.runtime.scheduler.io.threadPool.maxSize=max(2, cores + ((mem - 245760) / 5120))
- org.mule.runtime.scheduler.io.workQueue.size=0
- org.mule.runtime.scheduler.io.threadPool.threadKeepAlive=30000
- org.mule.runtime.scheduler.cpuIntensive.threadPool.size=2*cores
- org.mule.runtime.scheduler.cpuIntensive.workQueue.size=2*cores
6. Streaming Strategy — Use Repeatable In-Memory Streaming | Use Non-Repeatable Streaming
Use Repeatable In-Memory Streaming
This is the default configuration for the Mule Kernel. It can be configured using the following parameters:
- Initial Buffer Size (initialBufferSize): Amount of memory allocated to consume the stream and provide random access to it. If the stream contains more data than fits into this buffer, the memory expands according to the bufferSizeIncrement attribute, with an upper limit of maxInMemorySize. Defaults to 256.
- Buffer Size Increment (bufferSizeIncrement): Amount to expand the buffer size if the size of the stream exceeds the initial buffer size. Setting a value of zero or lower indicates that the buffer does not expand and that a STREAM_MAXIMUM_SIZE_EXCEEDED error is raised when the buffer is full. Defaults to 256.
- Max In Memory Size (maxInMemorySize): Maximum amount of memory to use. If the size of the stream exceeds the maximum, a STREAM_MAXIMUM_SIZE_EXCEEDED error is raised. A value lower or equal to zero means no limit. Defaults to 1024.
- Buffer Unit (bufferUnit): The unit in which all these parameters are expressed. Possible values: BYTE, KB, MB, GB.
Use Non-Repeatable Streaming
This can be enabled by disabling repeatable streaming, which means that the stream can only be read once.
Use this option only if you are certain that there is no need to consume the stream several times and only if you need a very tight optimization for performance and resource consumption.
7. State Management — Use Transient Object Store (OS) | Use Transient VM Queues
Use Transient Object Store (OS)
While configuring OS, do not select the Persistent checkbox, which makes OS data be stored in memory. The remaining fields can be configured as per your requirements.

Use Transient VM Queues
Same as above under Asynchronous Processing.
8. Clustering — Use Primary Node Only configuration.

This flag decides whether to execute the source operation (JMS Message listener or JMS Message consume) on only the primary node when running mule instances in a cluster.
Uncheck this flag so that JMS consumers on all cluster nodes can receive messages from the queue, thereby enhancing the performance of the deployed application.
This option doesn't work in CloudHub, but works only in Clustered environment.
9. Validations — Make Validations fail-fast.
A fail-fast system is one that immediately reports at its interface any condition that is likely to indicate a failure. Fail-fast systems are usually designed to stop normal operation rather than attempt to continue a possibly flawed process.
Make sure failed validations fail fast so that there is no further processing, which otherwise can be time-consuming, hence improving the overall performance of the application.
10.JMS Tuning — Disable Message persistent | Uncheck Primary node only | Use DUPS_OK or IMMEDIATE Acks | Configure Redelivery policy | Avoid Selector | Use Caching strategy | Increase Concurrent messages processing
Disable Message Persistent
In JMS Config, unselect/uncheck Persistent delivery field. This avoids persisting messages but keeps messages only in memory, thereby improving the performance of the application.

Uncheck the Primary Node Only
In the JMS Connector in the On New Message source, set this field to false so that JMS consumers on all cluster nodes can receive messages from the queue, thereby enhancing the performance of the deployed application.

Use DUPS_OK or IMMEDIATE Acks
DUPS_OK — This mode automatically acknowledges bulk messages (duplicate messages if the message is redelivered multiple times before the ACK is performed).
IMMEDIATE — This mode automatically acknowledges (ACK) the message after it is consumed and before any application processing of the message.
These modes can significantly enhance the overall performance of the application.
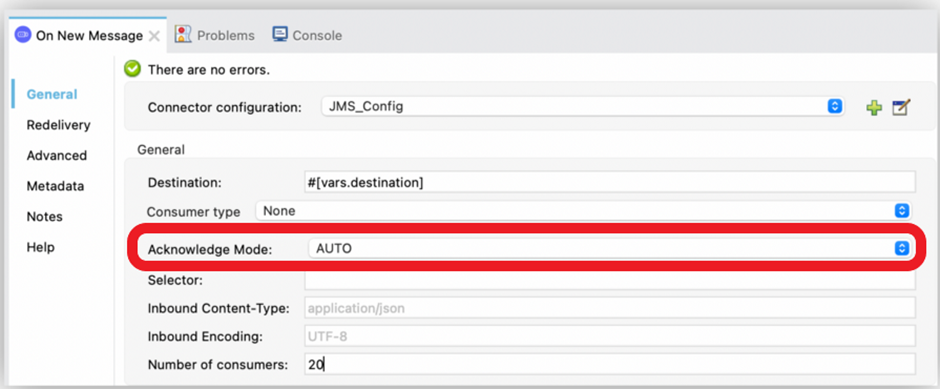
Configure Redelivery Policy
A redelivery policy is a filter that helps you conserve resources by limiting the number of times the Mule runtime engine (Mule) executes messages that generate errors. You can configure Max Redelivery Count (maxRedelivery) in JMS Config (see below).
Avoid Selector Field
Avoid setting the selection expression for the Selector field (field to filter incoming messages) in JMS Config (see below).

Use Caching Strategy
Because connections are expensive to create, reuse them as much as you can. By default, JMS Connector uses a caching strategy that reuses as many consumers and producers as possible. To avoid performance degradation, do not disable connection caching.

Increase Concurrent Messages Processing
To improve the performance of your application, increase the number of consumers that receive messages from the same destination. This can be done by configuring the Number of consumers field in the On New Message source. By default, this source enables four consumers to receive messages concurrently on the same destination.
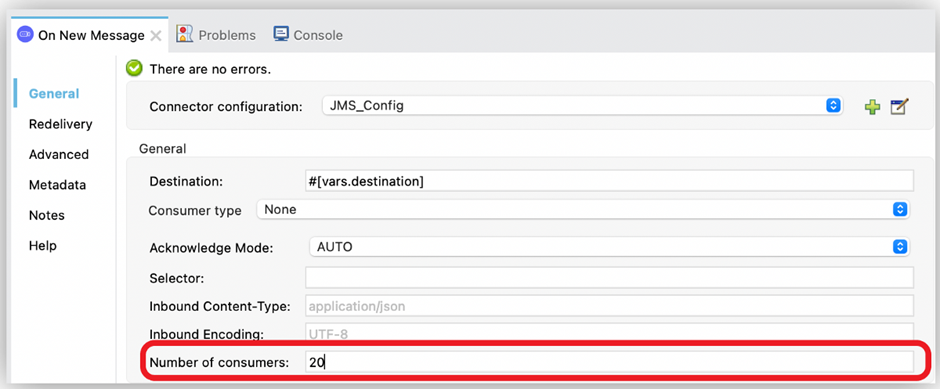
11. HTTP Request Configuration — Enable HTTP keep-alive header.
HTTP keep-alive (HTTP persistent connection) is an instruction that allows a single TCP connection to remain open for multiple HTTP requests/responses. By default, HTTP connections close after each request. HTTP keep-alive decreases latency for 2nd, 3rd,… HTTP requests and decreases network traffic. It also reduces both CPU and memory usage on your server.
To enable HTTP keep-alive in HTTP Request configuration, tick the checkbox Use persistent connections and set a value greater than 0 for the Connection idle timeout field.

12. API Policies — Enable Rate Limiting and Spike Control policies.
Enable Rate Limiting Policy
This policy enables you to control the incoming traffic to an API by limiting the number of requests that the API can receive within a given period of time. After the limit is reached, the policy rejects all requests, thereby avoiding any additional load on the backend API, which otherwise can degrade the performance of the API/Application.
Sample configuration:
- policyRef:
    name: rate-limiting-flex
  config:
    rateLimits:
      - maximumRequests: 3
        timePeriodInMilliseconds: 6000
    keySelector: "#[attributes.method]"
    exposeHeaders: true
    clusterizable: false
Enable Spike Control Policy
This policy regulates your API request traffic by limiting the number of messages processed by an API. The policy ensures that the number of messages processed within a specified time does not exceed the limit that you configure. If the number is exceeded, the request is queued for retry based on you have configured the policy.
Sample configuration:
- policyRef:
    name: spike-control-flex
  config:
    queuingLimit: 0
    exposeHeaders: true
    delayTimeInMillis: 1000
    timePeriodInMilliseconds: 1000
    delayAttempts: 1
    maximumRequests: 100000
13. Logging — Use Asynchronous logging | Do not log huge data
Use Asynchronous Logging
When logging asynchronously, the logging operation occurs in a separate thread, so the actual processing of your message won’t be delayed waiting for the logging to complete:

Using Asynchronous logging brings a substantial improvement in the throughput and latency of message processing.
Do Not Log Huge Data
Always make sure to not log big, huge data at the INFO level; rather, log the same data at DEBUG level, if required.
14. HTTP Configuration — Use private ports (8091/8092)
As private ports work with one’s organization network (LAN), accessing via private ports is much faster. Hence configure private ports mostly for Process APIs (PAPIs) and System APIs (SAPIs).
15. Database Configuration — Use Connection pooling | Use Streaming for large results
Use Connection Pooling
Connection pooling means that connections are reused rather than created each time a connection is requested.
- Configuring a pool within the DB configuration.
Sample code in XML:
<db:mysql-config name="dbConfig" host="localhost" port="3306" user="root" password="" database="esb" doc:name="MySQL Configuration">
        <db:pooling-profile maxPoolSize="17" minPoolSize="13" />
</db:mysql-config>- Referencing a specific pooling library from a generic DB configuration.
Sample code in XML:
<spring:bean id="jdbcDataSource" class="org.apache.commons.dbcp.BasicDataSource" destroy-method="close">
        <spring:property name="driverClassName" value="com.mysql.jdbc.Driver" />
        <spring:property name="url" value="jdbc:mysql://localhost:3306/esb?user=root&password=" />
        <spring:property name="maxActive" value="17" />
</spring:bean

<db:generic-config name="dbConfig" dataSource-ref="jdbcDataSource" doc:name="Generic Database Configuration"  />
Use Streaming for Large Results
Streaming is the best solution to use when fetching large result sets (tens of thousands of records) from a single DB query.
You need to configure these fields in the Select operation under the Advanced tab:

- Max Rows — Use to define the maximum number of rows your application accepts in a response from a database.
- Fetch Size — Indicates how many rows should be fetched from the resultSet. This property is required when streaming is true; the default value is 10.
- Streaming — Enable to facilitate streaming content through the Database Connector to the database. Mule reads data from the database in chunks of records instead of loading the full result set into memory.
15. JVM Tuning — Tune at Server-level and Application-level
Tuning can be done both at Application-level, which works only for RTF, as well as at Server-level, which works only for On-Prem.
Tune at Server-Level
Tuning can be done by editing MULE_HOME/conf/wrapper.conf file in your local Mule instance.
The wrapper.conf file will be overwritten with the contents of wrapper.conf.template during the deployment phase. So you need to add your changes to wrapper.conf.template file instead, otherwise your changes will be discarded.
Tune at Application-Level
You can configure the JVM arguments in RTF via Runtime Manager UI or AMC Application Manager API with a PATCH request.
For more info, refer here.
16. Data Compression — Use the Compression module
If you are dealing with a large payload, you have a size limit on payload transfer, or need to extract some files or create a zip file; the Compression module is the best solution.
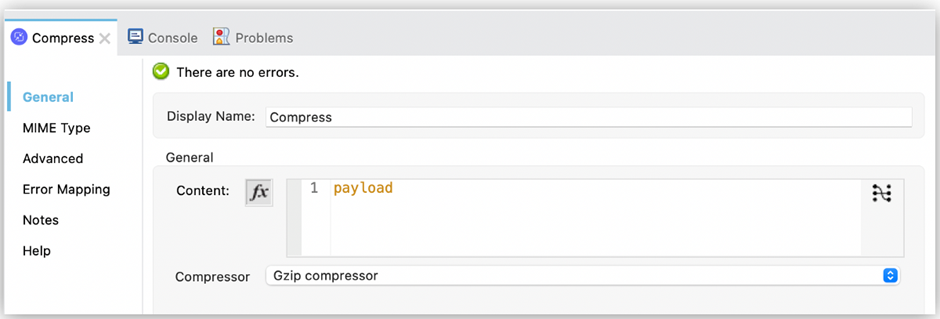
This module provides two compressor techniques:
- Zip Compressor.
- GZip Compressor.
17. Code Refining
- Instead of repeatedly using the Java module to reuse code such as Java libraries, create an SDK module with operations that wrap up Java invocations.
- Use DataWeave to transform or enrich data, and create payloads instead of custom scripting code such as Java and Groovy.
- Use Subflows instead of Private flows, as Subflows are lighter than Private flows.
- Use Remove Variable component to remove a variable (unwanted variable) from the Mule event. This avoids unwanted variables lying around inside memory until JVM Garbage Collector reclaims them.
- Use Bulk operation connectors wherever available.
Conclusion
To begin with, the developer can refer to this list to build Performant Mule 4 applications. Before going with any of the good practices, you need to trade-off between what is that you need the most and what you don't need. For example, Transient VM Queues can enhance performance, but, at the same time, it is not reliable, so you need to decide whether you want performance or reliability the most.
Thank you for reading! Hope you find this article helpful in whatever possible. Please feel free to share your thoughts in the comments section.
Published at DZone with permission of PRAVEEN SUNDAR. See the original article here.
Opinions expressed by DZone contributors are their own.

 3. Load Balancing
Comments