Best JavaScript Chart Libraries 2024: Finding the Right Fit for Your JS Applications
Discover the top free/paid JavaScript Charts of 2024 by comparing licensing options and pricing. Find how to choose the best library for your app's unique needs.
Join the DZone community and get the full member experience.
Join For FreeAs the new year approaches, I’d like to review the landscape for JavaScript Chart libraries in 2024. Javascript is a popular language used by millions of applications worldwide. There are many Javascript chart libraries available, and choosing the right one can be a difficult decision. “Best” is a subjective term, so we’re going to explore which selection criteria to apply for your specific needs, whether that’s ease of use, big data, complexity, or simplicity.
A Brief Overview of the JavaScript Chart Library Landscape in 2024
Searching on npm.js for ‘Chart‘ yields 6,000 packages. The most popular appear at the top of the search, which includes chart.js with almost 2 million downloads per week, recharts; a popular react JS chart library, d3.js; a popular (but complex) raw SVG data-visualization library, ApexCharts, Plotly, SciChart and more.
Which JavaScript Charts Are Free/Paid?
There are many free open-source JavaScript Charts available, including ApexCharts, C3.js, Chart.js, D3.js, DyGraphs, eCharts, Google Charts, NVD3, Plotly.js, TauCharts and uPlot.
Likewise, there are many commercial JavaScript Charts, including amCharts, AnyChart, CanvasJS, DevExpress JS Chart, FusionCharts, HighCharts, Kendo UI charts, LightningChart, SciChart, Syncfusion JS Essentials, ZingChart, and ZoomChart. Many of the paid editions, such as SciChart, offer a free community edition for non-commercial use, but some have a more complex ‘quote me’ option.
Pricing Comparison of 21 Different JavaScript Charts in 2024
Below are the pricing and licensing for the top free and paid JavaScript charts:
| javascript Chart | Free non-commercial? | Free commercial? | Min Price* | Max Price* |
|---|---|---|---|---|
| AnyChart | FREE | PAID | $49 | $5996 |
| amCharts | FREE | PAID | $90 | $7435 |
| ApexCharts | FREE | FREE | $0 | $0 |
| Chart JS | FREE | FREE | $0 | $0 |
| D3.js | FREE | FREE | $0 | $0 |
| DevExpress | NO – Trial only | PAID | $899 | $2199 |
| DyGraphs | FREE | FREE | $0 | $0 |
| eCharts | FREE | FREE | $0 | $0 |
| FusionCharts | FREE | PAID | $1099 | $8399 |
| Google Charts | FREE | FREE | $0 | $0 |
| HighCharts | FREE ** | PAID | $368 | $6394*** |
| KendoUI Charts | FREE | PAID | $1049 | $2199 |
| LightningChart | NO – Trial only | PAID | $2500 | $3790*** |
| NVD3 | FREE | FREE | $0 | $0 |
| Plotly.js | FREE | FREE | $0 | $0 |
| Plottable.js | FREE | FREE | $0 | $0 |
| SciChart | FREE | PAID | $999 | $3999 |
| TauCharts | FREE | FREE | $0 | $0 |
| uPlot | FREE | FREE | $0 | $0 |
| ZingChart | FREE | PAID | $299 | $9999 |
| ZoomCharts | NO – Trial only | PAID | $Quote | $Quote** |
- * MinPrice / MaxPrice is simply the minimum available price for a perpetual license from the store and the maximum price when all options are checked. This may not reflect a like-for-like comparison as some vendors offer different licensing terms or team types. Price data was sampled on 30-Dec-2023.
- ** Some Free non-commercial editions require you to contact to fill out a form
- *** Prices marked with a ‘***’ have a contact-us for enterprise or higher-tiered pricing
Researching the Best JavaScript Chart
With all the available options for free and paid libraries, it certainly isn’t an easy task to choose a JavaScript Chart for your application! This is why many turn to Google to search ‘Best JavaScript Chart Library‘ to read recommendations from fellow developers. However, this also doesn’t narrow down your search very much, and most don’t take your project needs into account.

This search yields several comparison blog posts which mostly repeat the same packages, ordered by popularity and with some feature detail.
The Most Useful Comparison of JavaScript Charts
There is one comparison post in particular that I found helpful.
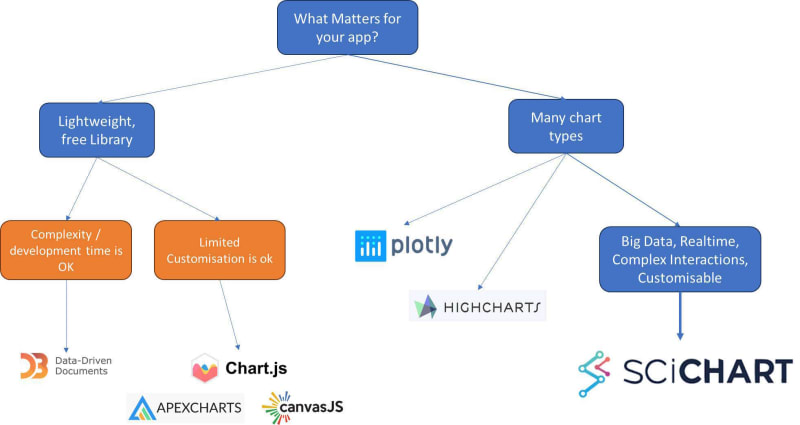
This blog included a flow chart of why and when you would use certain chart libraries.
The blog summarised: “What matters for your project.”
- If a lightweight library but perhaps with limited customization options, choose chart.js.
- For a library with many chart types but potentially heavier, choose Plotly.js or HighCharts.
- However, this article is a little out of date. We’d like to introduce a new category: Advanced, Big-Data, Real-time, or complex charts.

Advanced, Big-Data, Real-Time, or Complex Charts
There’s an emerging gap in the market. More than just supporting many chart types, there is another subset of JS applications that require:
- Big Data
- Large datasets
- High Performance
- Realtime Streaming
- Complex interactions
- Deep customization
Perhaps the application could be in the scientific, engineering, medical, or financial field and include realtime ECG viewers telemetry in aerospace and motorsport. Control systems and even oil and gas well site data visualization.
More and more desktop applications are being converted to JavaScript with its abundance of developers, resources, and info on the web. However, former developers of desktop apps are used to high-performance and deep customization options that were previously available to them.
Understanding Your Needs: Why One Size Doesn’t Fit All in JS Chart Libraries
“Best” is a subjective term. Understanding your specific needs is the key to selecting the best chart library. If you’re trying to display simple weather data on a website, Chart.js is a great choice, but if you want to create a novel rocket telemetry system or develop a chart-driven analysis tool, you’ll have to use SciChart.
Applications can have diversity in requirements, and in these cases, you use the right tool for the job.
- Scale of data: The volume and complexity of data vary significantly from one application to another. A library that handles large-scale, real-time big data efficiently, like SciChart, might be overkill for a project with simpler, static data sets. Likewise, many open-source charts can’t handle datasets larger than ~1,000 points.
- Type of visualizations: Different projects may require different types of charts. While some applications need basic bar or line charts, others might need sophisticated, interactive dashboards, financial charts, linked charts, or 3D visualizations.
- User interaction: The level of interactivity required can also influence your choice. Some applications demand dynamic, clickable charts that offer drill-down features, whereas others may only need static, informational visualizations.
Integration and Compatibility
Other selection criteria require you to look at compatibility with your tech stack.
- Compatibility with tech stack: Ensuring that the chart library integrates seamlessly with your current tech stack (like React, Angular, or Vue) is crucial.
- Responsive and mobile-friendly: With the increasing use of mobile devices, choosing a library that offers responsive and mobile-friendly charts is essential.
Performance and Efficiency
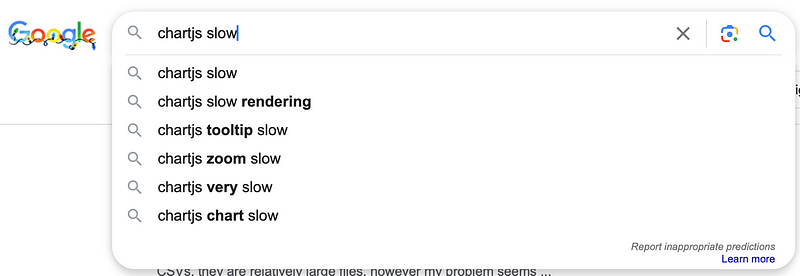
- Rendering performance: For applications that handle complex or large datasets, the rendering speed of the chart library can significantly impact user experience. Many searches, such as "Plotly is slow" or "Chart JS is slow," reveal that this is a big problem in some applications.

- Resource efficiency: Consider the library’s impact on overall application performance, especially for resource-constrained environments like embedded systems or mobile applications. This can impact not only application performance but also hardware costs, where a more efficient chart library can be run on lower-cost hardware.
Customization and Extensibility
Further criteria you might want to select a JS chart on:
- Styling and branding: The ability to customize the look and feel of the charts. A consistent look and feel is not only necessary for enterprise branding but also for minimizing errors in a healthcare setting.
- Extensibility: Some projects may require extending the library with custom functionality.
- Cost and licensing: Not all projects have the budget for paid chart libraries, making cost an important factor. Nevertheless, sometimes, the cost of customizing an open-source library for specific needs can outweigh the licensing cost. Likewise, maintaining an in-house solution can be equally expensive.
- Open source vs. commercial: Open-source libraries offer flexibility and community support, while commercial libraries often come with dedicated support and additional features helping to eliminate risk.
Why Did We Decide To Write SciChart.js?
A new subset of applications is emerging that have demanding requirements. These applications may be in Formula One telemetry, Rocket telemetry or Aerospace, Medical devices that run JS ECG/EKG style charts on an embedded device, Industrial processes, and life sciences, or financial applications pushing the boundary of what is possible today in JavaScript.
Big data is getting bigger and bigger. Charting applications are getting more complex. Big data visualization is more of a challenge today than five years ago, and in five years time will be an even bigger challenge.
These applications formerly existed as desktop apps, but as JavaScript becomes more popular, they are beginning to migrate to the browser.
All the available JS Chart options are built on the same technology: SVG or HTML5 canvas.
- Very few are using WebGL
- Very few are using data virtualization techniques
- None are using advanced technology such as WebAssembly
- None are combining the above to create charts that are not only fast and powerful but also flexible, customizable, and infinitely configurable.
SciChart’s new JavaScript Chart Library combines all of the above.
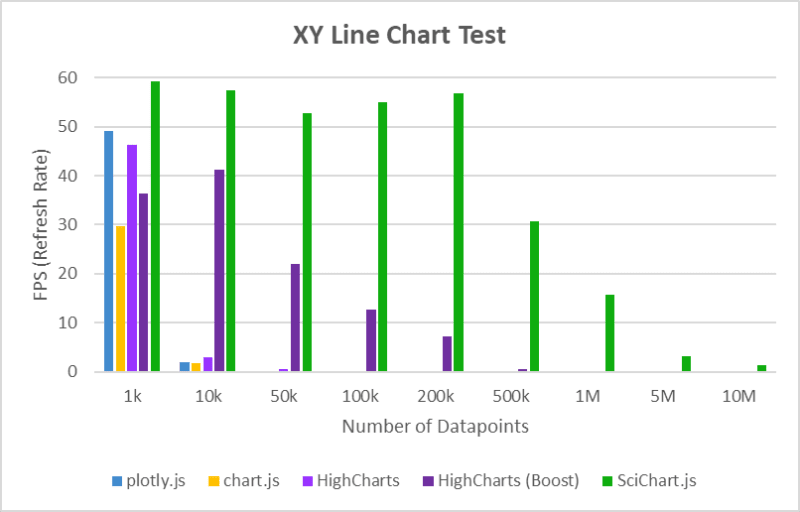
Literally, nothing can match the performance of SciChart.js for big data, whilst maintaining a flexible and deeply configurable library. It’s the topic of a separate blog post, but check out how much the performance of SciChart.js differs from Plotly, HighCharts, and chart.js for datasets up to millions of rows.

Performance alone isn’t a reason to choose a chart library, so other benefits SciChart brings to the table include deep configurability for complex apps, the ability to write your own interactions, and link charts for custom dashboards and analytics.
Which Is the Best JavaScript Chart in 2024?
There are plenty of JavaScript charting and data visualization options out there, and you may find yourselves today looking for the 'Best JavaScript Chart' — but I answer that question with a question. "Best for what?"
"Best for What?"
- Best for simplicity? Consider a basic option such as Chart JS
- Best price? Consider a free, open-source option such as Canvas JS, ApexCharts, Plotly.js
- Best configurability? Choose D3.js with deep configuration at the expense of complexity, performance, and development time.
- Best for advanced, big data, real-time streaming, or complex charts? Choose SciChart.js
The Future of JavaScript Chart Libraries: Trends and Predictions
Big data is getting bigger and bigger. Big data visualization is more of a challenge today than five years ago, and in five years time will be an even bigger challenge. The trend of more complex data-visualization as desktop apps migrate to JavaScript will continue.
I'm going to expand on this in future blog posts, where I'll give my thoughts on the future of JavaScript charts and the industry and why bigger data and more complex data visualization are here to stay.
Published at DZone with permission of Andrew Burnett-Thompson. See the original article here.
Opinions expressed by DZone contributors are their own.

Comments