AWS CloudTrail Log Analysis With the ELK Stack
CloudTrail is a useful tool for monitoring access and usage of your AWS-based IT environment. You can find lots of valuable information in the data with Kibana.
Join the DZone community and get the full member experience.
Join For FreeCloudTrail records all the activity in your AWS environment, allowing you to monitor who is doing what, when, and where. Every API call to an AWS account is logged by CloudTrail in real time. The information recorded includes the identity of the user, the time of the call, the source, the request parameters, and the returned components.
By default, CloudTrail logs are aggregated per region and then redirected to an S3 bucket (compressed JSON files). You can then use the recorded logs to analyze calls and take action accordingly. Of course, you can access these logs on S3 directly, but even a small AWS environment will generate hundreds of compressed log files every day which makes analyzing this data a real challenge.
Shipping these logs into the ELK Stack will allow you to tackle this challenge by giving you the ability to easily aggregate, analyze and visualize the data.
Let’s take a look at how to set up this integration.
Enabling Cloudtrail
If you haven’t already, start by opening your CloudTrail console and adding a new trail (one trail is offered by AWS for free; additional trails will entail a cost).
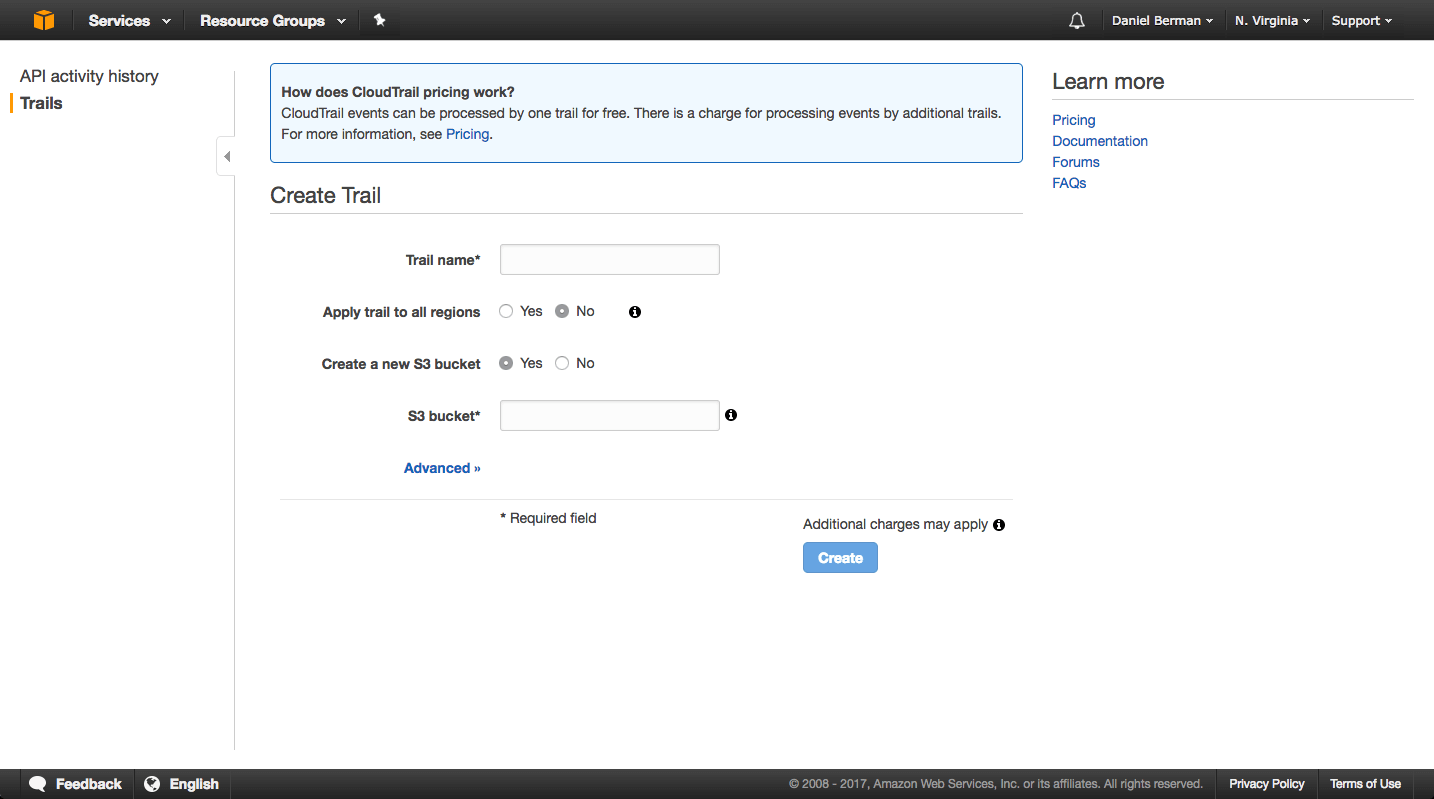
You will be required to name the trail and the S3 bucket you wish to ship the logs to. You will also need to decide whether you want to trail activity in all AWS regions or just the current region. I recommend starting out with a trail for one single region.
Advanced settings will allow you to enable encryption and SNS usage.
Once created, CloudTrail will begin recording API actions and sending the logs to the defined S3 bucket.
Shipping Into ELK
Once in S3, there are a number of ways to get the data into the ELK Stack.
If you are using Logz.io, you can ingest the data directly from the S3 bucket, and parsing will be applied automatically before the data is indexed by Elasticsearch. If you are using your own ELK deployment, you can use a variety of different shipping methods to get Logstash to pull and enhance the logs.
Let’s take a look at these two methods.
Using Logz.io
To ship into the Logz.io ELK Stack, all you have to do is configure the S3 bucket in which the logs are stored in the Logz.io UI. Before you do so, make sure the bucket has the correct ListBucket and GetObject policies as described here.
Under Log Shipping, open the AWS > CloudTrail tab. Enter the name of the S3 bucket, the path to the directory containing the logs and the IAM user credentials (access key and secret key), and click Save to apply the configuration.
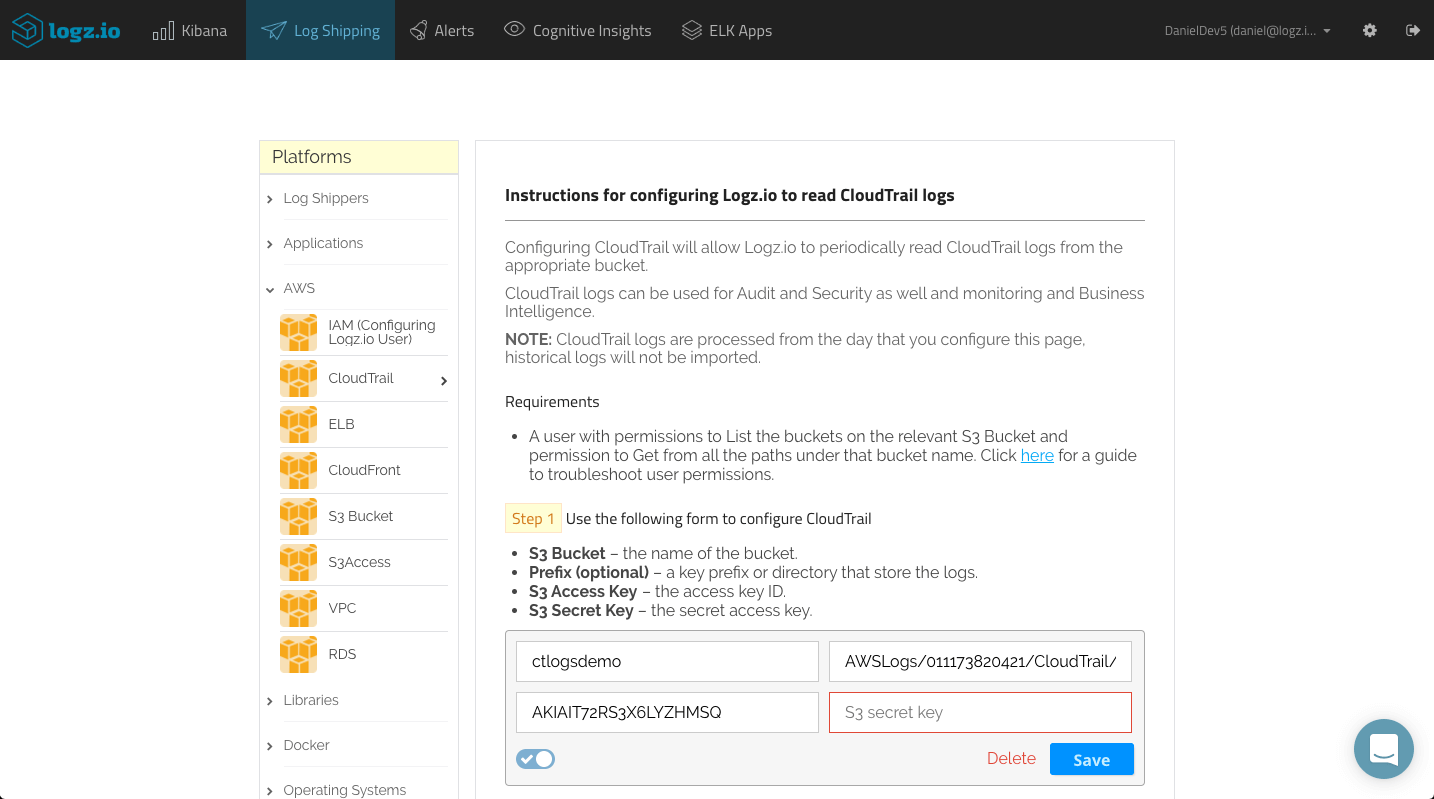
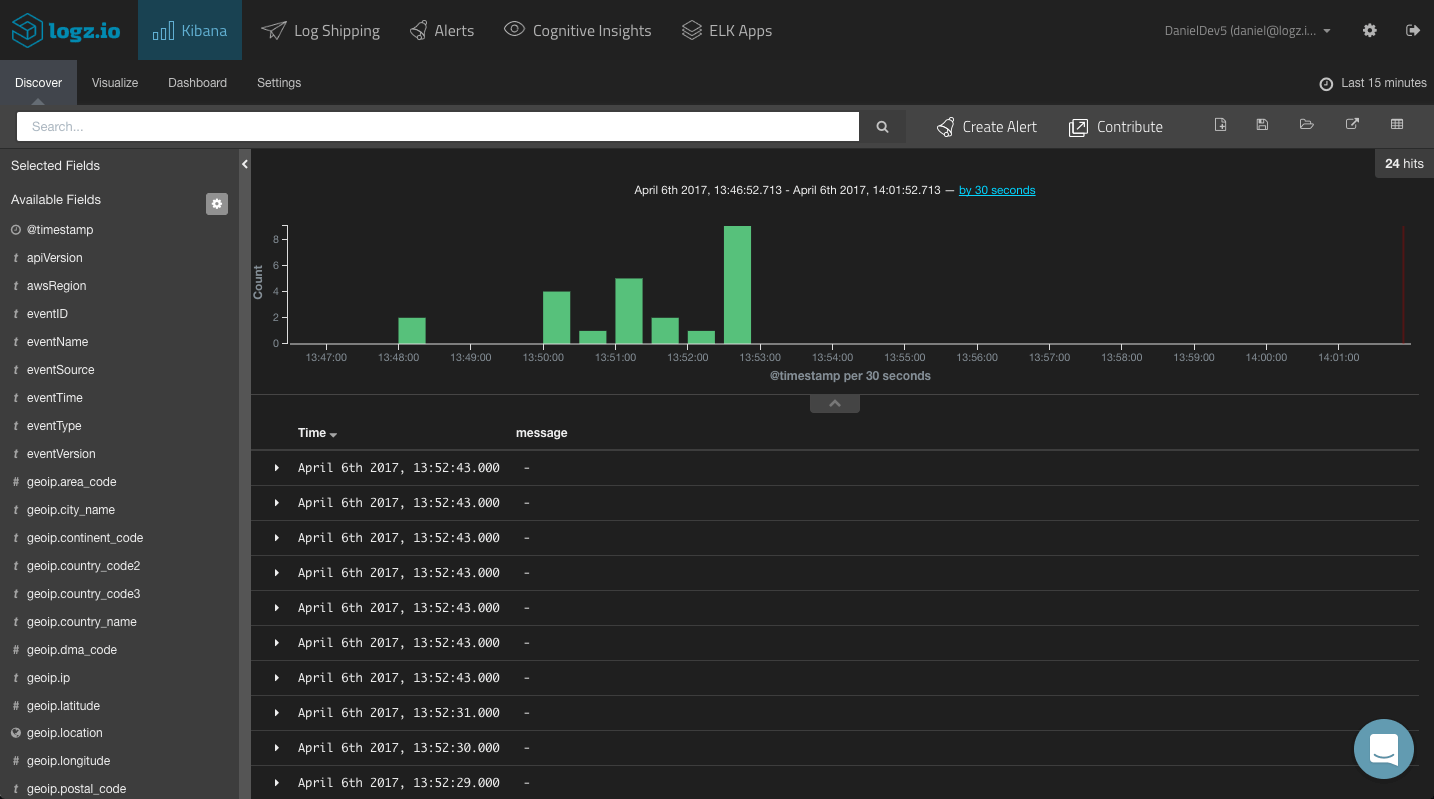
That’s all there is to it. Logz.io will identify the log type and automatically apply parsing to the logs. After a few seconds, the logs will be displayed in Kibana:
Using Logstash
As mentioned above, there are a number of ways to ship your CloudTrail logs from the S3 bucket if you are using your own ELK deployment.
You can use the Logstash S3 input plugin or, alternatively, download the file and use the Logstash file input plugin. In the example below, I am using the latter, and in the filters section defined some grok patterns to have Logstash parse the CloudTrail logs correctly. A local Elasticsearch instance is defined as the output:
input {
  file {
     path => "/pathtofile/*.log"
     type => "cloudtrail"
  }
}

filter {
  if [type] == "cloudtrail" {
   geoip {
     source => "sourceIPAddress"
     target => "geoip"
     add_tag => [ "cloudtrail-geoip" ]
   }
 }

output {
  elasticsearch { hosts => ["localhost:9200"] }
  stdout { codec => rubydebug }
}
Analyzing CloudTrail Logs
Since CloudTrail records the API events in JSON format, Elasticsearch easily maps the different fields included in the logs. These fields are displayed on the left side of the Discover page in Kibana. I recommend reading the relevant AWS docs on the different available field before commencing with the analysis stage.
To get some visibility into the CloudTrail logs, a first step would be to add some of the available fields to the main display area. This depends on what you would like to analyze, but the most obvious fields to add would be the ‘awsRegion’, ‘eventName’, ‘eventSource’ and ‘userIdentity.type’ fields.
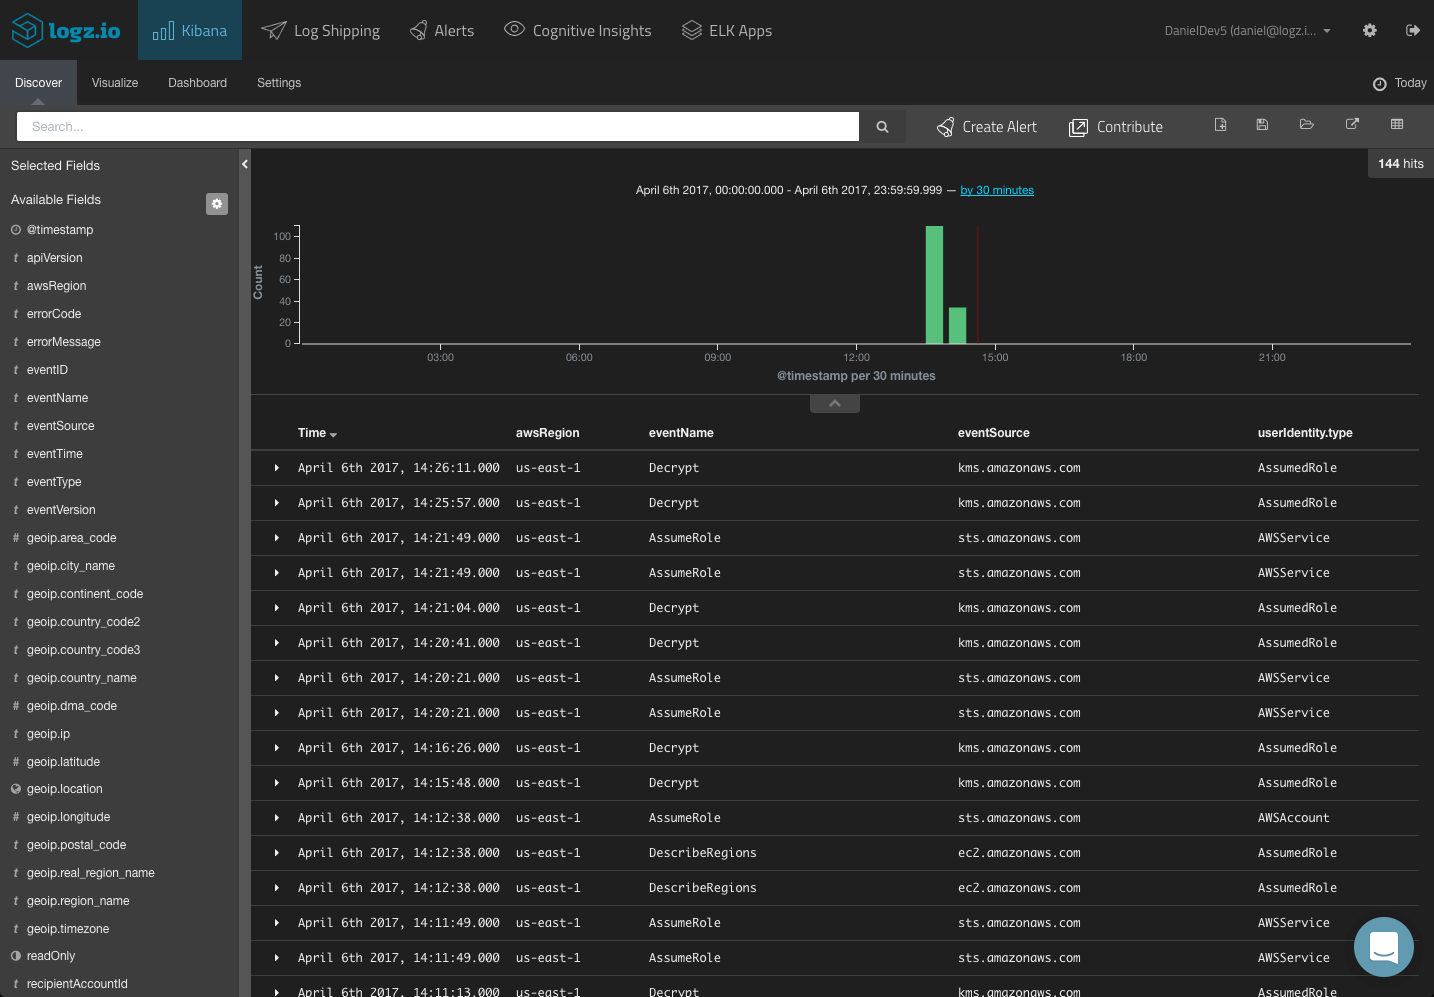
This gives you a better idea of the data you have available and what to analyze. To dive deeper and search for specific alerts, your next step would be to query Kibana.
You could start with a free-text search. So if you know what event you are looking for, simply enter it in the search field at the top of the page:
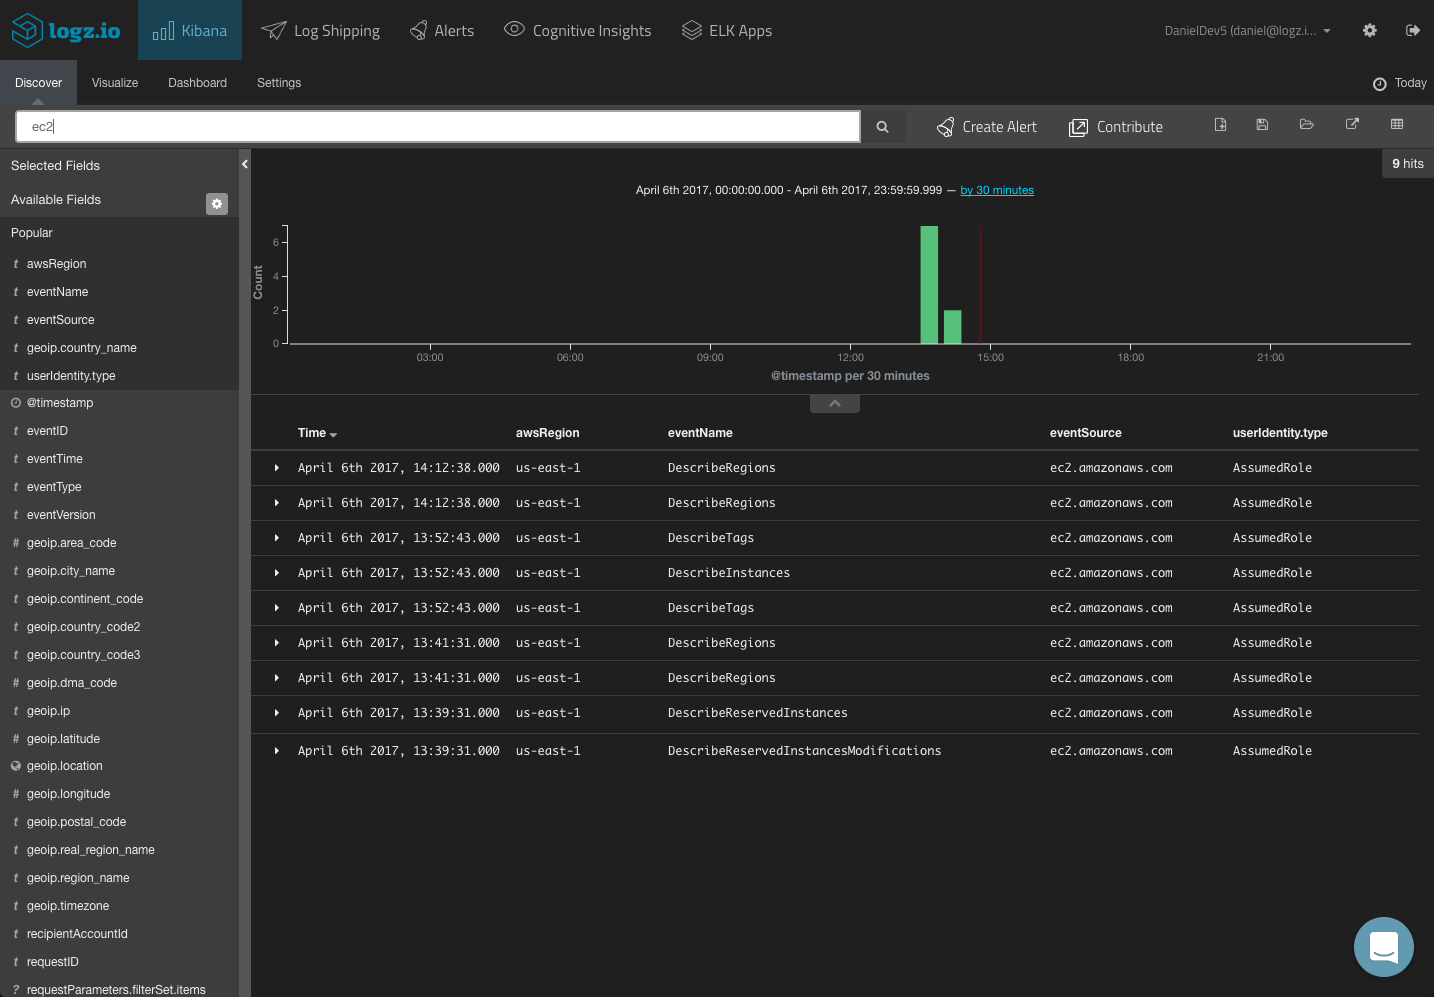
You can use a field-level search to look for events for a specific service:
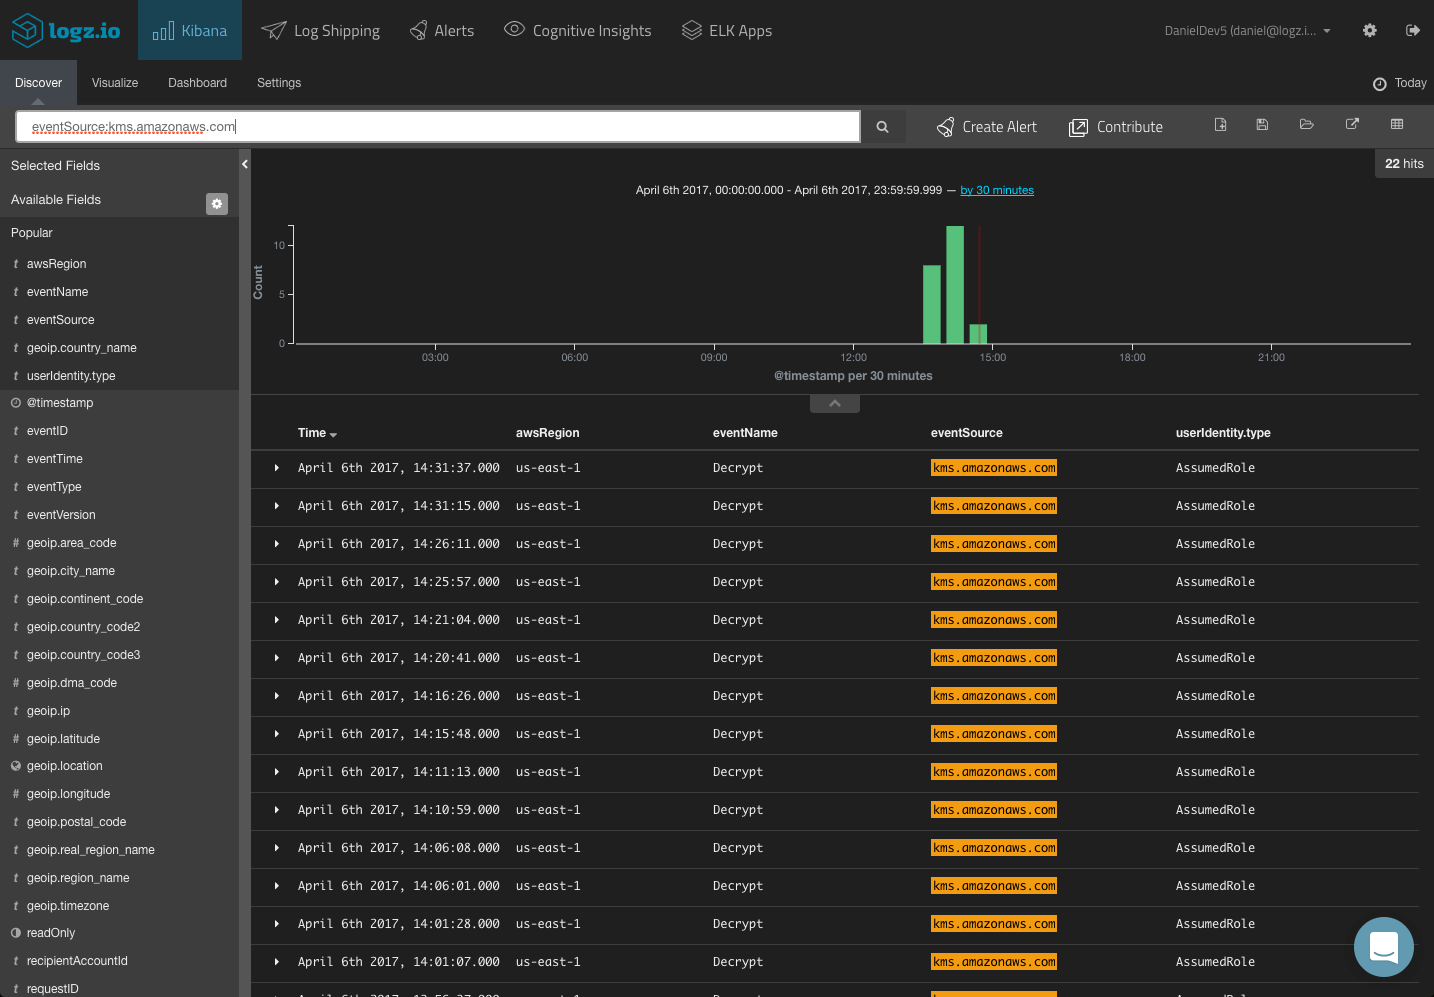
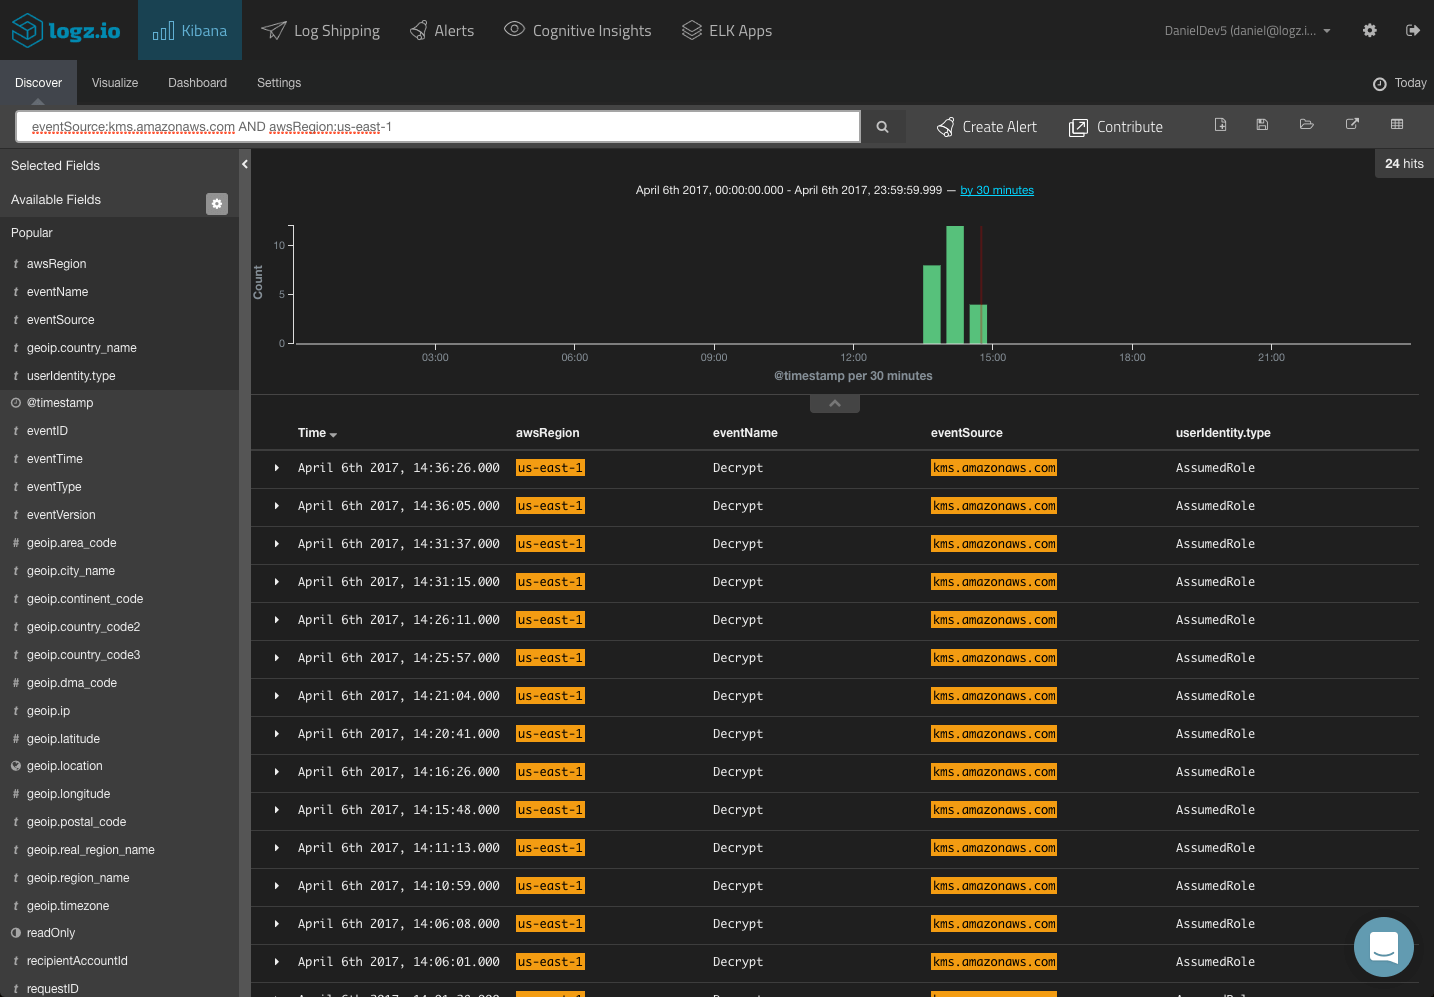
You could use a logical statement to search for a combination. For example, say you are looking for only KMS activity for a specific region:
Kibana supports a wide range of queries, and we cover most of them in this article. Save the queries that interest you in order to use them in your visualizations and dashboards.
Visualizing CloudTrail Logs
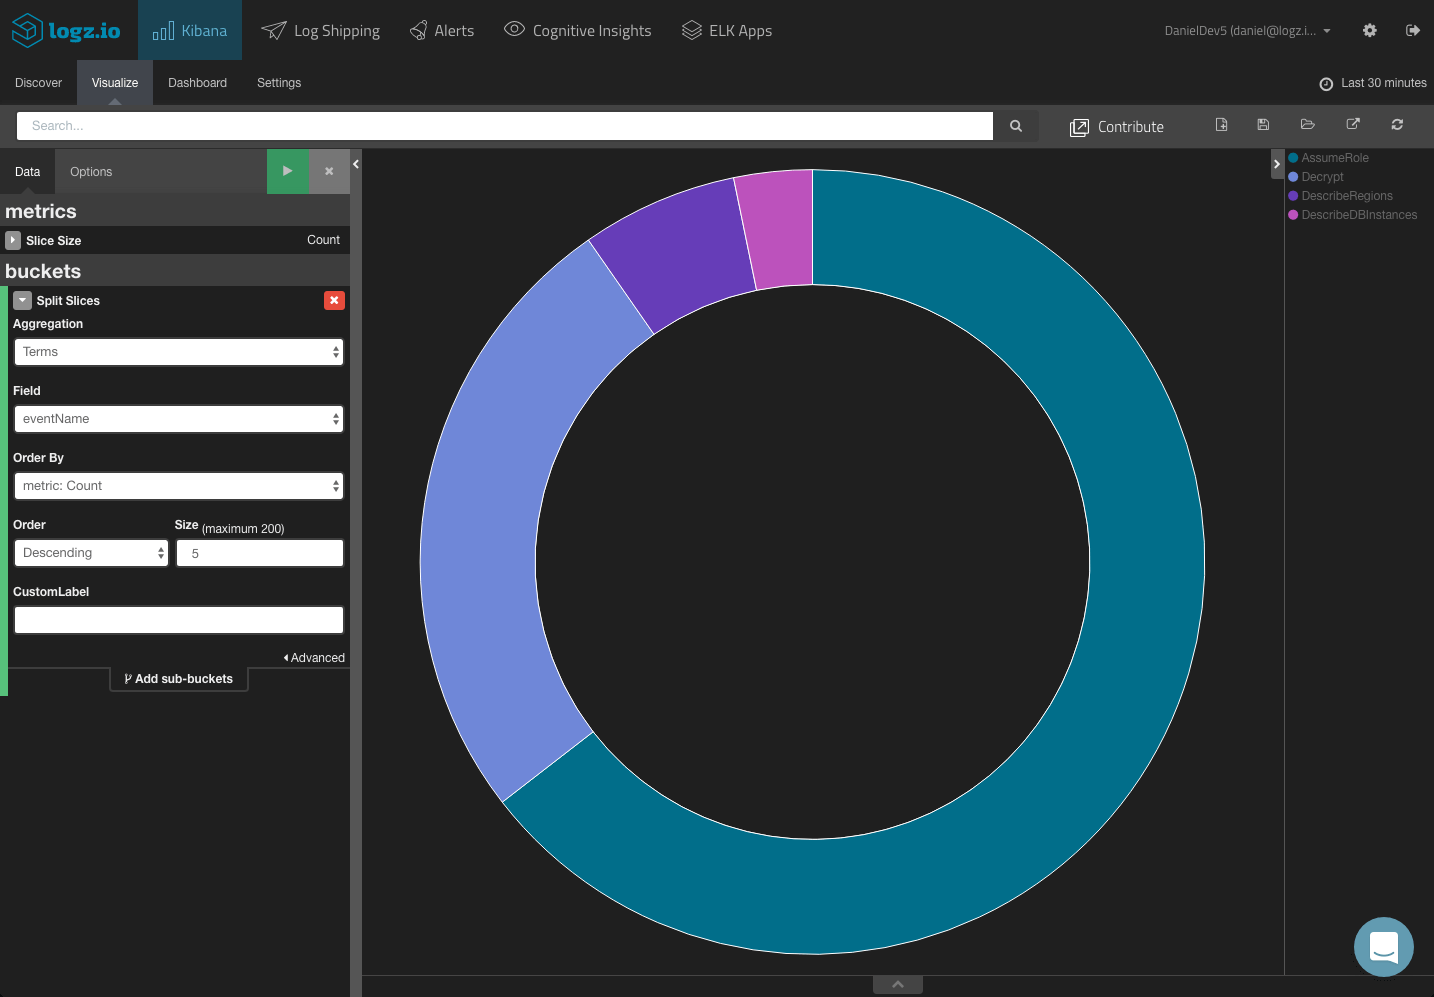
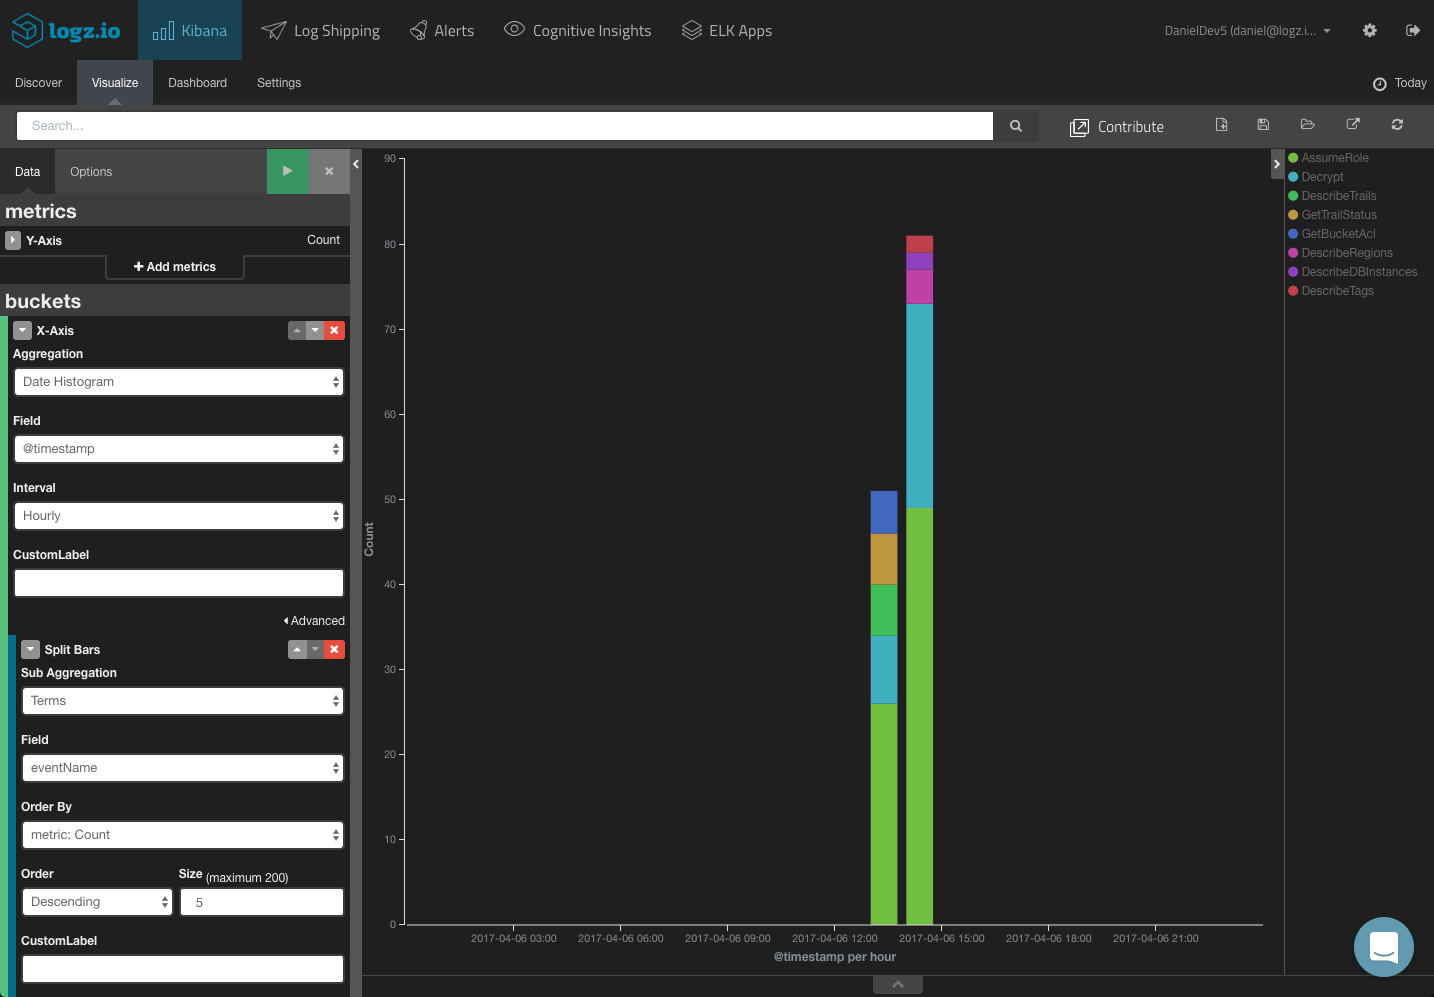
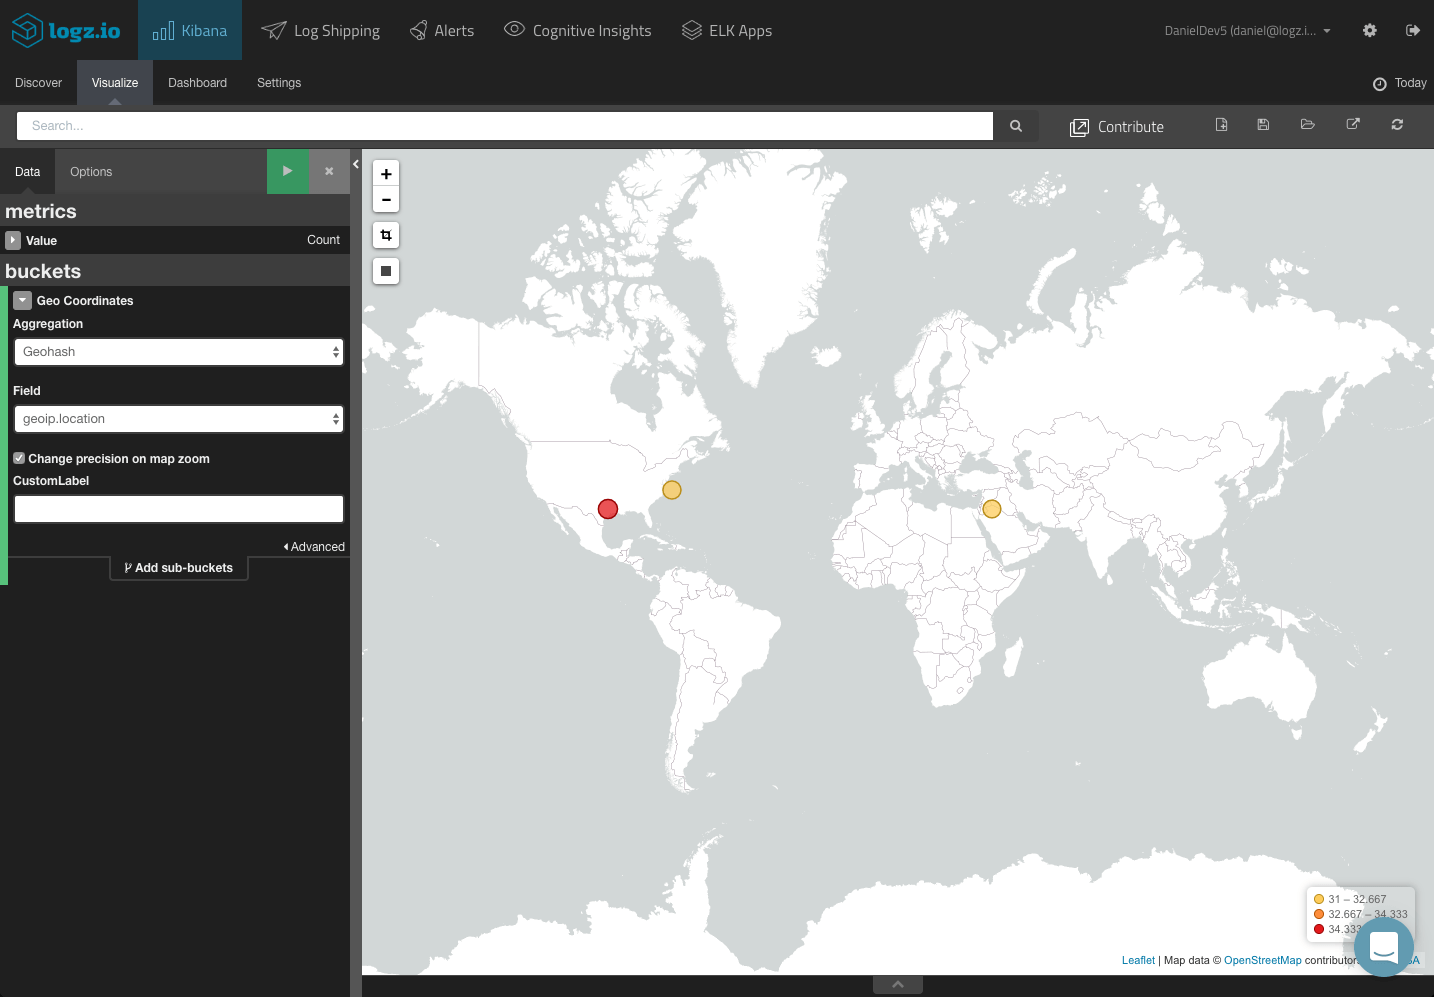
Based on your Kibana queries, you can create your CloudTrail visualizations and dashboards. In this section, we will show a few simple examples of how to visualize your CloudTrail logs.
Top events:
Events over time:
Source IP map:
Creating a CloudTrail Dashboard
These were just examples of how to visualize your CloudTrail logs. You can of course slice and dice the data in whichever manner you like depending on your needs and requirements. If, for example, you want to focus on S3 usage, you can make use of relevant fields (i.e. requestParameters.bucketName.)
In any case, once you have your visualizations created, your next step towards a building a comprehensive monitoring tool is adding them all up into a dashboard.
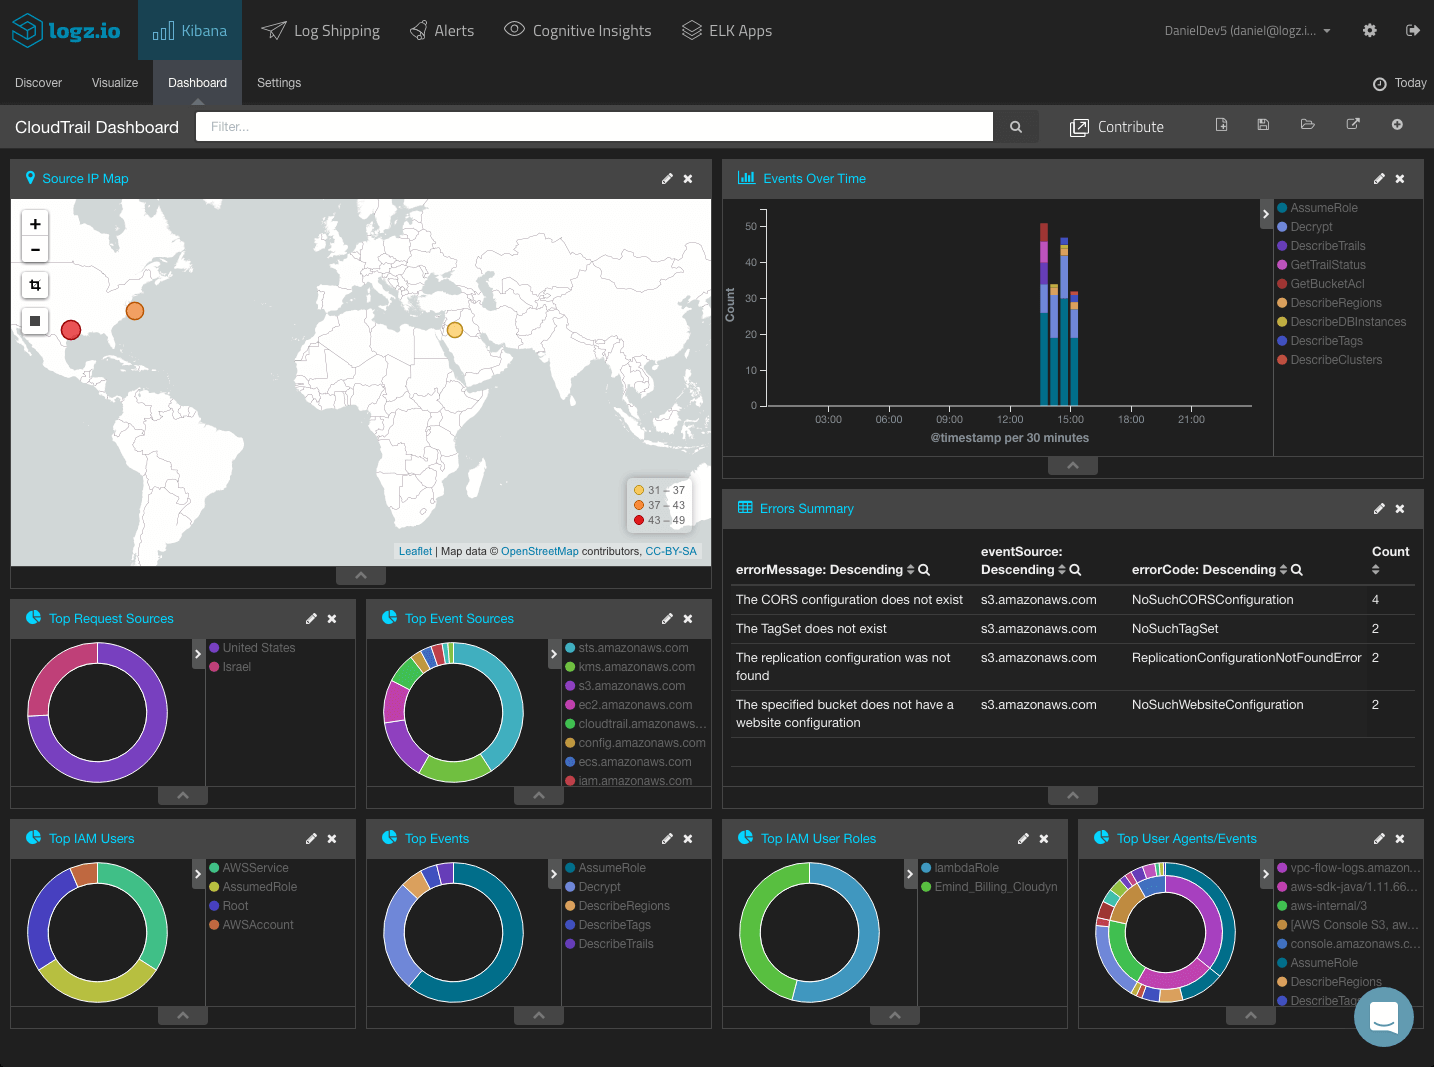
ELK Apps, the Logz.io library of Kibana searches, alerts, visualization and dashboards, includes a number of ready-made dashboards for CloudTrail logs, together with searches and alerts.
To install these dashboards, simply open ELK Apps, search for cloudtrail and install the dashboard.
Adding Alerting
Analysis and visualization is one thing, but being able to be actively notified, in real-time, when specific events are taking place, is another.
Logz.io ships with an advanced alerting mechanism which enables you to get notified either by email or any messaging or paging application you are using such as PagerDuty, Datadog or Slack, on specific API calls, and events monitored by CloudTrail.
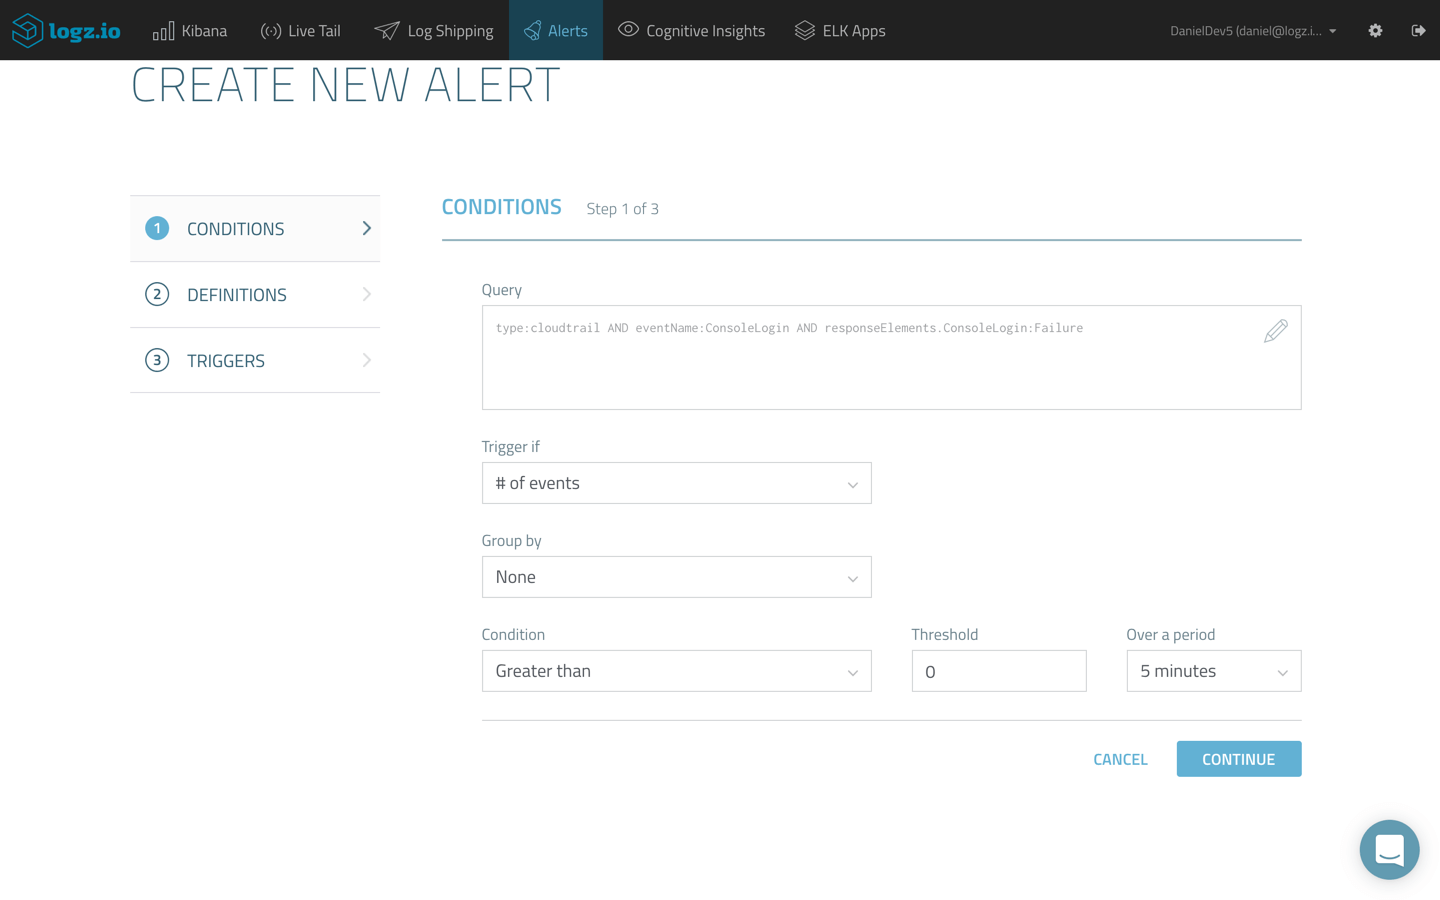
The ELK Stack does not include built-in alerting capabilities, so to be able to get notified, for example, when an unauthorized user accessed a specific resource requires additional costs and configurations.
Summary
CloudTrail is an extremely useful tool to use and crucial for monitoring access and usage of your AWS-based IT environment. There is a lot of valuable information from the data and using Kibana’s analysis and visualization capabilities.
There are lots of hidden treasures inside these events — and through visualizations and alerts, you can learn a lot about your AWS environment.
Published at DZone with permission of Daniel Berman, DZone MVB. See the original article here.
Opinions expressed by DZone contributors are their own.

Comments