Advancements in Cloud-Native and Kubernetes Observability
Explore how implementing the right tools and standards for cloud-native observability can save your business valuable time and resources.
Join the DZone community and get the full member experience.
Join For FreeThis is an article from DZone's 2022 Kubernetes in the Enterprise Trend Report.
For more:
Read the Report
In today's world, it's more important than ever to have visibility into your system's performance and health. Modern applications rely on complex microservices architectures and cloud-native technologies, like Kubernetes. Observability helps us understand not just application behavior, but also infrastructure configuration changes and dependencies, as they happen in real-time.
What Is Cloud-Native Observability?
Cloud-native observability is the ability to understand the health and status of a system based on the external data exposed by its elements, like containers, microservices, Kubernetes, and serverless functions. Cloud-native observability is built on three postulates: monitoring, logging, and traceability. By understanding these postulates and their implications, you can begin to understand why observability is essential in modern DevOps practices.

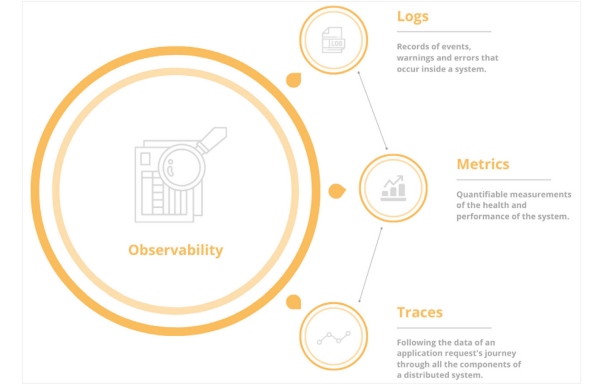
Figure 1: The three pillars of observability
Monitoring, or metrics, measure the health and performance of applications and their infrastructure — these are quantifiable measurements. Metrics provide real-time alerts of resource statuses and are critical for collecting insights into how fast your application responds and/or detects early indicators of performance problems.
Another pillar of observability is logging. Logging captures detailed error messages as well as stack traces. Logs are records of events, warnings, and faults that occur inside a system. They are a great source of visibility as they contain information like the time an event took place and who or what endpoint was associated with the event.
By combining logs and traces, you can get the full context of a system's availability. Tracing helps to investigate an issue or performance bottleneck in a containerized or microservices-based ecosystem by collecting data of the entire journey of an application request that moves through all the layers and nodes of that system.
Why Is Observability Important?
Observability is very important for developers and DevOps engineers because it provides the necessary information needed to track an entire system's performance and health, troubleshoot and diagnose issues quickly, and make informed decisions about the next steps needed to fix a problem.
Observability in cloud-native environments, such as Kubernetes, can help to understand what's going on within the clusters, so you can optimize compute power without compromising performance. Another great use case where observability helps is cloud cost management. To avoid unnecessary compute costs, you need to monitor clusters and understand your application's resource usage and needs.
Security issues and vulnerabilities can be detected quickly with good monitoring and observability tools in place.
Common Challenges in Observability and Monitoring
Kubernetes is one of the most popular open-source container runtime engines because of its versatility, reliability, and ability to provide abstraction among cloud providers. However, monitoring Kubernetes can be a quite challenging task for teams that require a diverse set of monitoring tools and solutions.
High Quantity of Components and Metrics
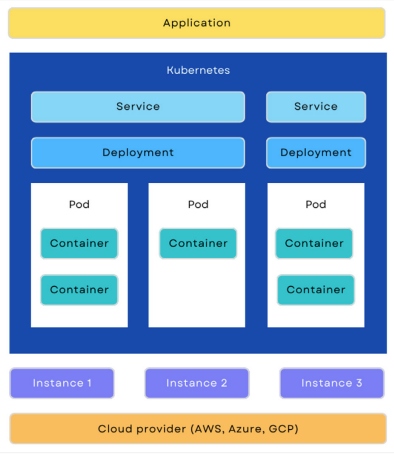
Working with Kubernetes brings its own set of challenges; it has more components than traditional infrastructures, like clusters, nodes, Pods, namespaces, Services, and more. These components produce their own metrics, which can be really helpful but also overwhelming if you don't know how to understand them.
The Complexity of Microservices
Modern applications can include numerous microservices, and Kubernetes needs to handle their availability and scalability by keeping track of all of them. Each Service can be distributed across multiple instances, forcing containers to move across your infrastructure as needed. Additionally, microservices need to be in constant communication with each other, which is also done inside the Kubernetes cluster.
Dynamic Containers
Depending on the organization, the container's life can be very short (from 10 seconds to 5 minutes). This creates something known as "pod churn" — the lifecycle through which new containers and Pods are created, used, destroyed, and recreated.
Kubernetes manages these elements to make sure that there are available resources at any time and that they are allocated where needed.

Figure 2: Layers of Kubernetes infrastructure
With every new deployment, Kubernetes decides to move, recreate, or destroy Pods as necessary. If there is a downscaling need for the application, Pods or nodes can disappear forever. This means that once a container dies, all of the information inside is gone.
Advancements in Kubernetes Observability
Now that Kubernetes is more popular than ever, observability tools have also become more sophisticated. Some of the key advancements in Kubernetes observability include real-time monitoring, performance analytics, and application visibility.
Emergence of Observability Tools
In the traditional development lifecycle, monitoring and observability haven't been exactly part of the whole process. But, now as cloud-native systems grow, and infrastructures become more complex, observability is becoming the focus for organizations. The need to maintain system stability, reliability, and performance is what enables the growth and maturity of observability and analysis tools.
In the past few years, cloud-native observability tools have made huge advancements. Many different tools have emerged for metrics monitoring, collecting data, and analyzing logs and traces from individual parts of your cluster.
Achieving Cluster Visibility
The need to aggregate and relate all of this observability data from different sources and get a holistic view of your entire system is much bigger now. This is why different open-source tools can be easily integrated with each other, to create complete visibility for developers. Cluster visibility tools can aggregate metrics from different microservices and applications in a data center, give insights into performance during deployments, understand how active services are behaving across the data center, pinpoint application-level issues, and provide real-time alerts to administrators.
To achieve this goal, most of these tools offer native integration with monitoring systems so that you can get notified if any service goes down unexpectedly or is experiencing high load. Additionally, many of these products also have sophisticated analytics capabilities that allow analysts to drill down and understand what is happening at a microservices or application level.
A Unified Observability Approach
In order to achieve an even deeper level of observability, every unit of data needs to be contextualized. So every metric, trace, and log captured needs to have the complete context of what is happening in the system. Additionally, developers need to be able to monitor the whole application behavior, from the start of the delivery pipeline through the deployment. Tools that integrate seamlessly into the application environment are crucial to automate this whole observability journey.
This unified observability approach has an exciting promise: to provide a deeper correlation between the three pillars and help teams define and track metrics that are important for their business requirements.
The state of Kubernetes observability is constantly evolving, so it's important to stay up to date on the latest trends. This includes learning about the different types of monitoring tools that are available and choosing the best one for your needs.
Popular Tools for Cloud-Native Observability
In the last few years, the implementation of observability has become more accessible, as there are many open-source tools available that help developers introduce different aspects of observability into their systems.
Let's look at the most popular ones:
| POPULAR CLOUD-NATIVE OBSERVABILITY TOOLS | |||
|---|---|---|---|
| Tool | Description | Advantages | Disadvantages |
| Prometheus | The most adopted open-source observability tool for event monitoring and alerting |
|
|
| OpenTelemetry | This project standardizes how you collect and send telemetry data to a backend platform, such as Prometheus or Jaeger |
|
|
| Jaeger | A popular choice for Kubernetes tracing; its main purpose is to monitor microservice-based systems and collect data in storage back ends of your choice |
|
|
| cAdvisor | A Kubernetes built-in monitoring feature that exists by default on every node |
|
|
Conclusion
Cloud-native observability has emerged as an important part of managing Kubernetes deployments in the cloud. By providing visibility into the performance of applications running on Kubernetes, cloud-native observability has helped to improve system performance, reliability, and security. With the advancements in open-source tools, we are lowering the barriers of implementing observability for organizations. Current offerings and standards will mature and become more established by focusing on the outcomes rather than technical implementation.
Additionally, the trend of moving applications to Kubernetes is likely to increase the demand for observability solutions in the future. Kubernetes helps developers ship their apps to the cloud in a containerized matter, which is now deeply connected to the cloud-native way of working. More than just a technology, Kubernetes becomes a business decision that drives the value for the company that incorporates it, because it means that you develop and deliver apps in a cloud-native manner, making you ready for innovation.
Kubernetes is most powerful when properly managed and monitored. That's why it's important to think about observability from the start. Implementing the right tools and standards for cloud-native observability can save your business valuable time and resources because it will help the organization detect incidents and resolve them in a timely manner.
This is an article from DZone's 2022 Kubernetes in the Enterprise Trend Report.
For more:
Read the Report
Opinions expressed by DZone contributors are their own.

Comments