A Comparison of eBPF Observability vs. Agents and Sidecars
In this article, we will be comparing eBPF-based instrumentation to other methods of instrumentation such as code agents and sidecars.
Join the DZone community and get the full member experience.
Join For FreeIn this article, we will compare eBPF-based instrumentation with other instrumentation methods like code agents and sidecars and see which best suits the needs of observability today.
Before we dive in, let’s briefly revisit eBPF.

eBPF is a framework in the Linux kernel that allows us to safely run sandboxed programs in the kernel space, without changing kernel source code or adding kernel modules.
eBPF programs are highly efficient and secure — they undergo strict verification by the kernel to ensure they don’t risk stability or security, and they are run as native machine code in the kernel, so they are highly performant.
eBPF as a technology has existed for 25+ years and is now becoming mainstream with the emergence of cloud-native architectures.
Companies like LinkedIn, Netflix, Facebook, and Adobe have been using eBPF in production for years. If you are using GKE (Google’s Kubernetes offering), you’re using eBPF already, as GKE’s networking, security, and observability are powered by eBPF.
While eBPF has been used widely in networking (high-speed packet processing) and security historically, it is recently gaining traction in observability.
The premise for eBPF in observability is straightforward.
eBPF operates at the kernel level, and as everything eventually goes through the kernel, one can technically observe everything from this vantage point.
So eBPF provides a new way to instrument for telemetry. Other components of a typical observability solution, like data processing, storage, and visualization, are unaffected by eBPF.
eBPF opens up new visibility into system and application behavior that was previously difficult to achieve, such as low-overhead profiling, system call tracing, and deep visibility into network traffic. As a result, eBPF is pushing the boundaries of what is possible in observability and providing tools to understand, optimize, and troubleshoot systems like never before.
So how does eBPF-based instrumentation compare with existing instrumentation mechanisms? For that, let’s look at the commonly used instrumentation techniques today.
Agent-based methods have been the mainstay for system monitoring and observability for years. They work by installing an agent (software SDK/ library) on every node, microservice, or infrastructure component that needs monitoring. These agents collect data and send it back to a central location for analysis.
While this method provides deep visibility, it comes with its challenges. The installation of agents is time-consuming, requires code changes, and the agents can induce a performance overhead. There are also potential security issues, and the agents need to be meticulously screened for safety.
With the rise of microservices architecture, sidecar-based instrumentation emerged as an alternative mechanism for instrumentation. Sidecars are lightweight, independent processes that run alongside an application or service. In this setup, a sidecar proxy (e.g., envoy) is attached to each service, acting as a shared module for monitoring tasks and can see everything going in and out of service.
Sidecars are easier to implement compared to agents (no code changes). However, they can be resource-intensive, leading to increased CPU and memory usage. Additionally, updating sidecars often requires service restarts, which may not be ideal for always-on services.
Enter eBPF, a technology that has been around for a while in the networking and security space but has recently gained traction in observability.
eBPF operates at the kernel level, making it possible to observe system, infrastructure, and application behavior from one place. eBPF programs can be dropped into the kernel without any code changes or releases. Moreover, they are non-intrusive, causing no impact on running workloads, and are checked for safety before execution, providing an added layer of security.
The traditional code agent-based model is the most widely used — almost all observability solutions in the market today use agents. However, it has become unwieldy in modern distributed environments that have hundreds of services and hosts.
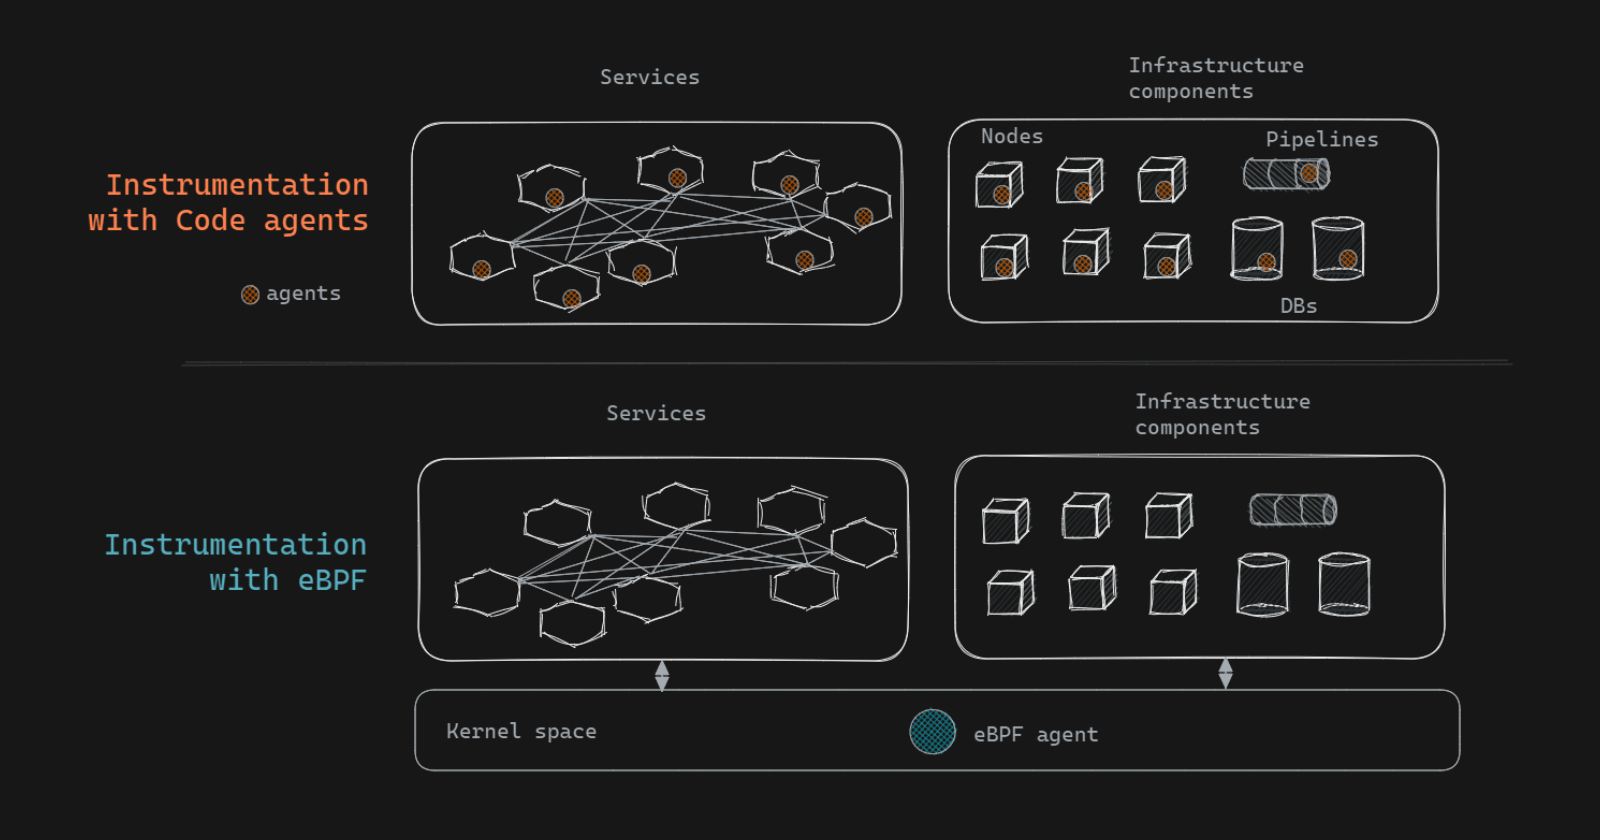
In the agent world, each service/ host is instrumented separately with an agent, requiring a release/ restart. And for every maintenance update, this process is repeated for every component — dramatically increasing human overhead.
The Sidecar proxy-based model was once expected to emerge as a viable alternative to agents due to the ease of implementation (no code changes). However, they still require restarts and add performance overhead, dampening the enthusiasm around sidecars, and the sidecar wave seems to be crashing before even taking off.
Meanwhile, eBPF is emerging as the more performant, secure, scalable, and easy-to-implement alternative to sidecars in distributed environments ( Is eBPF the end of Kubernetes sidecars?)
Let us evaluate these three types of instrumentation a bit more closely
First, what are the considerations around which we want to evaluate? What factors do we care about? Let’s start with the following -
- Data visibility/ granularity — what types of observability data can be obtained?
- Intrusiveness — Is the data collection in line of a running workload being or out-of-band?
- Performance overhead — what are the additional resource requirements and impact on running workloads?
- Safety and security — what are the guardrails around security, given these are added to production workloads?
- Ease of implementation — how easy is it to get started?
- Ease of maintenance and updates — what do maintenance and updates involve?
- Scalability — In high-scale systems, how does the instrumentation method perform in all of the parameters above?
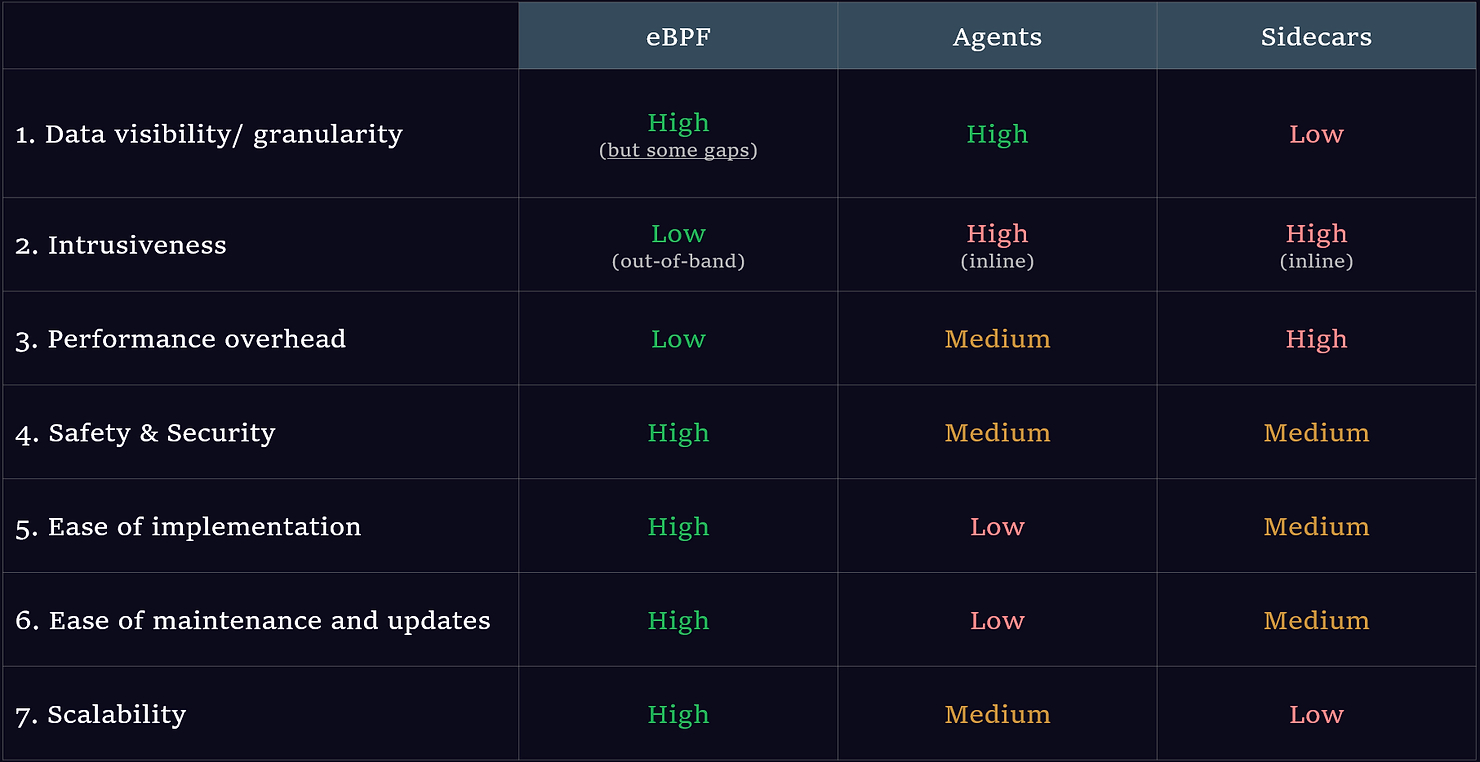
Now that we have the criteria let us compare the three instrumentation methods against each of the above. See below:

Based on our assessment, eBPF appears to outperform other instrumentation methods across nearly all parameters. Let us dive deeper and see how.
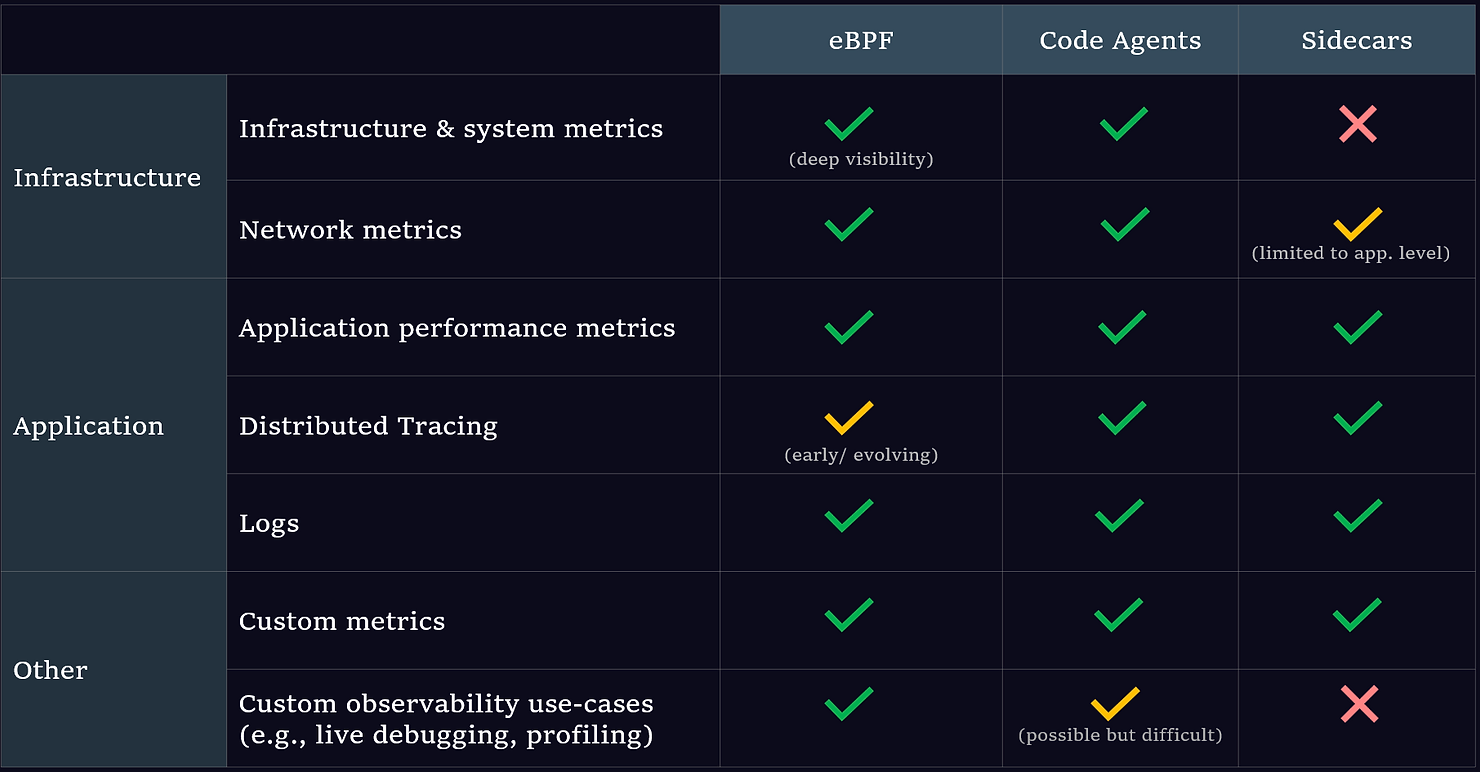
The most important question with an instrumentation method is — what type of observability data can I get through this? How deep and wide can I go?
eBPF: Unparalleled visibility into infrastructure and network behavior. Can also provide visibility into application behavior. Custom metrics can be implemented through custom probes without restarts or code changes. The unique vantage point of the kernel opens up additional use cases like low overhead continuous profiling and live debugging. While the coverage is broad, the gap today is primarily in distributed tracing ( possible but still not mature) and seeing rapid innovation by the community.
Agent: Agents provide comprehensive coverage of application behavior. Written in the same language as the application they monitor, agents provide deep visibility into application code execution and metrics. Agents written separately for infrastructure components provide visibility into infra. metrics. However, agents fall short in network observability (e.g., visibility into network events and network packets) and system visibility (e.g., visibility into system calls or kernel data structures).
Sidecar proxy: Sidecar proxies can provide basic application metrics like latency, error rates, and throughput. They can even implement distributed tracing and access logs. However, they do not provide infrastructure visibility. They also do not have code-level visibility.
See below for a summary of how the three mechanisms fare in providing visibility into common observability data types:

eBPF: Least intrusive. Out-of-band data collection — no impact on applications being executed. Snapshots are taken from the side as data passes through the kernel from an isolated sandbox.
Agent: Most intrusive — agents are inline of the monitored components and are executed every time the workload is executed.
Sidecar proxy: Also inline of execution path, although somewhat less than agents as they don’t sit within the code.
eBPF: eBPF really shines here and has the lowest performance overhead. This is because eBPF programs run as native machine code on the kernel, and there is no context switching between user space and kernel space, driving near-zero overhead.
Agent: High overhead (can range from 10–100%+) and varies widely across individual agent implementations. Operate in user space so high context-switching, plus inline so executed each time the code is executed.
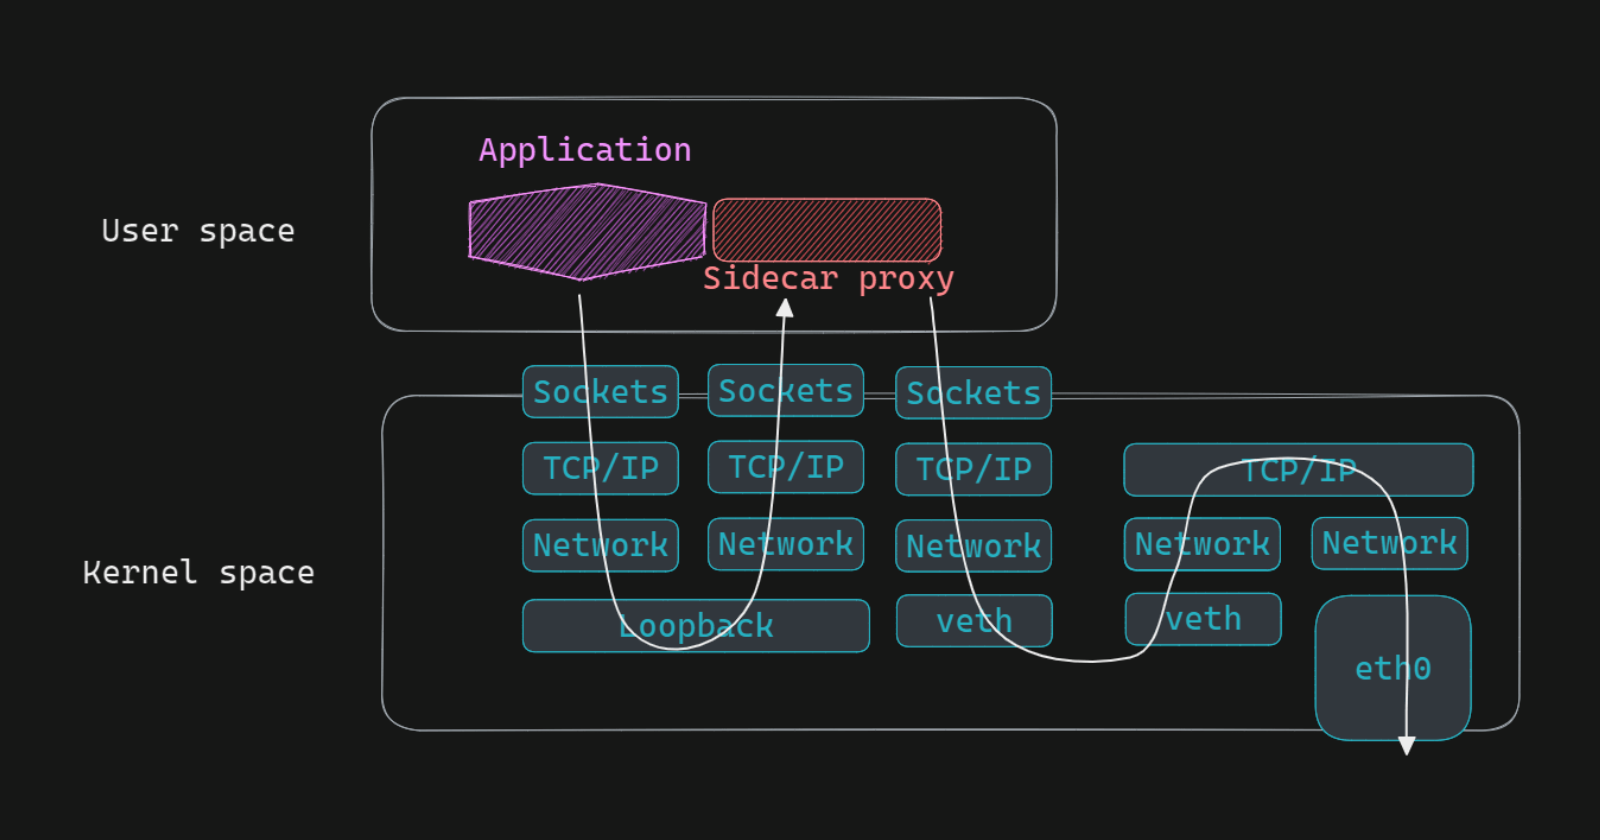
Sidecar proxy: Fare poorest here. They are also in the line of traffic and operate in user space like agents. But in addition, they add performance overhead due to the extra network hop they introduce and the resources they consume (see figure below):

eBPF: Most secure — sandboxed execution environment, which restricts eBPF programs’ access to a limited set of kernel functions and resources. In addition, they undergo verification by the kernel through the eBPF verifier to ensure safety.
Agent: Code injection increases the potential attack surface, as vulnerabilities in the agent code could be exploited by malicious actors. Requires careful vetting (and management) of agent code to ensure security.
Sidecar proxy: Sidecar proxies introduce additional network components, increasing the potential attack surface. However, isolation between the proxy and the application can help mitigate some security risks.
eBPF: Easiest, as eBPF agents can be dropped in directly — one agent in the kernel for all applications, infrastructure — everything in one go, without any restarts. However, the installation requires privileged access.
Agent: Hardest. Agents must be installed in every service and component, which requires code changes, releases, and restarts for each service and component. It’s not just the installation but the management, maintenance, and debugging of all these disparate pieces that add to the significant overhead. However, emerging auto-instrumentation libraries are looking to reduce the effort.

eBPF: Highly scalable, as eBPF programs can efficiently gather data from multiple sources without requiring additional agents or tools.
Agent: Scalability is challenging as each application component and infra host requires its own monitoring agent. This increases resource consumption and management complexity in large-scale environments.
Sidecar proxy: Low scalability, as they consume additional resources for each application component. The increased resource consumption and network overhead can become significant in large-scale environments, especially when managing multiple sidecar instances.
In summary, eBPF-based instrumentation is significantly better than current instrumentation mechanisms:
- Broad coverage — across applications and infrastructure in one go.
- Non-intrusive — out-of-band data collection has no impact on running workloads.
- Easy to implement and maintain.
- Highly performant
- More secure
- More scalable
That said, there are some limitations as of today:
- Distributed tracing with eBPF is not as mature.
- Restricted to Linux environments (windows implementation is not yet mature.)
If you’re in a modern cloud-native environment (Kubernetes, microservices), that’s when the difference between eBPF and the agent-based approach is most visible (performance overhead, scalability, security, ease of installation and maintenance, etc.). This is likely one of the reasons why eBPF adoption in the last 5–6 years has been highest in scale technology companies with massive footprints.
Given the significant advantages eBPF-based instrumentation offers, the next generation of observability solutions are all likely to be built with eBPF.
There are already several emerging eBPF-native observability solutions, including ZeroK. Meanwhile, traditional observability players like NewRelic and Datadog are also investing in updating their instrumentation.
Over time, as eBPF becomes the default instrumentation mechanism that everyone uses, we can expect innovation in this space to shift to higher levels of the observability value chain, like data processing, advanced analytics, and AI.
Published at DZone with permission of Samyukktha T. See the original article here.
Opinions expressed by DZone contributors are their own.

Comments