Using the Log Node in IBM App Connect Enterprise
This article explains how to log ExceptionList inserts into the activity log, and explores some scenarios which provide Log node hints and tips.
Join the DZone community and get the full member experience.
Join For FreeIn the world of IBM App Connect Enterprise (ACE), effective logging is crucial for monitoring and troubleshooting. With the introduction of the Log node, it's now easier than ever to log ExceptionList inserts directly into the activity log, which can be viewed from the WebUI. The Log node can be especially valuable, often replacing the Trace node in various scenarios.
This article contains two sections: the first will guide you through the process of using the Log node to log these inserts, helping you streamline your debugging and monitoring processes. The second section explores some scenarios that provide Log node hints and tips around default values.
Section 1: Logging ACE's ExceptionList Inserts (In the Activity Log With the Log Node)
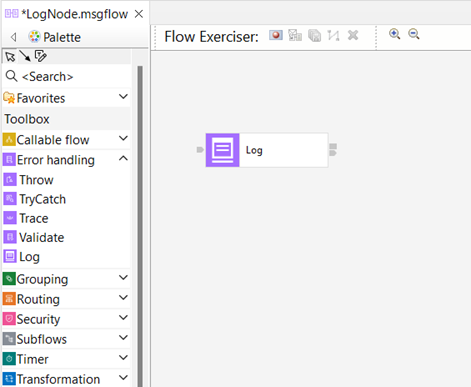
Introducing the Log Node
The Log node is a recent addition to ACE (v12.0.11.0), originating from the Designer, which simplifies logging activities. By using the Log node, you can log custom messages directly into the activity log for easy monitoring and follow-up.
Understanding the ExceptionList in ACE
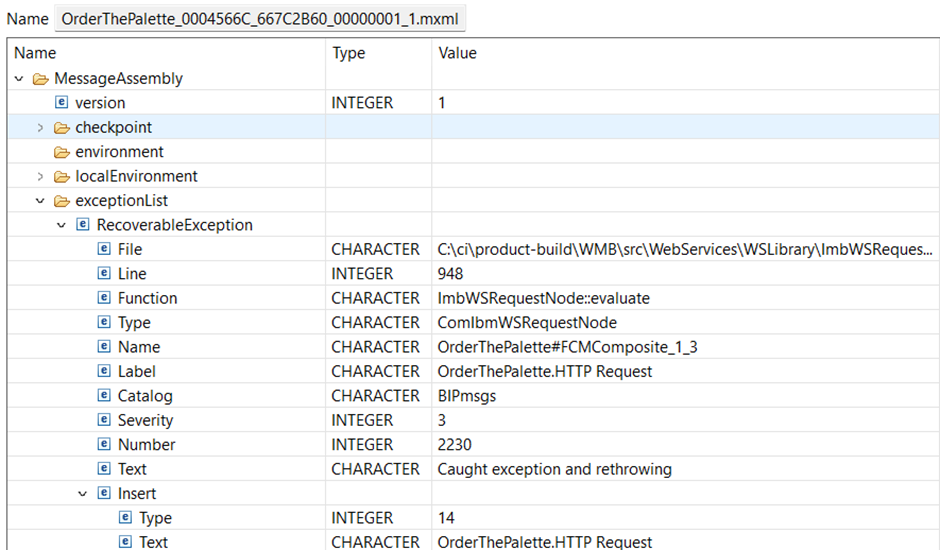
Since this article mentions and works with the ExceptionList, I’ll recap very quickly what the ExceptionList is. The ExceptionList in ACE is a structured (built-in) way of displaying captured exceptions within your message flows. It provides detailed information about errors, including the file, line, function, type, and additional context that can be invaluable during troubleshooting. As most of you know, the insert fields contain the most usable information so we will be focussing on those.

Setting up the Demo Flow
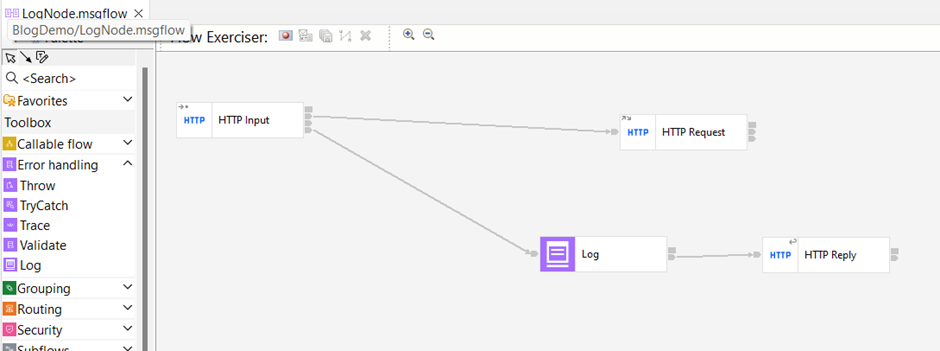
To demonstrate how to log ExceptionList inserts using the Log node, we'll set up a simple flow:
1. Create the Flow
- Add an HTTP
Inputnode. - Add an HTTP
Requestnode. - Add a
Lognode. - Add an HTTP
Replynode.
2. Connect the Nodes
Connect the nodes as shown in the diagram to form a complete flow.
Configuring the Log Node
Next, we need to configure the Log node to capture and log the ExceptionList inserts:
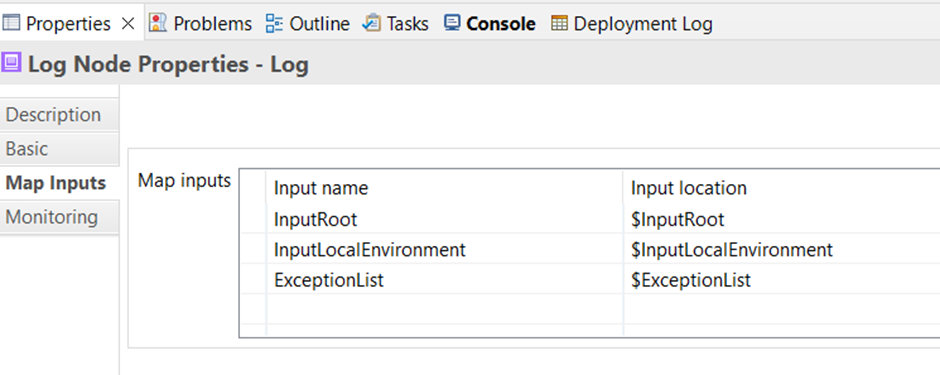
1. Properties
- Go to the Map Inputs part of the properties.
- Configure the
Lognode to include theExceptionListas a Map input.
2. Configure
- Open the Configure wizard for the Log Node.

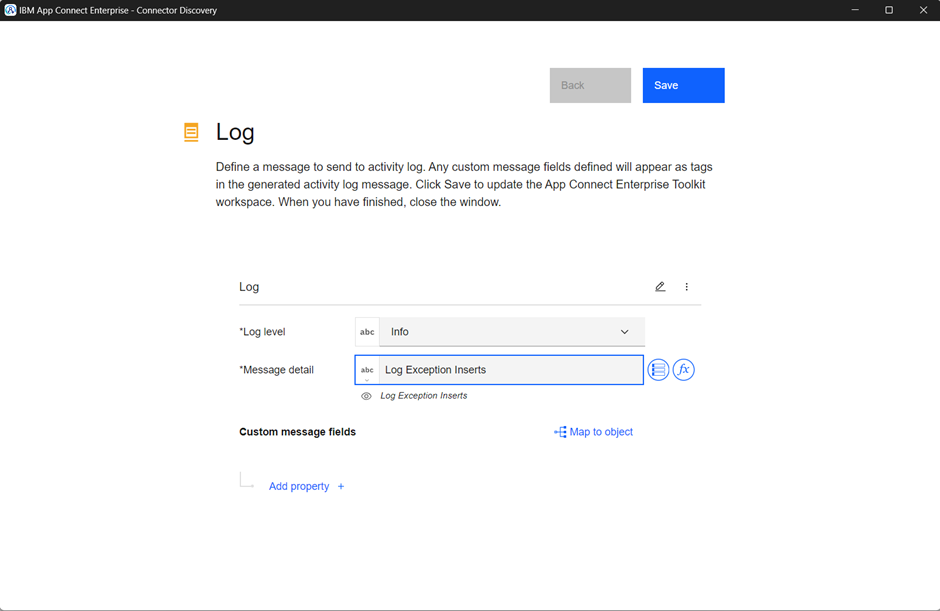
- Set the basic values for the log message: “Log Level” and “Message detail”.
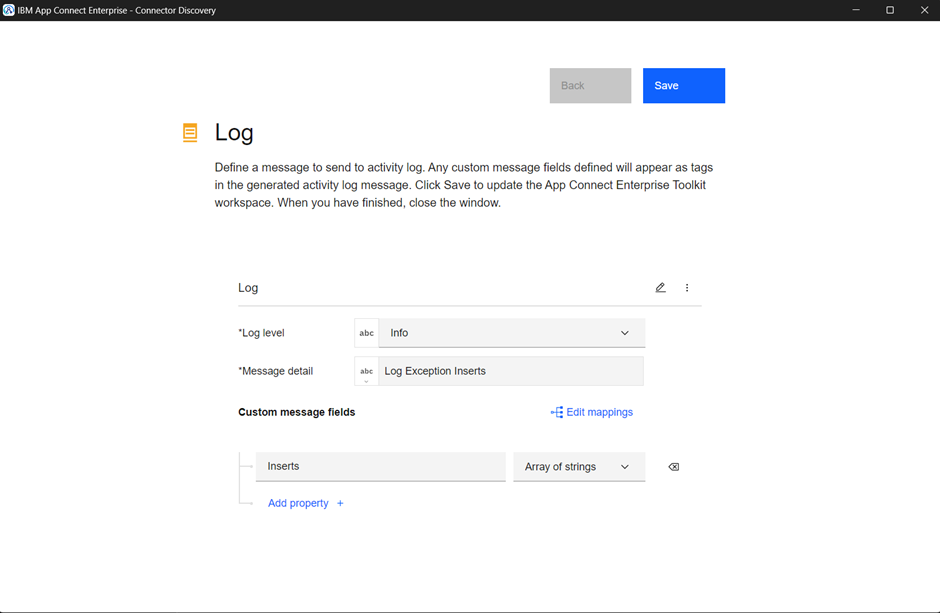
- Next, add a new property, give it a name, and set the type to “Array of strings”.
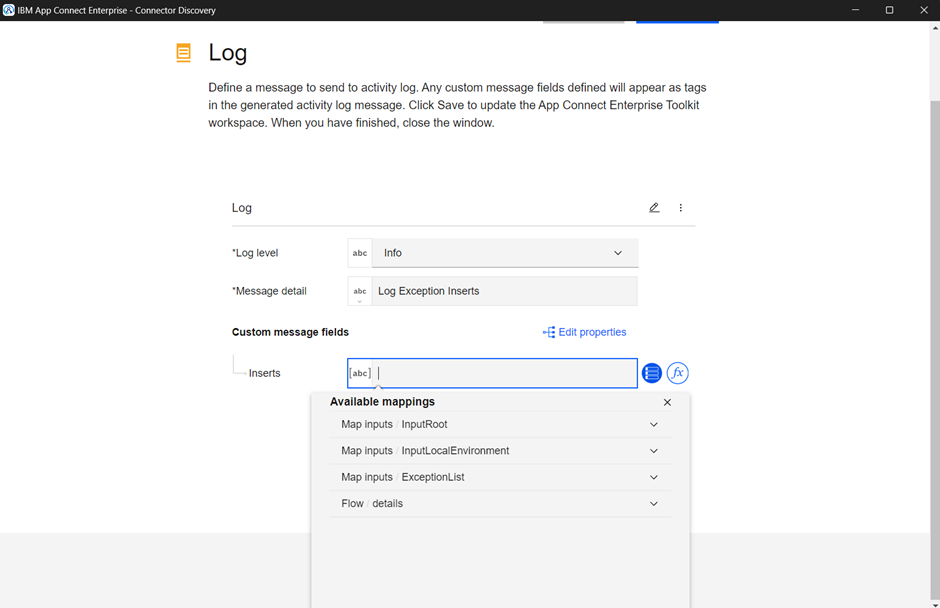
- Click on “Edit mappings” and click on the left button that looks like a menu with 3 items.
- Click on “ExceptionList”, scroll down, and select “Insert”.
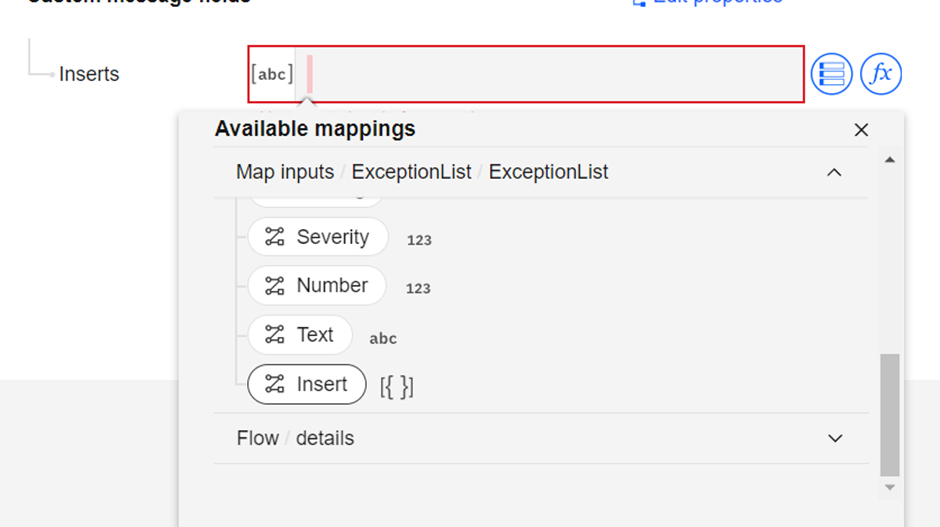
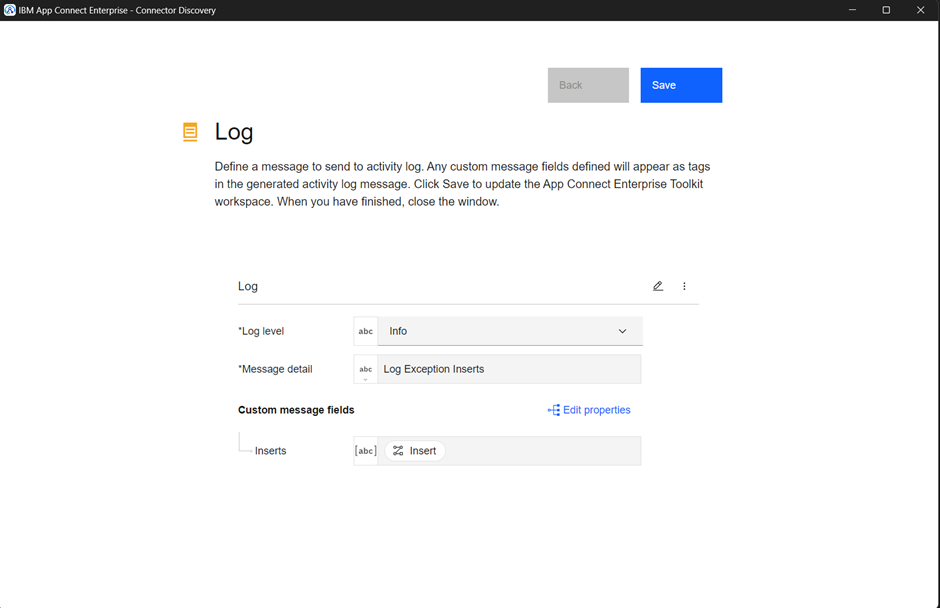
This gives you all the inserts of the ExceptionList. If that is what you want, great — we are done here. But if you only require the insert fields of the last two ExceptionList items, which tend to be the most interesting ones, you can select only those as well. It’s rather important to know that the ExceptionList ordering here is reversed compared to the message tree. So the last two ExceptionList items in the flow are the first two in this JSON representation.
3. Filter
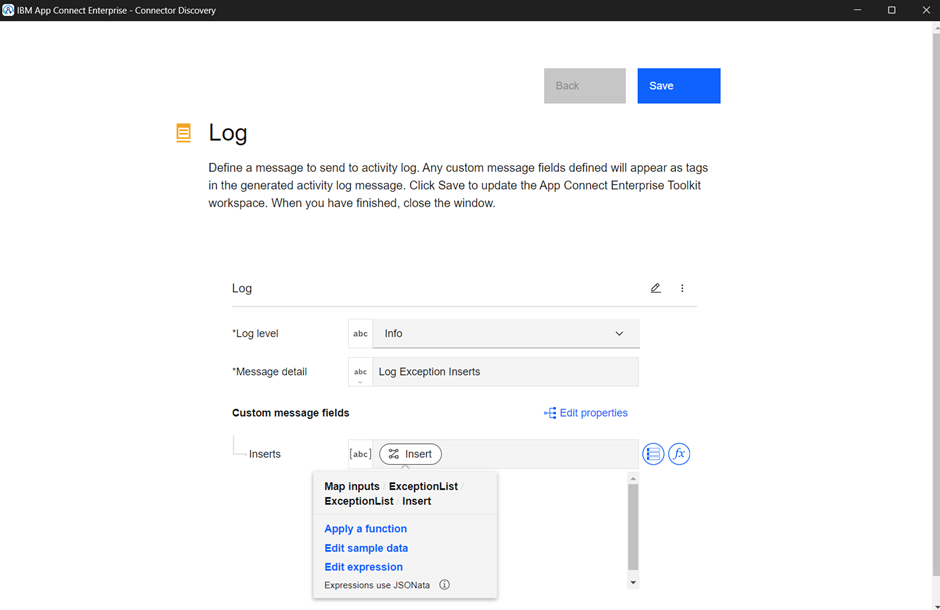
- Click on Insert and go to “Edit expression”.
![Click on Insert and go to “Edit expression”]()
- Change the expression to “
$mappingInput_ExceptionList[0..1].Insert”.![Change the expression to “$mappingInput_ExceptionList[0..1].Insert”]()
- Do not forget to hit “Save”!
Sending a Message Through the Flow
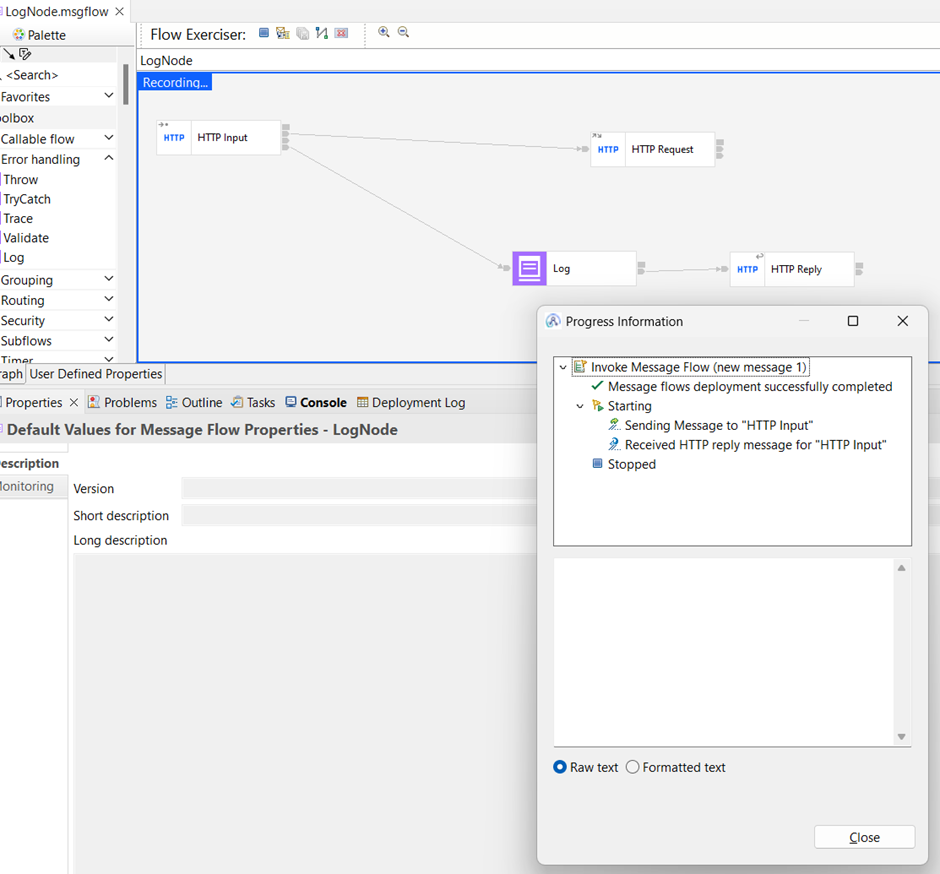
To test our configuration, we'll send a message through the flow using the Flow Exerciser:
1. Send Message
Open the Flow Exerciser, create a new message, and send it through the HTTP Input node.
2. Monitor the Progress
Observe the message flow and ensure the Log node captures and logs the ExceptionList details.
To make sure the log message has been written, wait until you get a reply back.
Viewing the ExceptionList in the Activity Log
Once the message has been processed, you can view the logged ExceptionList inserts in the activity log through the WebUI:
1. Access the Activity Log
Navigate to the activity log section in the WebUI to see the logged ExceptionList inserts:
- Integration Server > Application > Message flows > flow
2. Review Logged Details
The activity log should display detailed information about the exceptions captured during the flow execution.
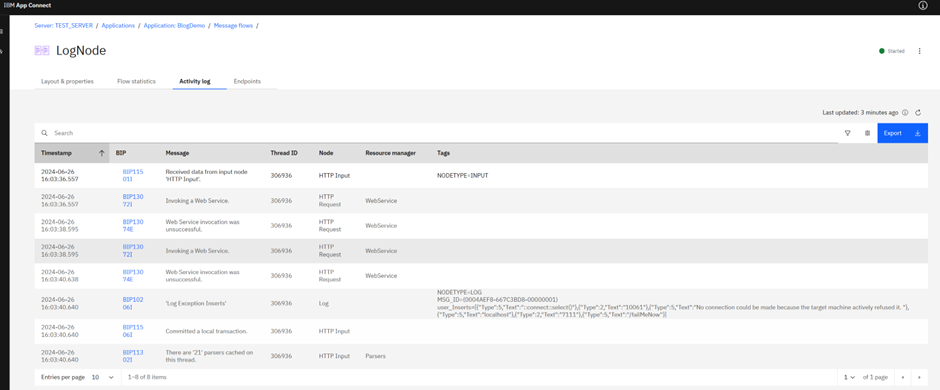
The log entry in detail:

This is enough to tell me what the issue is.
Section 2: ACE Log Node Tips and Tricks, Default Values
Having explored how to handle and parse the ExceptionList, let's now examine some scenarios using the Log node.
Fallback or Default Values
Imagine you want to log a specific field from an incoming message that may or may not be present. Let's use the HTTP Authorization header as an example.
If you configure the Log node to use this header as an input parameter, it will either display it or omit it entirely. The syntax to retrieve the Authorization header from your input message is:
{{$mappingInput_InputRoot.HTTPInputHeader.Authorization}}
Apply this to your Log node:
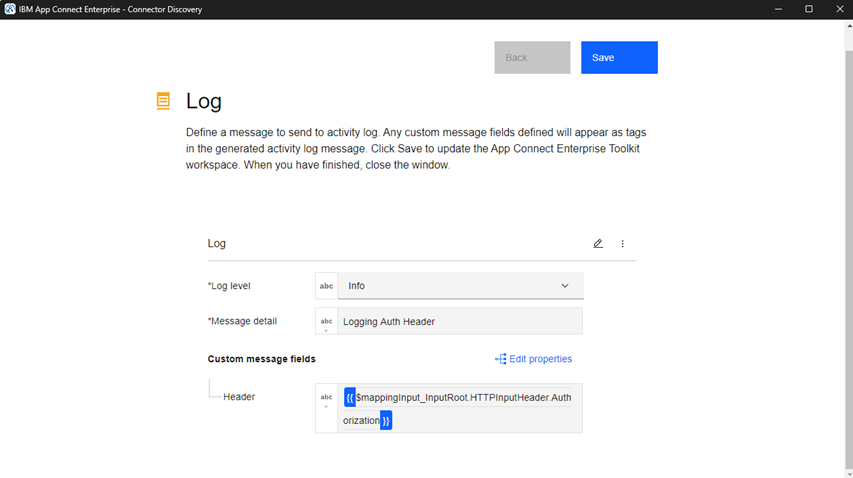
When your message contains the header, it appears in the Activity Log Tags.
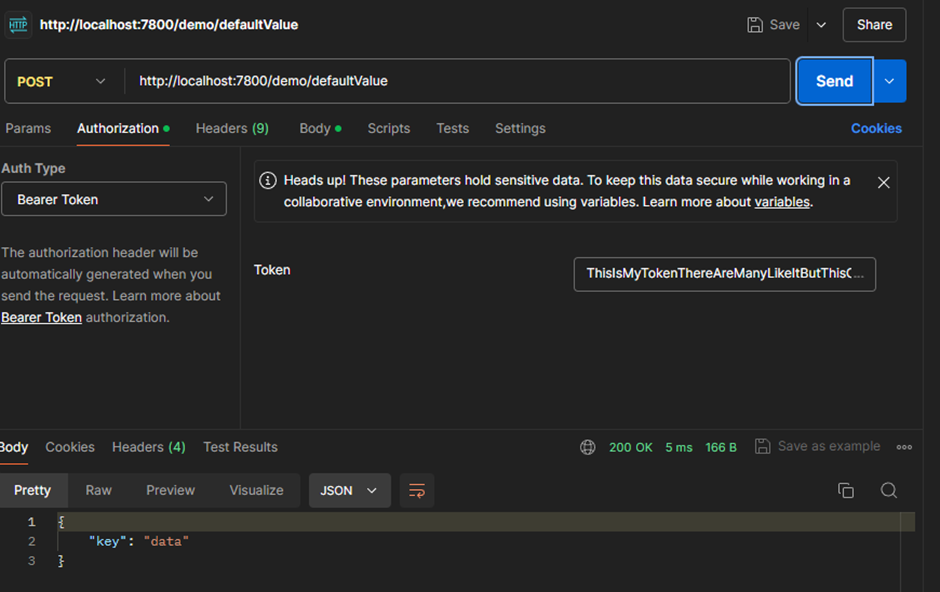

If the field is missing, the tag disappears.
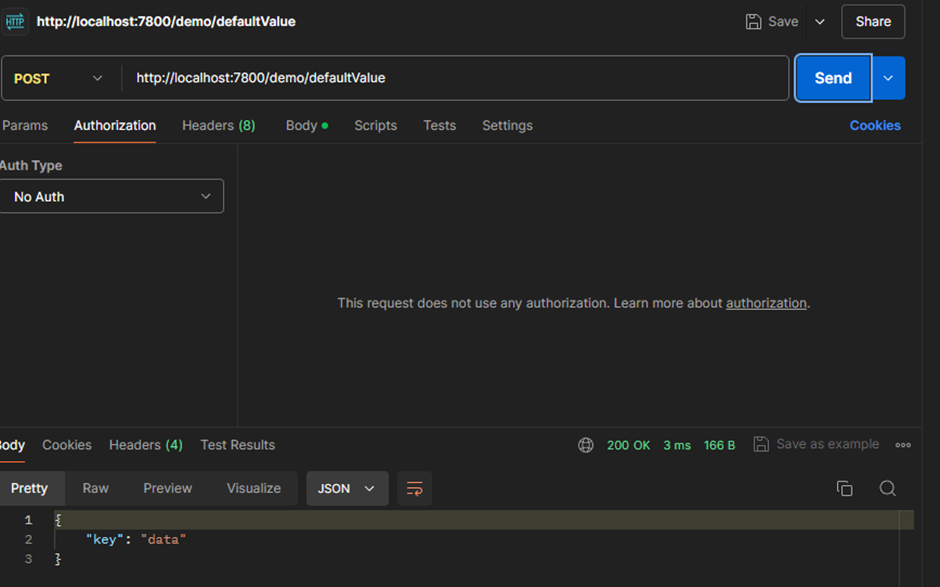

This behavior isn’t always ideal and can complicate troubleshooting. Adding default values can help clarify the situation. When you go through the functions, there is no default or coalesce function available in JSONata, then how can you do it? If you would write this in JavaScript, you would simply type the following:
Authorization = $mappingInput_InputRoot.HTTPInputHeader.Authorization || UNDEFINED
But that doesn’t work in JSONata. What you can do is either one of these:
- Use a ternary operator expression.
- Use sequence flattening.
Ternary Operator
A ternary operator is essentially an IF statement in expression form:
condition ? ifTrue : ifFalse
Apply this to our JSONata example:

{{$mappingInput_InputRoot.HTTPInputHeader.Authorization ? $mappingInput_InputRoot.HTTPInputHeader.Authorization: "FALLBACK"}}
What happens is that the first parameter, the actual field, is cast to a Boolean and that result is used to choose between the field value or the fallback value. If the field is an empty sequence, empty array, empty object, empty string, zero or null the expression will default to FALLBACK.
Sequence Flattening
Sequence flattening in JSONata is a useful feature for handling non-existent fields (i.e., an empty sequence). Consider this example:
[$field1, $field2, “FALLBACK”][0]
The code returns the first value of a flattened sequence. If $field1 has a value, it is returned; otherwise, if $field2 has a value, $field2 is returned. If neither has a value, “FALLBACK” is returned. This functions similarly to a chained COALESCE in ESQL.
Here’s how it applies to our example:
![{{[$mappingInput_InputRoot.HTTPInputHeader.Authorization, "UNDEFINED"][0]}} applied to example](https://dz2cdn1.dzone.com/storage/temp/17917211-l7.png)
{{[$mappingInput_InputRoot.HTTPInputHeader.Authorization, "UNDEFINED"][0]}}
Example
Here’s how both options look in a test setup with HEADER_TO and Header_SF:
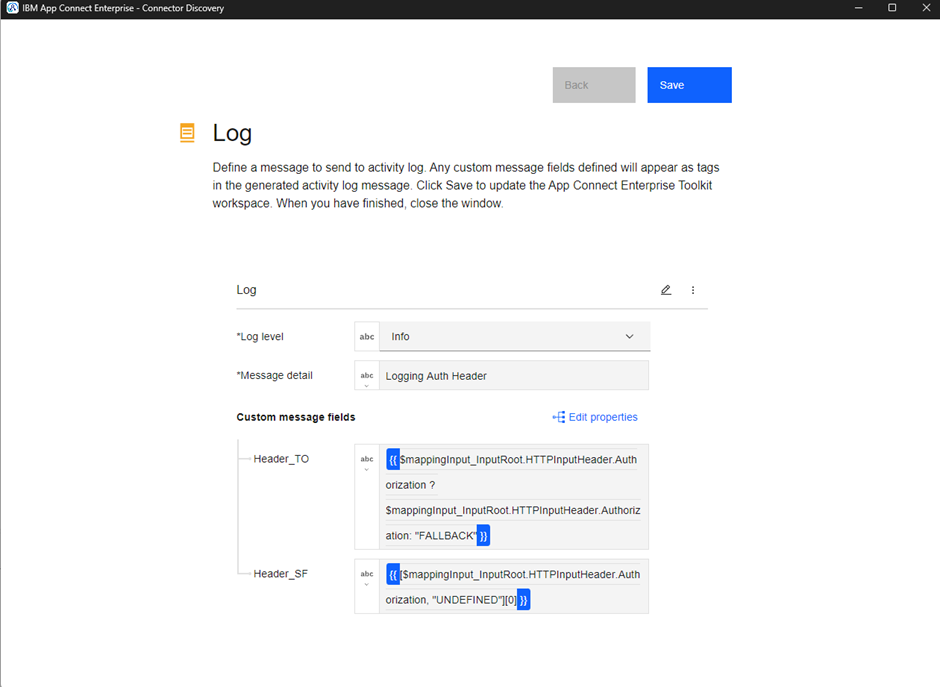
You can see the fields directly from the header as expected:

When the fields are unavailable, the output is:

These examples might not be the most realistic, but you could use them to determine the type of authentication used (e.g., basic, OAuth) or if a specific message field is filled in. Now that you know how to do it, it's up to you to find the right use case to apply it to.
Conclusion
By using the Log node to capture and log ExceptionList inserts, you can significantly enhance your ability to monitor and troubleshoot message flows in IBM App Connect Enterprise. This approach ensures that all relevant error details are readily available in the activity log, making it easier to diagnose and resolve issues.
Acknowledgment to Dan Robinson and David Coles for their contribution to this article.
Resources
Published at DZone with permission of Matthias Blomme. See the original article here.
Opinions expressed by DZone contributors are their own.

![Change the expression to “$mappingInput_ExceptionList[0..1].Insert”](https://dz2cdn1.dzone.com/storage/temp/17917194-m15.png)
Comments