Two Ways to Debug With Render
When you use Render to deploy your Node.js application with Postgres database, you can debug easily with integrated tools like Datadog and Log Streams.
Join the DZone community and get the full member experience.
Join For FreeRender is a one-stop shop for web application infrastructure, simplifying the hosting of static content, databases, microservices, and more. Whether you’re maintaining a monolith application or have adopted a microservice pattern — and you’re not yet ready to create an entire SRE team — Render is a good choice for your infrastructure and hosting needs.
In this article, we’ll focus on debugging in Render. We’ll build a simple Node.js microservice with a PostgreSQL database. We’ll deploy these two components with Render and then demonstrate two different ways to debug our service and database. We’ll use Log Streams for accessing syslogs and Datadog for observability metrics and alerts.
Are you ready? Let’s dive in.
Hosting a Node.js App With Render
The intent of this article is not to do a deep dive into building a Node.js microservice application. However, if you have some experience with Node.js, TypeScript, Express, and PostgreSQL, you’ll likely find additional value in the code presented here.
Our mini-demo application is a user management API with several typical endpoints for retrieving, creating, updating, or deleting users. Behind the scenes, the service performs query operations on the PostgreSQL database. You can find the complete application code here.
Set Up a Datadog account
Before we can set up our PostgreSQL instance, we’ll need to get our hands on a Datadog API key. You can sign up for a free trial account and then follow these instructions to obtain an API key. We’ll discuss Datadog in more detail soon.
Deploy a PostgreSQL Instance
We’ll start with the PostgreSQL instance since we’ll need database credentials before we can use our Users service. To create an instance for your project, log in to Render and click the New + button in the top right corner. Then, click on PostgreSQL to start the process. This drops you into a form to configure your database:
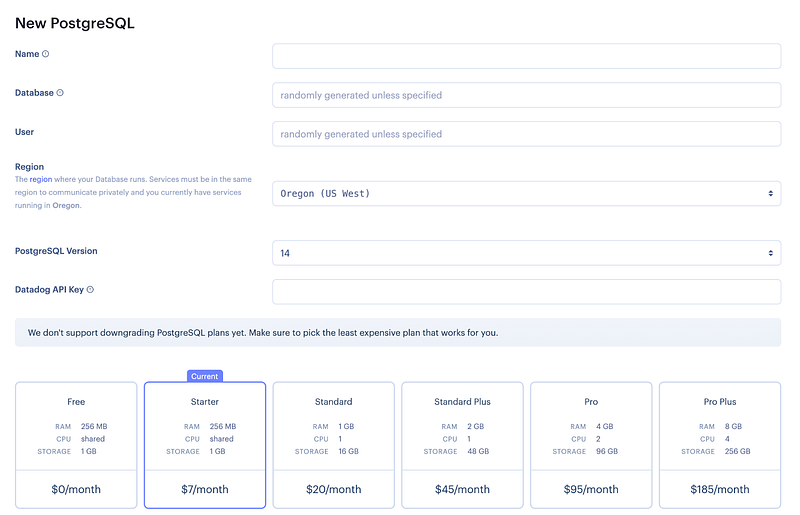
Specify a name for your instance, along with a database name and user name for access. For the “Datadog API Key” field, it’s important to add this now because it’s difficult to add it after the database has been created. Paste in the API key that you generated from the previous step.
Click Create Database and wait for the initialization to complete. Render will display the credentials for your new database. You’ll need those later when setting up your Users service.
Initialize Database Schema
Note also that we’ll need to initialize the schema in this new database, creating a users table with proper columns. We’ll do this via the node-pg-migrate package. The instructions for initializing the database are in the code repository’s README file. However, we’ll bundle this step into our application’s startup command on Render.
Deploy Users Microservice
Deploying a microservice with Render is straightforward, especially if you host your code in GitLab or GitHub. After you connect your code hosting account to Render, return to your Render dashboard. Click on the New + button and select Web Service. Select the code repository with your microservice.
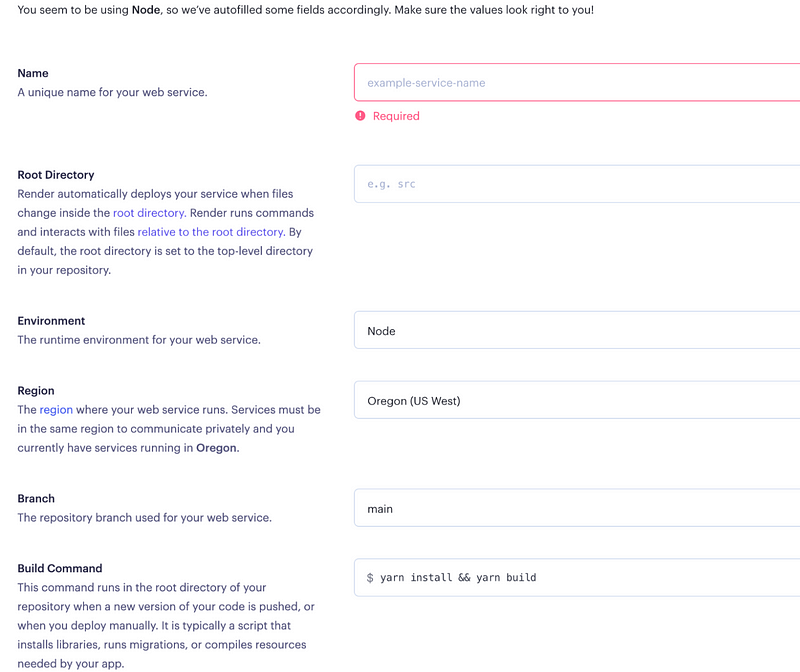
Each input field is well-documented on this page. For our example Node.js service, we want to ensure the following:
- The “Environment” should be set to
Node. - The “Build Command” should be
yarn install && yarn buildso that all the dependencies are installed and the final system is built. - The “Start Command” (not shown) for this particular product will run our database migration and start up our application. It should be:
yarn migrate up --no-reject-unauthorized && yarn start:prod.
In addition, the “Advanced” menu contains additional fields that we’ll need to fill in for this project.
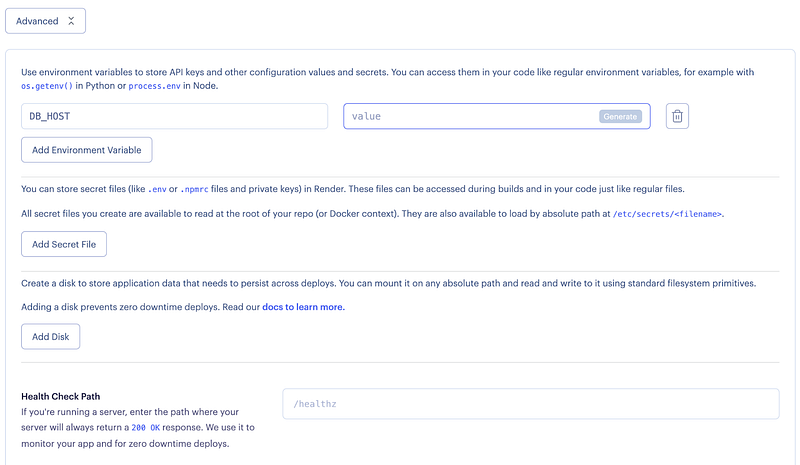
We need to set five environment variables for database connectivity:
DB_HOSTDB_NAMEDB_USERDB_PASSWORDDATABASE_URL— This is the database connection string used bynode-pg-migrate. Its value ispostgres://DB_USER:DB_PASSWORD@DB_HOST:5432/DB_NAME, with the actual values for these placeholders filled in. For example:postgres://john:Ue473C@dpg-1g50-a.oregon-postgres.render.com:5432/mydb
These credentials should come from the PostgreSQL instance you created in the previous step.
Lastly, make sure to set the “Health Check Path” to /health to facilitate zero-downtime deploys and health monitoring within Render.
Click Create Web Service. Render will work its magic and deploy this service from your repository!
Debugging With Datadog
Datadog is a cloud-based SaaS that provides extensive log aggregation and searching tools as well as monitoring and alerting capabilities. Whether you have a single service or ten thousand, Datadog is a useful tool for gaining a deeper understanding of how your resources are running.
We’ve already connected our PostgreSQL instance to Datadog by including the Datadog API key during its creation. This provides monitoring capabilities for many different metrics on this database instance. The full list of supported metrics for PostgreSQL is available here. Let’s look at how to use these metrics for monitoring and alerting.
Exploring Metrics
Log into your Datadog account and navigate to the Metrics page.
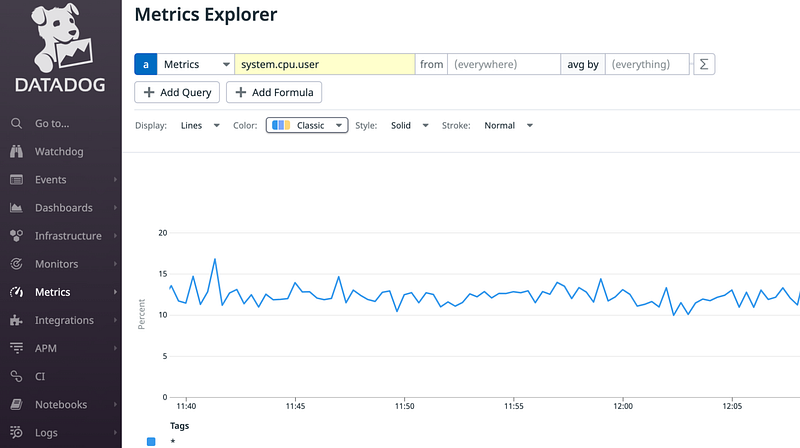
The top line of the Metrics Explorer shows the metric query toolbar with various dropdown and input boxes for filtering what metrics are displayed in the graph. The default metric, system.cpu.user, is shown. If your database was configured correctly with the API key, then you should see a line graph displaying the percentage of time the CPU spent running user space processes.
When you click on the “from” dropdown menu, you’ll see two potential sources for your database’s metrics:
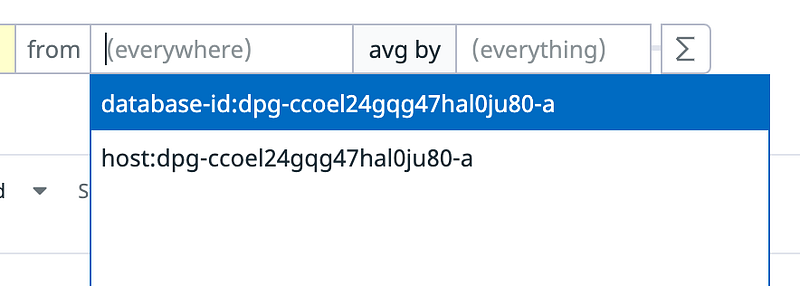
Metrics can be shown based on a specific database within a host, or across the entire host. For our example, there is only one database instance running on the host. Therefore, with this particular metric, there’s no difference between the database-specific and the host-specific metric.
If you want to investigate a different metric, select the first input box and enter system.mem. The auto-complete will show different memory-related metrics:
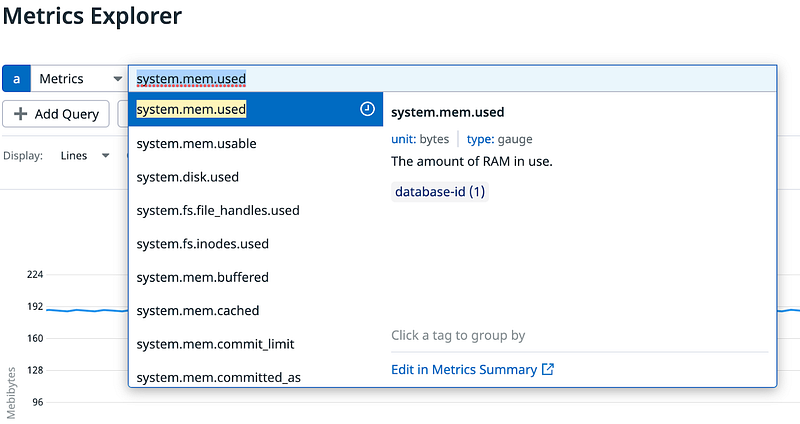
If you select system.mem.used, you’ll start to see the database host’s memory that is in use. Notice that the dialog provides a description of the selected metric.
The PostgreSQL-specific metrics that are available in Datadog are also interesting. For example, we can monitor the number of active connections to the database at any time.
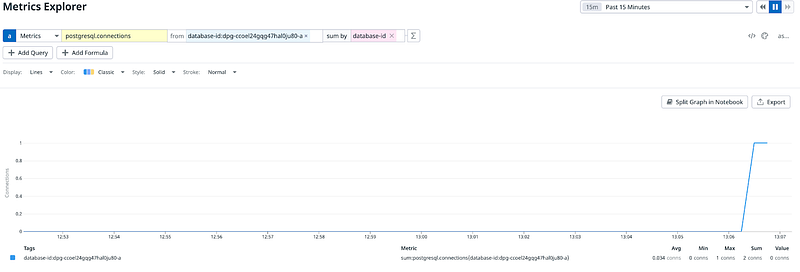
In this query, the “from” field uses the single-database instance, and Datadog sums the data based on the database-id property on the metric.
Monitoring is a useful debugging tool. If you’re experiencing slow database response with your application, you can view the current metrics in Datadog. By correlating PostgreSQL metrics like query times or connection counts with application response times, you might surface a poorly written query associated with a specific endpoint or specific code that is improperly cleaning up database connections. Access to these metrics may provide the key to solving an issue.
Of course, resolving an issue usually depends on your awareness that the issue is occurring.
Fortunately, Datadog provides significant resources for alerting upon an occurrence of poor performance currently happening with your systems. You can configure these alerts to monitor the metrics that you choose, pushing notifications to various places.
Let’s talk about Alerts as a tool for debugging web applications.
Alerts in Datadog
Select Monitors from the Datadog navigation bar, and then select New Monitor and choose the Metric monitor type.
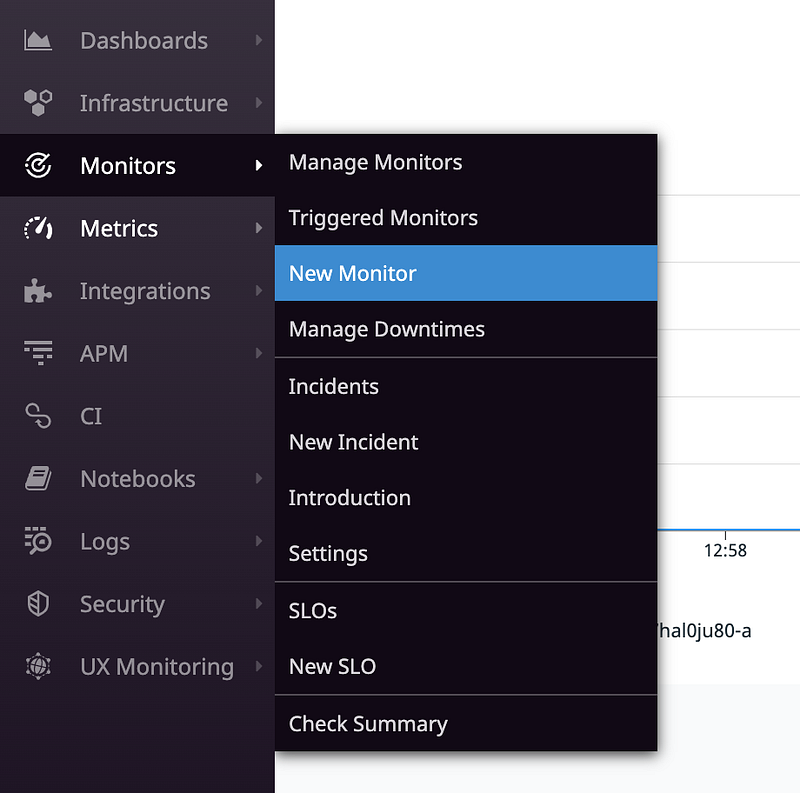
We’ll create a monitor to alert us when the number of active database connections exceeds a threshold.
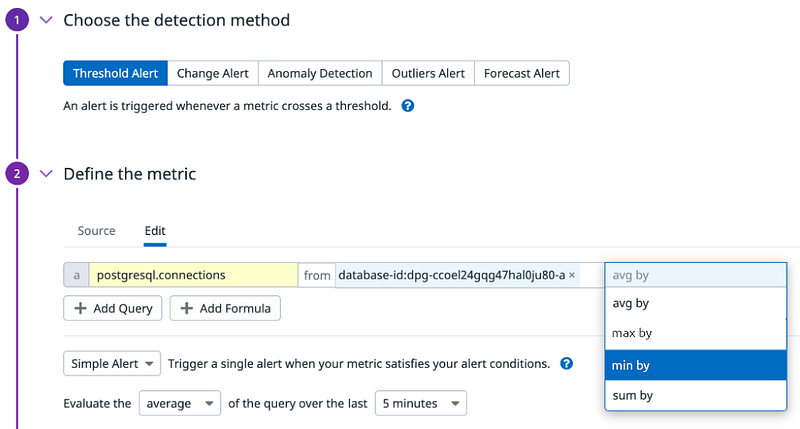
Select Threshold Alert and then define the metric query just as you would on the metrics page. We want to use the postgres.connections metric from our single database instance. Lastly, we select the min by threshold. If the “minimum number of connections” is above a threshold, this indicates that there are currently too many connections on this database instance. That’s when we should be alerted.
Next, define the threshold values that trigger an alert:
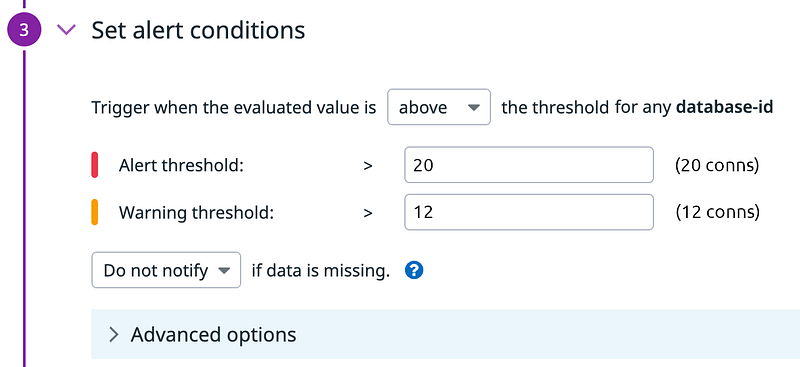
This is a contrived example, but it means that Datadog will trigger a warning if it detects 12 connections to the database over the past five minutes. Meanwhile, we’ll receive a full alert on 20 connections to the database over the past five minutes.
Finally, we set up the notifications to occur when an alert is triggered. For example, Datadog can send notifications to Jira, Slack, or a custom webhook endpoint. Setting up notifications is beyond the scope of this article, but the Datadog documentation for notifications is clear.
Alerts are important for debugging a web application, as they raise awareness that a problem is happening, pointing you to the relevant metrics describing the current state of the system.
The metrics we’ve looked at so far are mostly of the “outside the system looking in” variety. Next, let’s look at how to use logs to understand what is happening inside of the system itself.
Debugging With Log Streams
In Node.js development, using console.log is a common debugging technique. Seeing log output is easy when you’ve deployed your Node.js application to your local machine, but it’s challenging if you’ve deployed it to the cloud. This is where Log Streams help.
Render Log Streams enable the exporting of syslogs from your deployed services to an external log aggregator. Datadog is one example, but Render supports others too, including Papertrail and LogTail.
Set Up syslog Export
To set up syslog export, log into your Render account and go to your Account Settings page. Click on Log Streams. Add the endpoint for your log aggregator, along with an API token (if any). For our example, we’ll send our syslogs to Datadog.

In Datadog, navigate to the Logs tab.
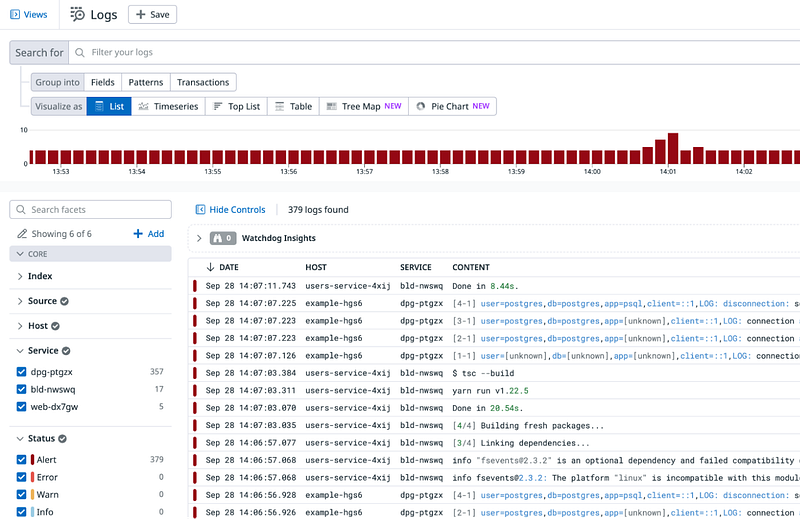
This brings you to the Log Search dashboard where you can see a live tail of all the logs being ingested by your Datadog account. This includes logs emitted by our database instance, our Node.js microservice, and the Render build process for our microservice.
To narrow down the logs, we can add the hostname to the query search bar. The result will show only those logs coming from our Users microservice instance (both the application logs and the Render build logs).
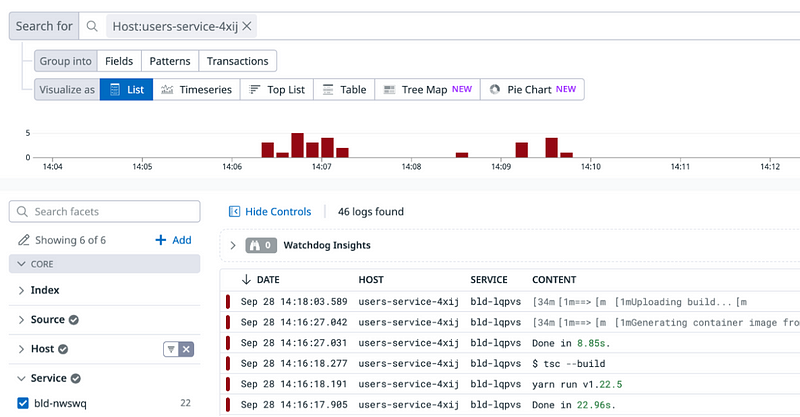
Logs emitted from the application via console.log or a logger such as Pino will show up here, aiding in the debugging effort. You can trace entire requests through your systems by following them through your various services logs. As data flows through your system from your API endpoints to the service layer and then to the database layer, you can use logs to track down the root cause of issues.
Leveraging Logs for Debugging
How might you use logs from your Node.js application to help you with debugging? Here are a few helpful suggestions:
- Emit a log when catching an exception. Using try-catch is good practice because it ensures graceful handling when an error is thrown. In the
catchblock, you can do more than just handle the exception; emit a log message with helpful contextual information. Then, query for these kinds of messages in your log management system to track down the root cause. - Use other severities besides
log. When using console, you’re not limited to just usingconsole.log. You can also use functions likeconsole.info,console.debug, andconsole.error. Doing so will help you differentiate the severity of what you’re logging, making it easier to query or filter for specific issues. - Set up alerts on certain log conditions. Most log management systems have an alerting mechanism, allowing you to set certain conditions on incoming logs which would result in triggering a notification. For example, if your Node.js application logs every HTTP response code (such as
200,401, and500), then you can set up an alert to notify you when a certain response code is seen too frequently. You could set up an alert to tell you when a500or a401code has been seen more than five times in ten minutes, indicating a possible issue that needs to be dealt with immediately.
Conclusion
In our mini-project, we built a small microservice application using a simple Node.js backend service and a PostgreSQL database. We deployed both pieces to Render so that we could explore system debugging through Render. We looked at two different ways of debugging:
- Sending observability metrics to Datadog, working in conjunction with alerts and notifications.
- Using Log Streams to export syslogs from your different application components, which we also viewed in Datadog.
When issues with your microservice application arise, your team needs to respond quickly to reduce or prevent downtime. Effective debugging techniques coupled with alerts and notifications can equip you for fast response. If you’re deploying your application to Render, then you have quick and simple facilities — a Datadog integration and Log Streams — to provide real-time debugging insights and alerts.
Published at DZone with permission of Alvin Lee. See the original article here.
Opinions expressed by DZone contributors are their own.

Comments