Detect Performance Bottlenecks with Transaction Tracing
Distributed transaction tracing is a useful way to monitor or evaluate your microservices architecture for performance, particularly when measuring end-to-end requests.
Join the DZone community and get the full member experience.
Join For FreeWhen you’re building a monitoring solution or evaluate existing ones, what do you look for? Probably these four core aspects of functionality:
- Collection and display of metrics
- Alerting based on metric values and anomalies
- Collection and display of server and application logs and other types of events
- Alerting based on log patterns and metrics extracted from logs
But there is really one more juicy piece of functionality one should look for:
Distributed Transaction Tracing
This can be especially useful in Microservices architectures where complex applications are composed of multiple components and services talking to each other over the network while servicing user requests. As a matter of fact, Dennis Callaghan, senior analyst of infrastructure software at 451 Research, points out:
Microservices solve a lot of challenges, and that’s why they are becoming the standard architecture both within and between applications. We anticipate accelerated adoption of microservices in enterprises this year. But those enterprises need two things in order to effectively monitor microservices architectures. One is the ability to see application and transaction behavior and trace transactions across these increasingly complex and distributed environments. The other is an APM economic model that makes sense and reflects the need to monitor many more smaller instances.
SPM has always had the “APM economic model that makes sense and reflects the need to monitor many more smaller instances”, which is basically the metered model where you pay only for what you use. This post is about the other key part highlighted in Dennis Callaghan’s statement: “ability to see application and transaction behavior and trace transactions across these increasingly complex and distributed environments”.
What is Distributed Transaction Tracing?
[Note: If you know what Transaction Tracing is and what the benefits are, you can jump right to the bottom of this post to see how to enable it.]
When we say transaction in this context we are not referring to database transactions. In the context of Application Performance Monitoring, Transaction Tracing refers to end-to-end request code execution that can span multiple applications running and multiple servers. For example, when you shop on Amazon.com and search for a product there, your search action starts a request transaction that can be traced though various layers of Amazon.com’s application and server infrastructure, all the way down to the database and back. That is what SPM’s Transaction Tracing can do, too, for your own applications and servers.
Where Transaction Tracing Fits In
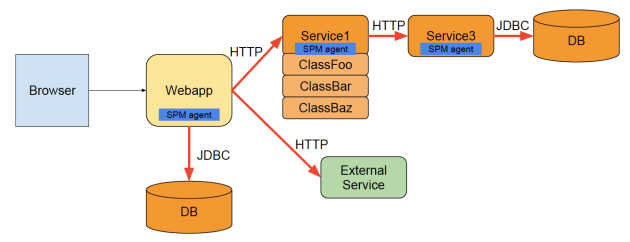
Let’s start with a simple diagram. The little “SPM agent” box is the embedded agent responsible for tracing all transactions and capturing information about them. Everything in orange and all red arrows would be traced by SPM’s agent, even as transactions go across networks and hop from server to server – hence Distributed Transaction Tracing.  Now, let’s quickly look at a slightly more complex diagram:
  Here we also see an external HTTP service (e.g. third party REST API) our application talks to via HTTP. That, too, is captured, along with all orange components and red arrows. We can also see Service1 has multiple internal classes and methods. SPM traces execution deep inside your code, too, so it can tell you which methods in which classes are slow.
How / Why is Transaction Tracing Useful?
In short, Transaction Tracing is great for:
- Pinpointing root causes of poor application performance, so you can fix ‘em and make your users happy and your mom and dad proud!
- Finding the slowest parts of your application, so you can speed up troubleshooting and get the most return for your development time
Have a look at the following chart and you’ll be able to relate. It shows the response time for one of our real components deployed in production. You can see how response time improved at one point, right? We enabled Transaction Tracing to find and fix a bottleneck in our own code. In short, we went from the 99th percentile response time for one of the components being 1-3 seconds to about 0.15-0.30 seconds. That’s about 10x faster! 
Where and How to Enable Transaction Tracing
If you’ve been using SPM you are likely to use one of its integrations for monitoring your backend infrastructure – Apache Spark, Solr, Storm, Elasticsearch, Hadoop, Cassandra, Kafka, that sort of backend stuff. As you can see from the above diagrams, transaction tracing starts closer to the front-end — in the tier that runs client applications which talk to backend and remote services, as well as data stores like Solr, Elasticsearch, Cassandra, HBase, MySQL, and data processing frameworks like Apache Spark or Kafka, or even Hadoop. In other words, to get the full benefit of Transaction Tracing you need to do the following:
- If your webapps run in Tomcat create a new SPM App for Tomcat. If you use Jetty, Glassfish, JBoss, or some other Java container simply create an SPM App for JVM.
- Add SPM Agent to your webapp tier (e.g. to your webapps running in Tomcat, Jetty, Glassfish, JBoss, and similar Java containers). Use the Embedded (aka javaagent), not Standalone mode.
- Enable Transaction Tracing in SPM Agent configs in all your tiers.
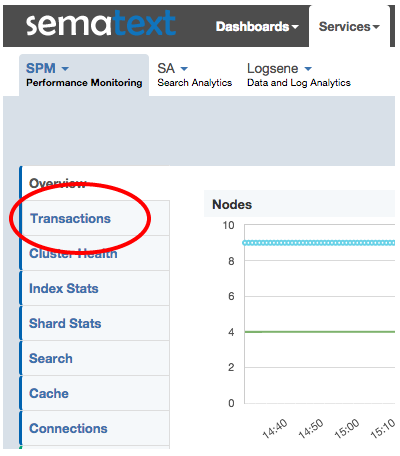
And that’s it. Once you have Transaction Tracing enabled look under the new Transactions tab in SPM:
What’s more, as a nice side-effect of Transaction Tracing in SPM you will also get:
- Your app’s Request Throughput, Response Latency, plus Error & Exception Rates
- AppMap, which which how various components in your infrastructure communicate with each other
In the coming days, we’ll be publishing more information about Transaction Tracing in SPM, including how-tos, additional functionality derived from Transaction Tracing, etc. In the meantime, here are the key points:
- Transaction Tracing does not require you to modify any source code – the instrumentation is done automatically, at the JVM bytecode level
- Transaction Tracing is currently available for Java and Scala apps running inside the JVM
- Transaction Tracing is exposed via the new “Transactions” report (tab) on the left side in the UI. That said, the key bit to understand is that Transaction Tracing is really means for finding bottlenecks in your applications and how they talk to backend services, frameworks, and external services, not in the backend applications your applications connect to. See the diagram further above.
- We support deep insight into specific technologies listed in SPM Transaction Tracing documentation
- You’ll want to grab the latest version of the SPM client (it has some optimizations, too!)
- You’ll need to use the SPM monitor in the embedded (aka javaagent) mode, not standalone
- To add Transaction Tracing to your own custom apps you can easily create a custom pointcut
Not using SPM yet, but would like to trace your apps? Just register here. It doesn’t hurt, doesn’t require signing your life or kids away, there is no commitment, and you can leave your credit card in your wallet. You get 30 days Free for new SPM Apps. You can invite your colleagues, so you can collaboratively monitor your app and find those pesky bottlenecks! Oh, and if you are a young startup, a small or non-profit organization, or an educational institution, ask us for a discount (see special pricing)!
Published at DZone with permission of Radu Gheorghe. See the original article here.
Opinions expressed by DZone contributors are their own.


Comments