Top 5 Datadog Integrations To Improve the Efficiency of Tech Teams
Are you looking for Datadog integrations that can skyrocket your team's efficiency? Here are the top 5 recommendations given by experienced DevOps engineers.
Join the DZone community and get the full member experience.
Join For FreeDatadog is an exceptional tool for DevOps teams, developers, and SREs. It's suitable for a broad range of cloud applications of every size. However, despite its powerful capabilities, most businesses aren't making the most of Datadog. Are you?
- Can you see how newly launched features are affecting user experience?
- Can you immediately see the root cause of an issue on your dashboard – without digging around?
- Are you managing Jira tickets directly in Datadog?
Datadog’s integrations help make the platform stand out, but using them to make Datadog more powerful can be confusing, as there are over 500 interesting tools to consider.
We've consulted with several experienced DevOps engineers and, based on their recommendations, we have selected five Datadog integrations that are sure to boost your team’s efficiency.
But First, What Is Datadog?
Datadog is an observability platform offering monitoring, security, application performance monitoring (APM), analytics, and more. It can keep tabs on your cloud or on-premises infrastructure and help maintain high uptime and system performance. Datadog supports all development operations, including security and scaling. Datadog can:
- Monitor the performance of your apps
- Facilitate troubleshooting
- Optimize performance
- Monitor logs and puts them in context for better analysis
Five Effective Datadog Integrations
1. Zebrium

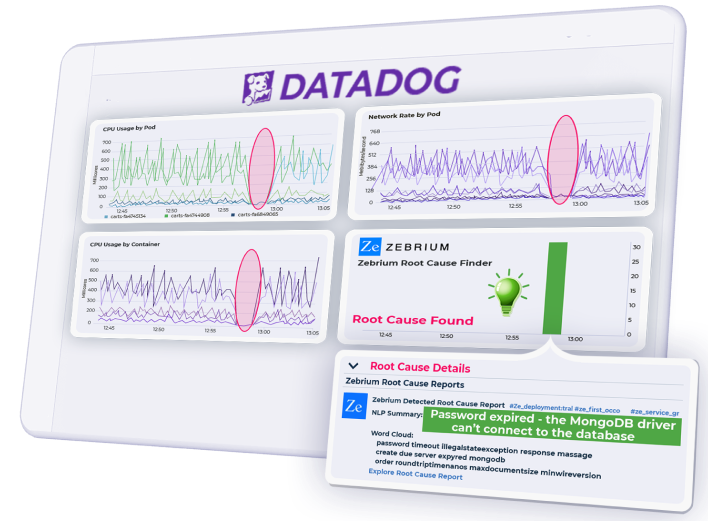
Datadog dashboards can be super insightful for monitoring an application’s overall health, but sometimes the dashboard will highlight a problem that requires you to then dig through logs manually to figure out exactly what happened. This can be very time consuming and often requires special skills. The Zebrium Datadog integration makes this much easier and more efficient.
About Zebrium
Zebrium is what's known as a root-cause-as-a-service (RCaaS) platform that uses unsupervised machine learning (ML) on logs. It doesn't require manual training or human-built rules: all it needs are your existing logs. In simple terms, it ingests logs and automatically finds the root cause of software and infrastructure problems.
Zebrium Datadog Integration

Zebrium RCaaS for Datadog is an ML-based integration that augments the data on any Datadog dashboard. When there’s any kind of software or infrastructure incident, Zebrium automatically displays the root cause directly in your dashboard, saving DevOps/SRE/engineering teams hours of manual work.
Zebrium Features
- When a problem occurs, a detection is automatically displayed in any Datadog dashboard, and with a click, you can see a small set of relevant log lines that explain the root cause.
- Getting started takes only a few minutes. Zebrium achieves accuracy without manual training and in less than 24 hours.
- A recent customer case study by Cisco found that Zebrium automatically found the root cause in over 95% of incidents.
You may want to integrate Zebrium and Datadog right now if you have a Zebrium SaaS license. Otherwise, you can start with a free trial to see how Zebrium can work for you.
2. Sentry

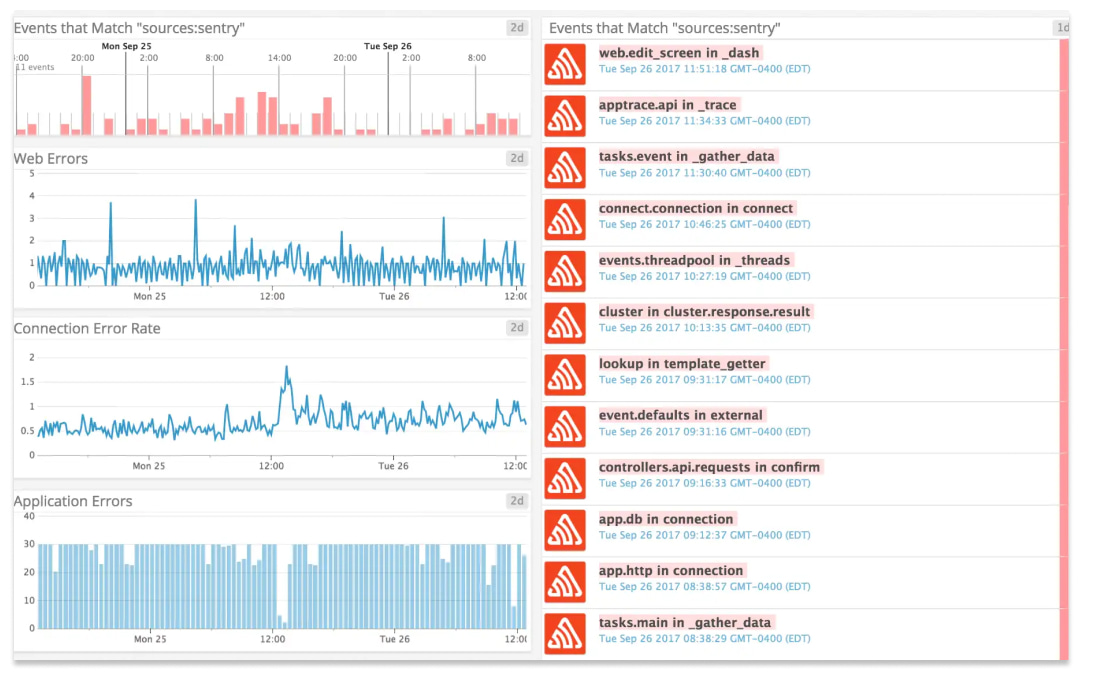
Performance issues can slow down an application and result in unacceptable downtime. Integrating a tool like Sentry into Datadog will help you track both frontend and backend issues.
About Sentry
Sentry can help you detect exceptions in real-time. This helps to eliminate performance barriers in almost all programming and scripting languages, frameworks, and libraries. Sentry works for JavaScript, Python, Ruby, iOS, Android, Go, NodeJS, Kotlin, Scala, PHP, and many other languages. It can also monitor projects built on Django, React, Laravel, Vue, Flask, and Rails, among others.
Sentry Datadog Integration

Using Sentry with Datadog lets you consolidate exceptions, search for them in graphs, and share comments collaboratively with your team. The quick view of real-time exceptions means you can focus on debugging and improving your system's performance.
Sentry Features
- Detect exceptions in streams in real-time.
- Search for exceptions in your graphs.
- Collaborate on debugging with the handy comment functionality.
To learn how to integrate Sentry with Datadog, see the documentation here.
3. Gremlin

It's crucial for DevOps to have a resilience testing mechanism in place. Gremlin offers a secure and performance-oriented application delivery process.
About Gremlin
Gremlin can be described as a failure-as-a-service (FaaS) tool. It helps you detect critical failures before they happen and reduce incident resolution time when they do. Its ability to improve the resilience of distributed systems means it is considered among the top chaos engineering tools.
Gremlin Datadog Integration

When you integrate Gremlin with Datadog, you can view, pause, and re-run simulated attacks directly from Datadog. This way, you can add context to failures in your Datadog workflows. Gremlin effectively tests the behavior of your network in chaos.
The graph and timeline views allow you to monitor attack events, deploy better infrastructure security practices, and perform efficient troubleshooting.
Gremlin Features
- Gain confidence in your system with failure testing through re-running and halting attacks.
- Have insight and control over chaos monitoring.
- Stay up to date as new attack libraries are always being added.
More information on Gremlin and Datadog integration is available here.
4. Jira

Ticket management is essential for software development teams. If you're using Datadog, you can simplify project tracking by connecting with Jira.
About Jira
Jira software is a key tool in Agile software development for cycle and release planning. It’s commonly used by IT helpdesk and DevOps teams for proprietary issue tracking.
Jira Datadog Integration

With the Jira integration, you can create, update, and resolve Jira tickets regarding Datadog events and issues directly from Datadog. There’s no need to document or sync the details separately, and your engineers will have all the data at their fingertips.
Jira issues can be created manually from your Datadog account, or you can define a metric and conditions to automate the issue creation process. There’s also a command that allows you to modify an existing Jira issue from the Datadog dashboard itself, so there's no need to move back and forth between the tools to ensure a synchronized issue-resolution process.
Jira Features
- Create and manage Datadog tickets without switching to Jira.
- Collaborate more effectively.
- Synchronize operations seamlessly.
If you're not creating Jira tickets from Datadog yet, here’s how to start.
5. LaunchDarkly

LaunchDarkly is a must-have integration for Datadog if you're looking to ship certain features in a release and want to ensure that they lead to improvements in your product. It's an essential tool for rolling deployment strategies.
About LaunchDarkly
LaunchDarkly's comprehensive feature impact monitoring reduces production risk. Developers can see the impact of each feature on their software, including the end-user experience, so they can ensure more stable releases.
LaunchDarkly Datadog Integration

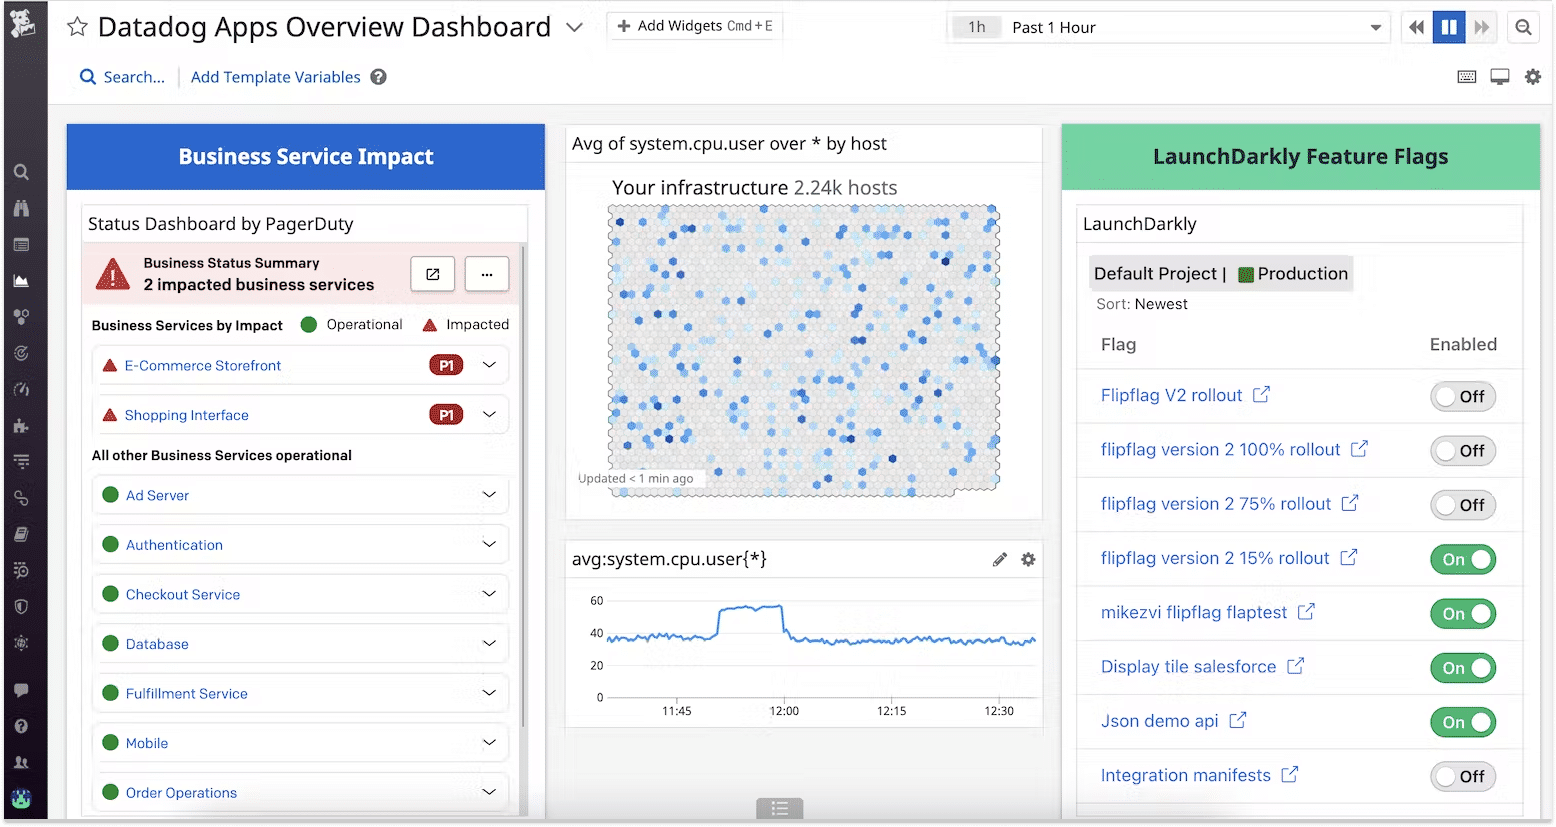
This integration allows you to monitor feature deployments, so you’re aware when issues arise and can clearly see any negative impact reflected in the performance metrics.
Using LaunchDarkly with Datadog, you can monitor any feature of your application in isolation, making it easier to detect and fix errors or performance issues. It can significantly reduce developers’ time and effort and therefore boost productivity.
LaunchDarkly Features
- Monitor applications and feature deployments.
- Flag triggers if performance decline reaches a specified threshold.
- Pin LaunchDarkly widget to your Datadog dashboard.
Considering the integration of LaunchDarkly with Datadog? Here is all you need to know.
Summary
Datadog enables you to comprehensively monitor your systems, services, and applications. With its enormous range of integrations, aggregating of metrics and events across your full DevOps stack becomes much easier. Knowing which tools will bring you the most value is tough. There's auto-discovery, automation, Kubernetes, logs, orchestration, processing, security, testing, caching, Cloud, IoT, monitoring, and plenty more!
Our brief list details just five of the many wonderful Datadog integrations that can save teams precious time and effort. Check out our list for ways to simplify issue tracking, root cause finding, feature impact monitoring, error tracking, testing, ticket management, and releases.
Opinions expressed by DZone contributors are their own.

Comments