Load Testing Your Application Using JMeter, Docker, and Amazon Web Services
Load testing is important to see how your application reacts to a large number of users. Learn how to run load tests with JMeter, AWS, and Docker.
Join the DZone community and get the full member experience.
Join For FreeUpdate: Now also available as a video.
Test how your application will react when many users access it. When building your application, you probably test your application in a lot of ways, such as unit testing or simply just running the application and checking if it does remotely what you expect it to do. If this succeeds you are happy. Hooray for you, it works for one person!
Of course, you’re not in the business of making web applications that will only be used by just one person. Your app is going to be a success with millions of users. Can your application handle it? I don’t know, you don’t know…nobody knows! Read the rest of this blog post to see how we tested an application we are working on at Luminis and found out for ourselves.
Why and How?
Why? Here’s why! I work on a project team at Luminis in the Netherlands, and our job is to make sure that users of a certain type of connected devices can always communicate with said devices via their smartphones. There are thousands of these devices online at the moment and that number is just going to keep increasing. So instead of just hoping for the best, we decided to take matters into our own hands and see for ourselves just how robust and scalable our web applications really are.
How? Here’s How:
- Apache JMeter
- JMeter WebSocket Plugin by my colleague Peter Doornbosch
- Docker
- Amazon Web Services (Elastic Container service, Fargate, S3 and CloudWatch)
- A lot of swearing when things don’t go the way you expect
Apache JMeter

I’ll let the JMeter doc speak for itself:
“The Apache JMeter™ application is open source software, a 100% pure Java application designed to load test functional behavior and measure performance. It was originally designed for testing Web Applications but has since expanded to other test functions.”
I’m sure that description got you in the mood to start using JMeter immediately (/endSarcasm). The best way to look at JMeter for now is to think of it as a REST client that you can set up to do multiple requests at the same time instead of just performing one. You can create multiple threads that will run concurrently, configure the requests in many ways and view the results afterward in many types of views.
Download and install it from here: https://jmeter.apache.org/.
When you startup JMeter, it looks like this:
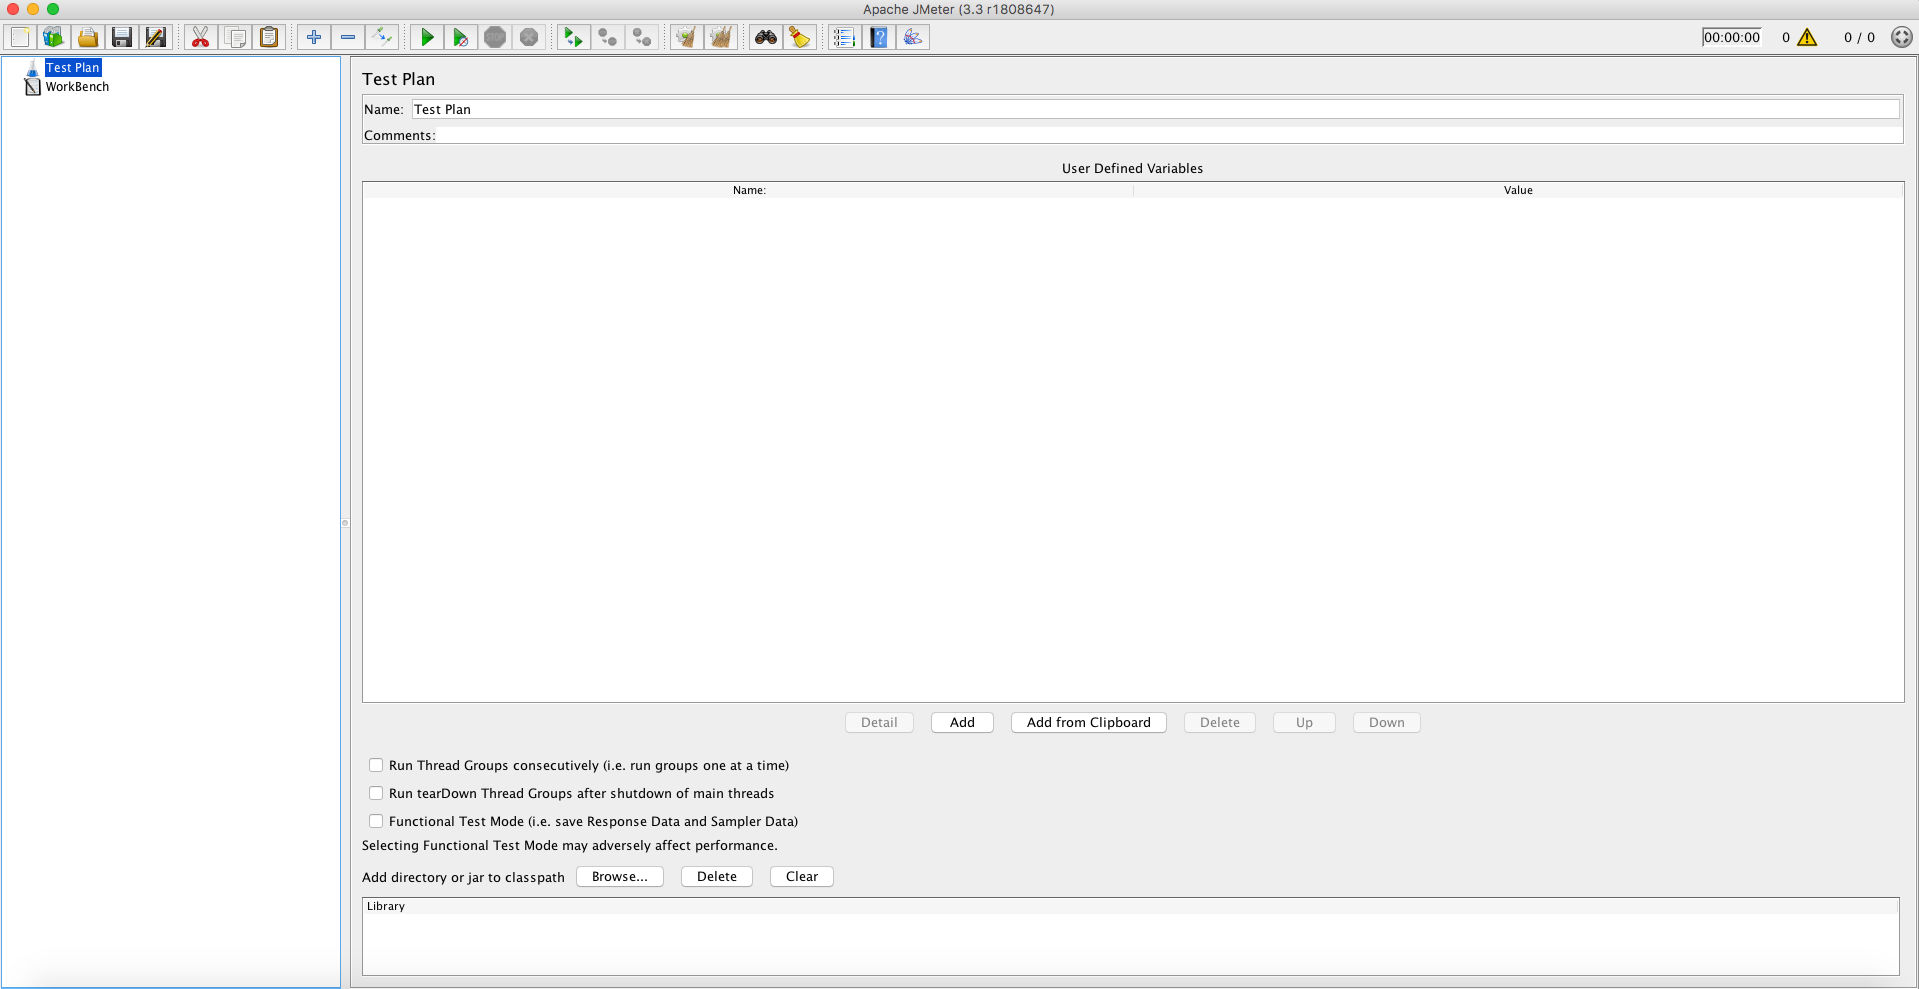
I know what you’re thinking. “Mine doesn’t/won’t look like that, I have a Windows PC.” Don’t worry, it works there too (provided you have Java installed). It’s just Java!
There are a lot of things you can do in JMeter, however, I’m going to focus on the essentials you need to perform a load test on your REST endpoints. In the next section, I will also show how to perform load tests if you use WebSockets.
Let’s just ignore all of the buttons for a while and just focus on the item called “Test Plan”, which is highlighted in the first image. You can leave the name as it is, I personally never change it. I just change the name of the .jmx file, which is the extension for JMeter scripts.
Thread Group
Right-clicking on the Test plan will bring up the context menu. The first thing you want to do is create a thread group, which will be used to create multiple threads making it possible to make requests in parallel:
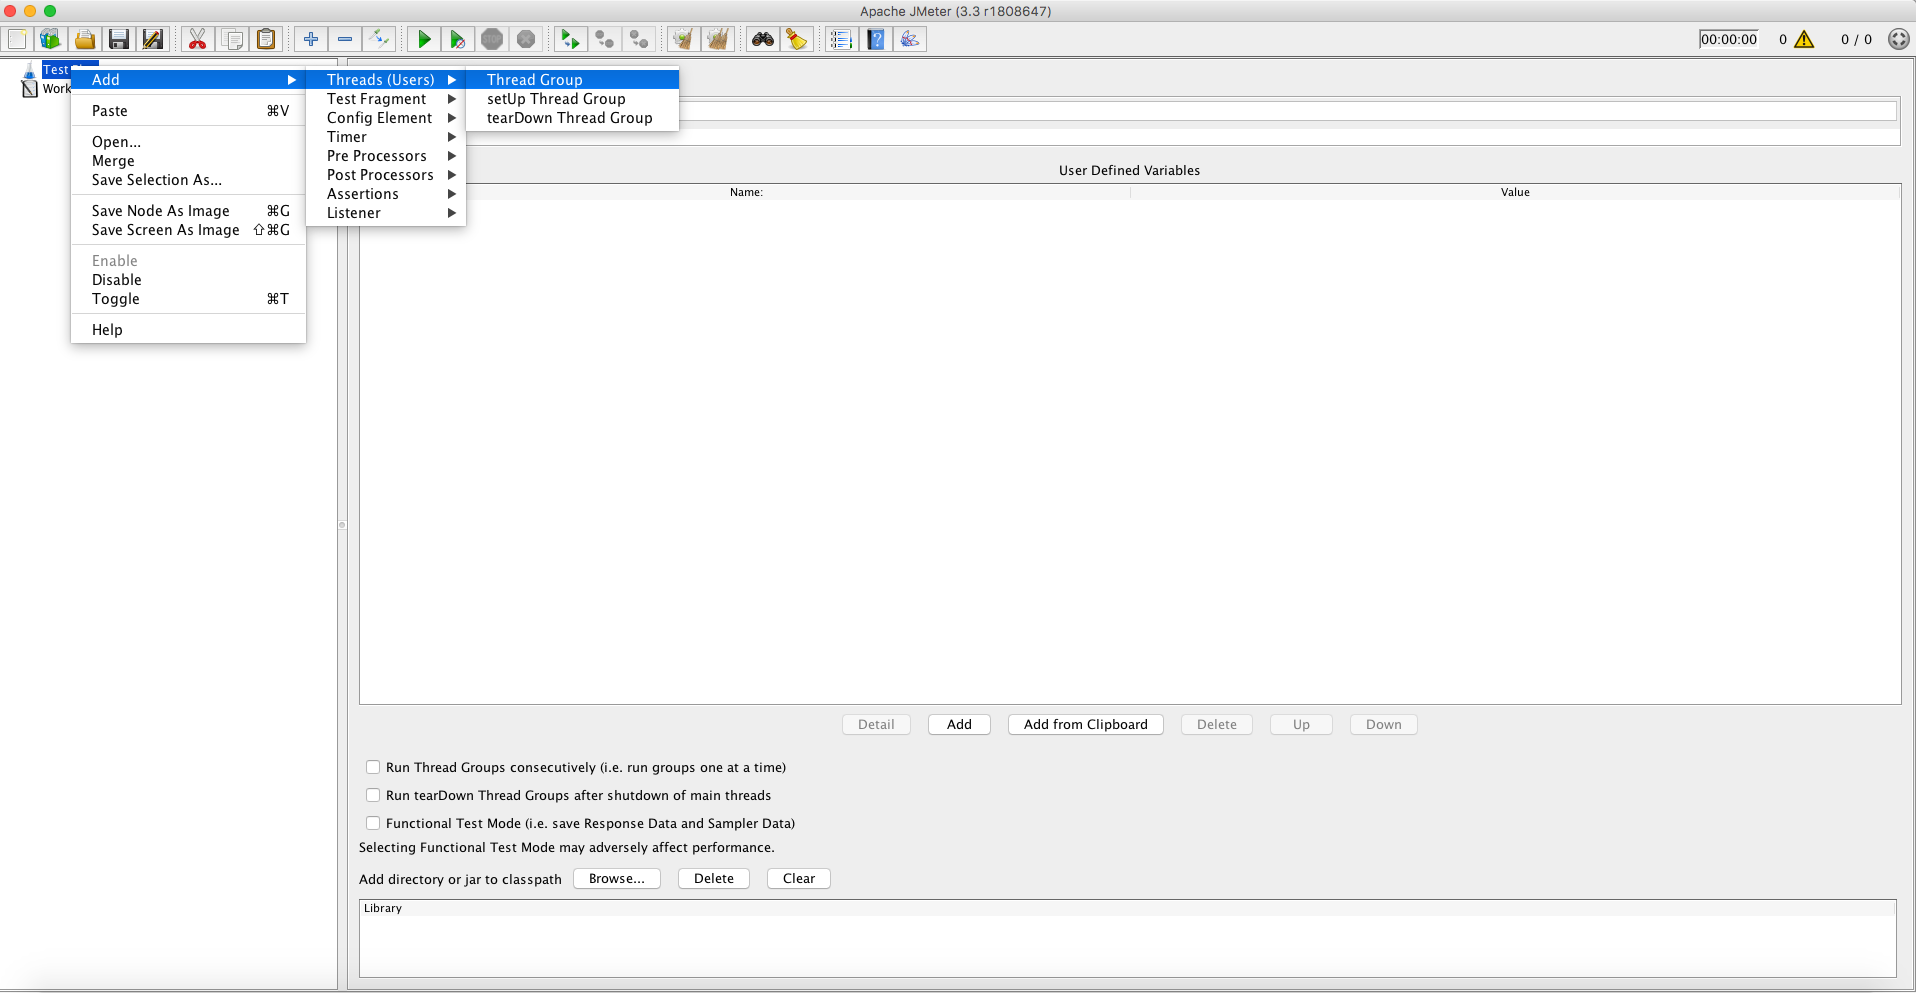
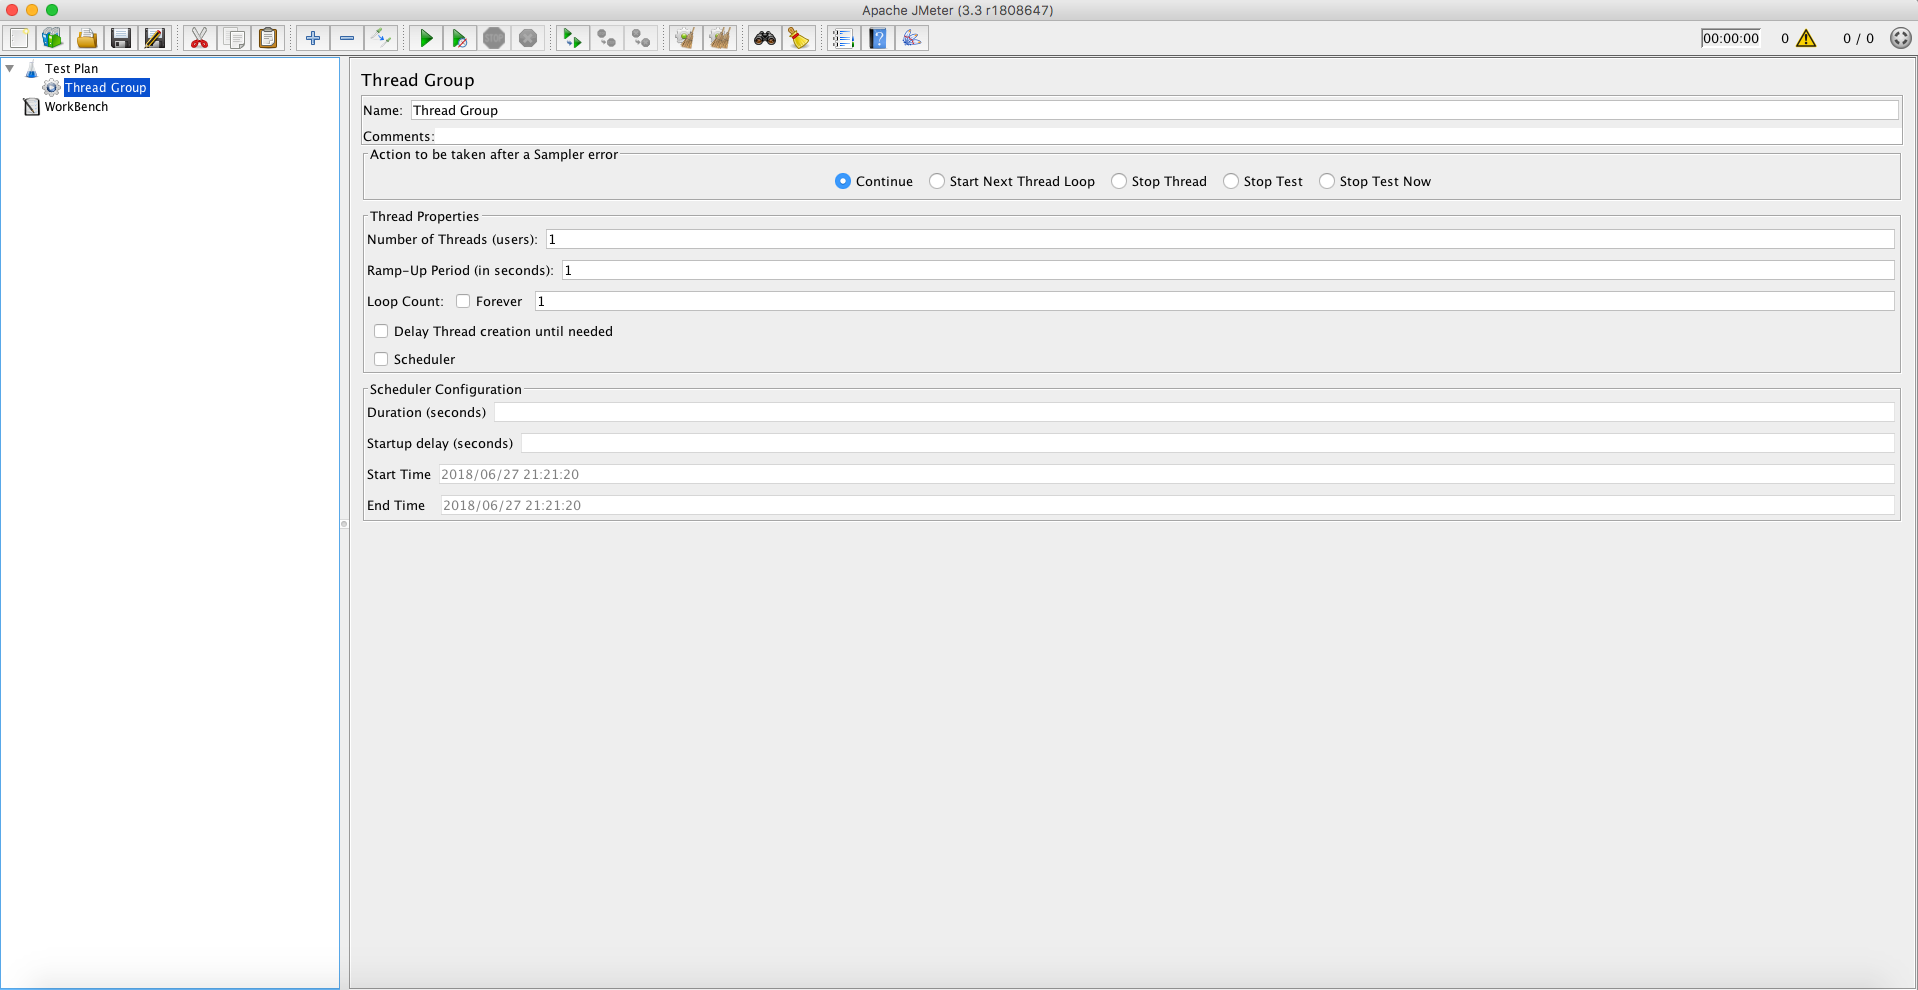
The most important settings here are:
- Number of threads (users): Number of threads that will be started when this test is started. What exactly these threads will do will be defined later on.
- Ramp-Up Period (in seconds): The number of seconds before all threads are started. JMeter will try to spread the start of the thread evenly within the ramp-up period. So if Ramp-Up is set to 1 second and Number of threads is 5, JMeter will start a thread every 0.2 seconds.
- Loop count: How many times you want the threads to repeat whatever it is you want it to do. I usually leave this set to 1 and just put loops later on in the chain.
By default, the thread group is set with 1 thread, 1-second ramp up and 1 loop count. Let’s leave that like that for now.
HTTP Request Sampler
Now right click on the thread group and create an HTTP Request sampler:
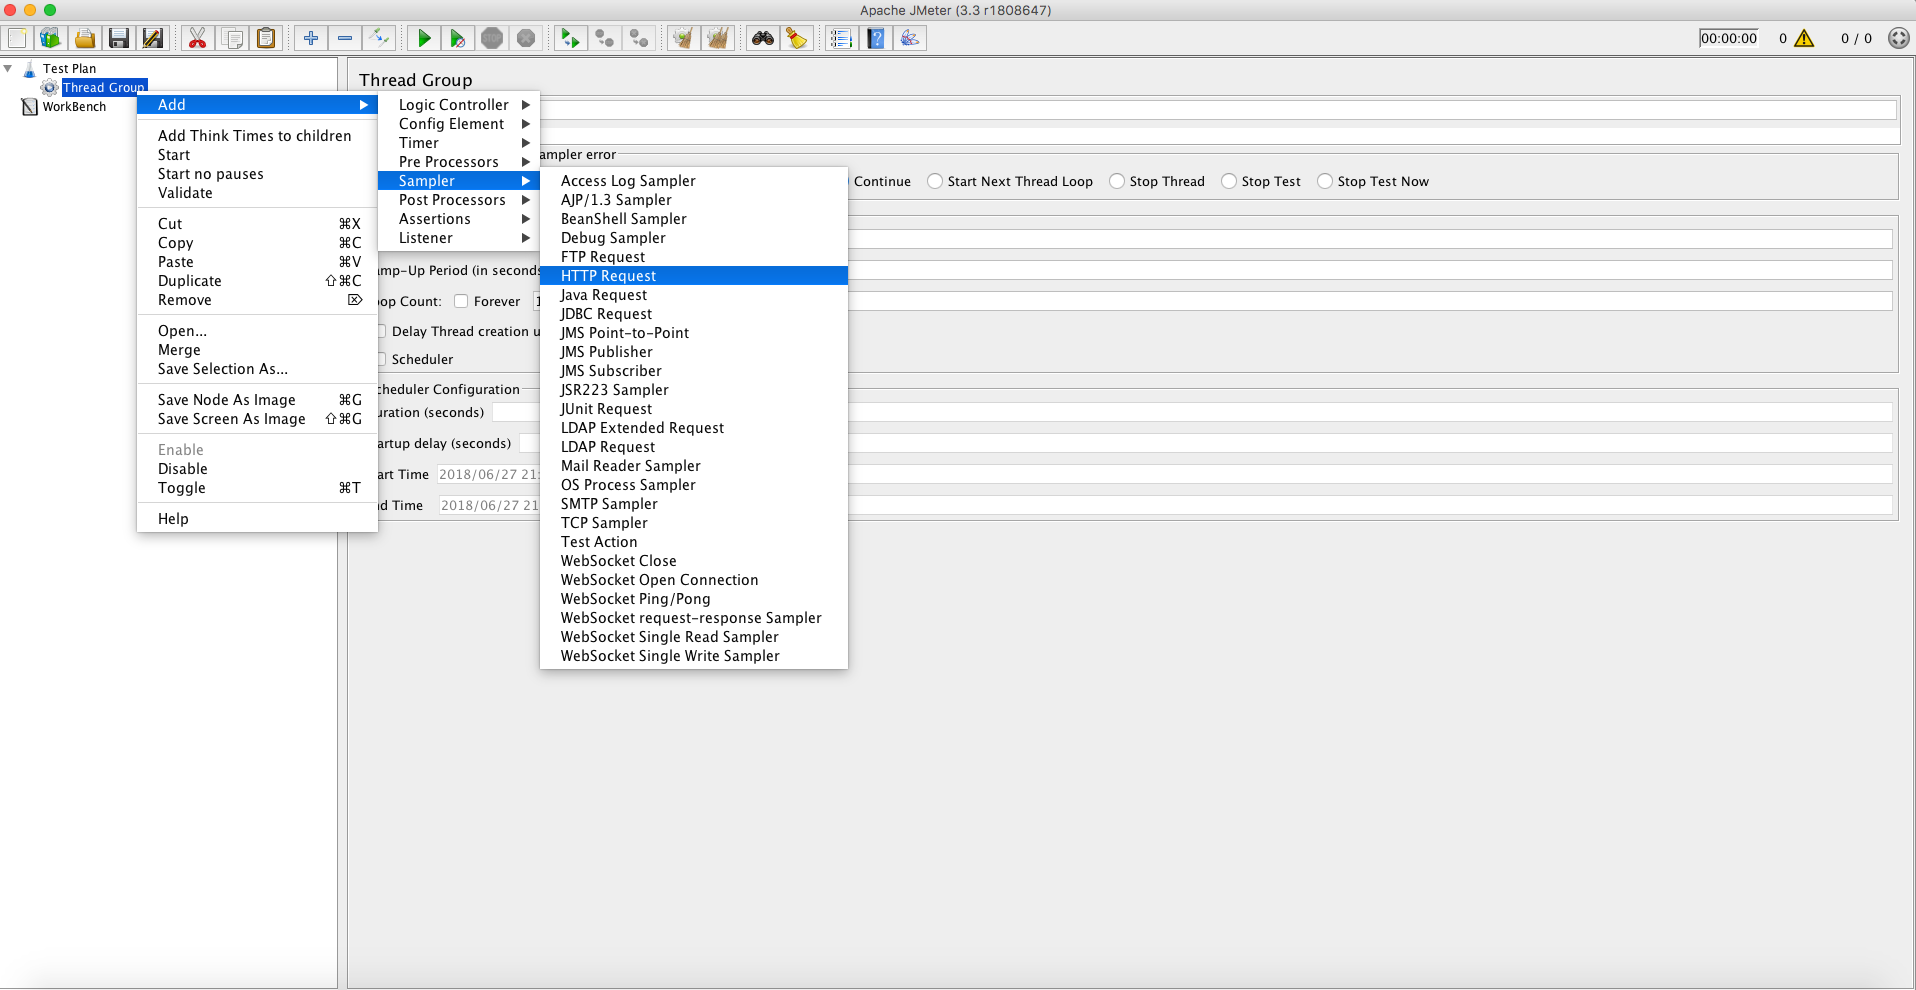

This should (maybe) look familiar! It kind of looks like every REST client ever, such as Postman.
There’s a button labeled “advanced”. I never clicked it, neither should you (yet).
Fill in the following:
- Protocol [http]: http ---- Can also be https if you have a certificate installed.
- Server name or IP: localhost ---- It can also be a remote IP or your server name if you have one registered.
- Port number: 8151 ---- Or any port your application is listening to.
- Method: GET ---- This can also be any other HTTP method. If you select POST, you can also add the POST body.
- Path: <<path to an endpoint you want to test>> ---- Example: /alexa/ temperature
- Parameters: Here you can add query parameters for your request, which would usually look like this in your URL /alexa/temperature?parameterName1=paramterValue1¶meterName2=paramterValue2
- Body data: Where you can add the body data in whatever format you need to send your POST body data. Since we are going to test a GET endpoint, leave this empty for now.
When you’re done, it should look like this:
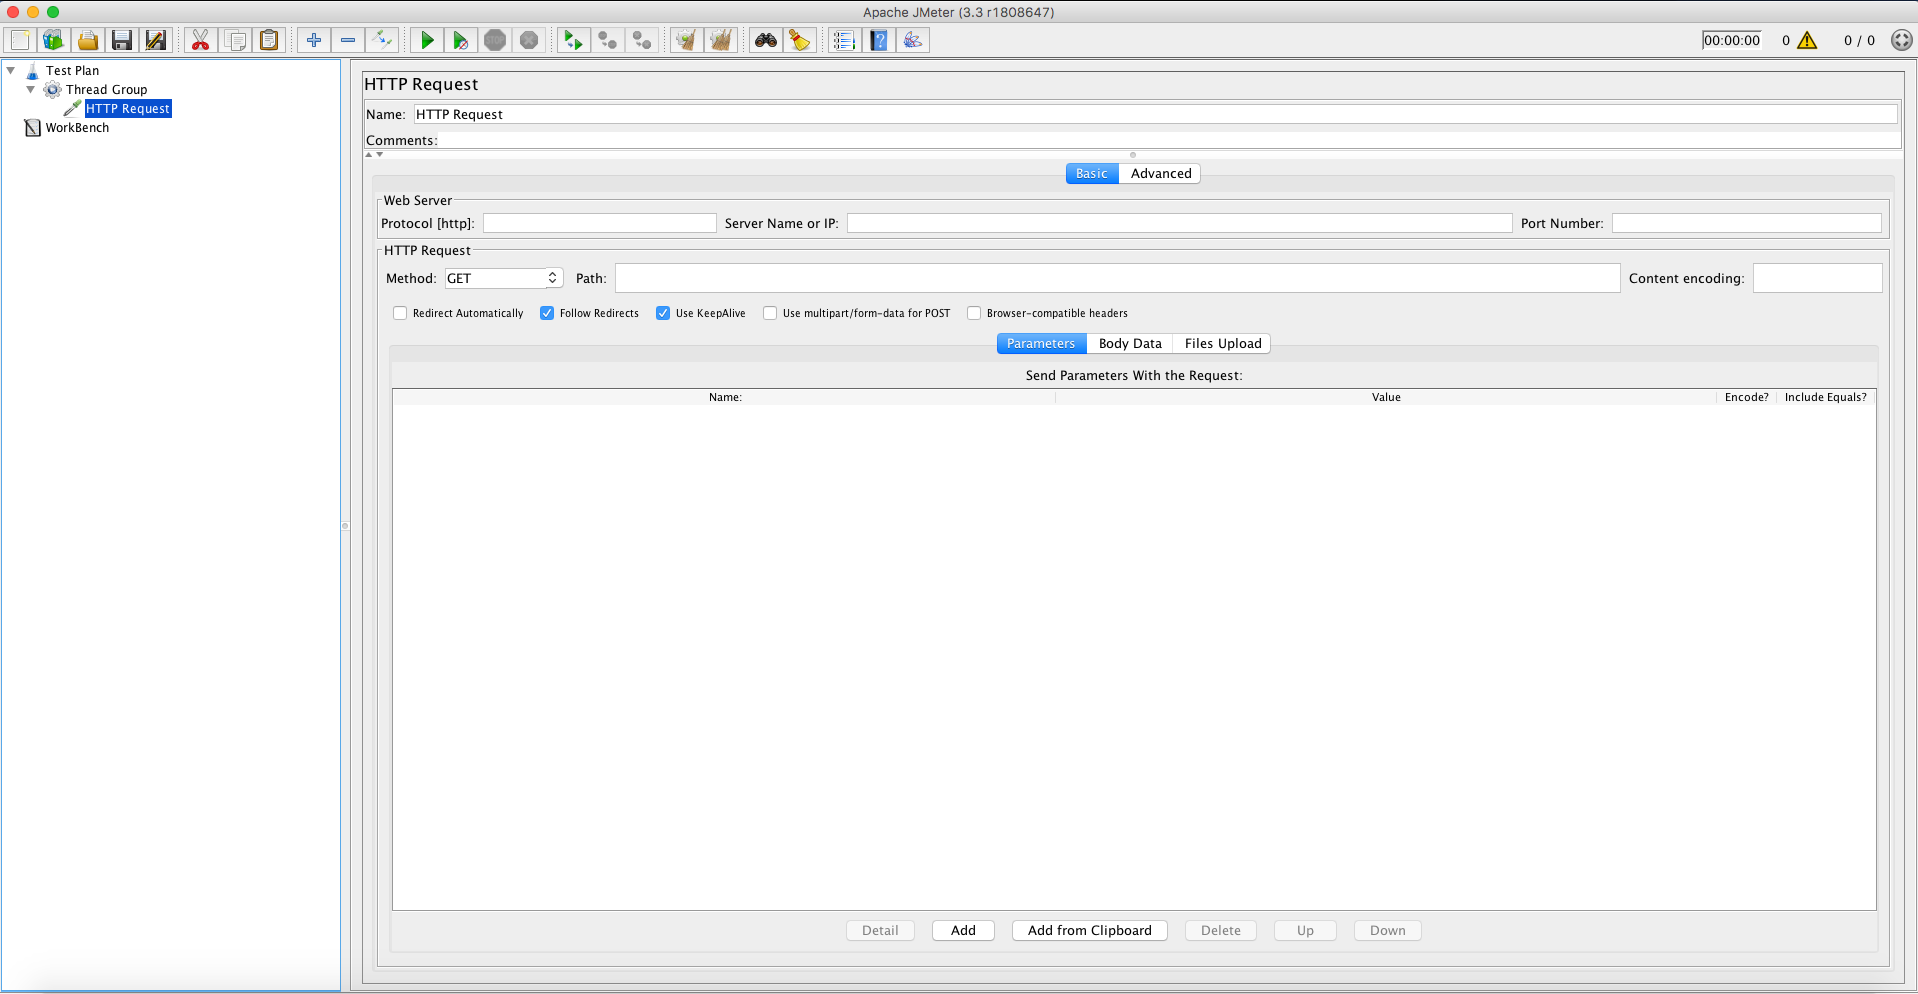
You could just press the play button now and it will perform exactly one GET request to the endpoint specified. However, you won’t get much feedback in JMeter at the moment. Let’s add a few more items to our test plan.
HTTP Header Manager
You might want to add some headers to your HTTP request. To do so, right-click on the HTTP Request sampler and select HTTP Header Manager:
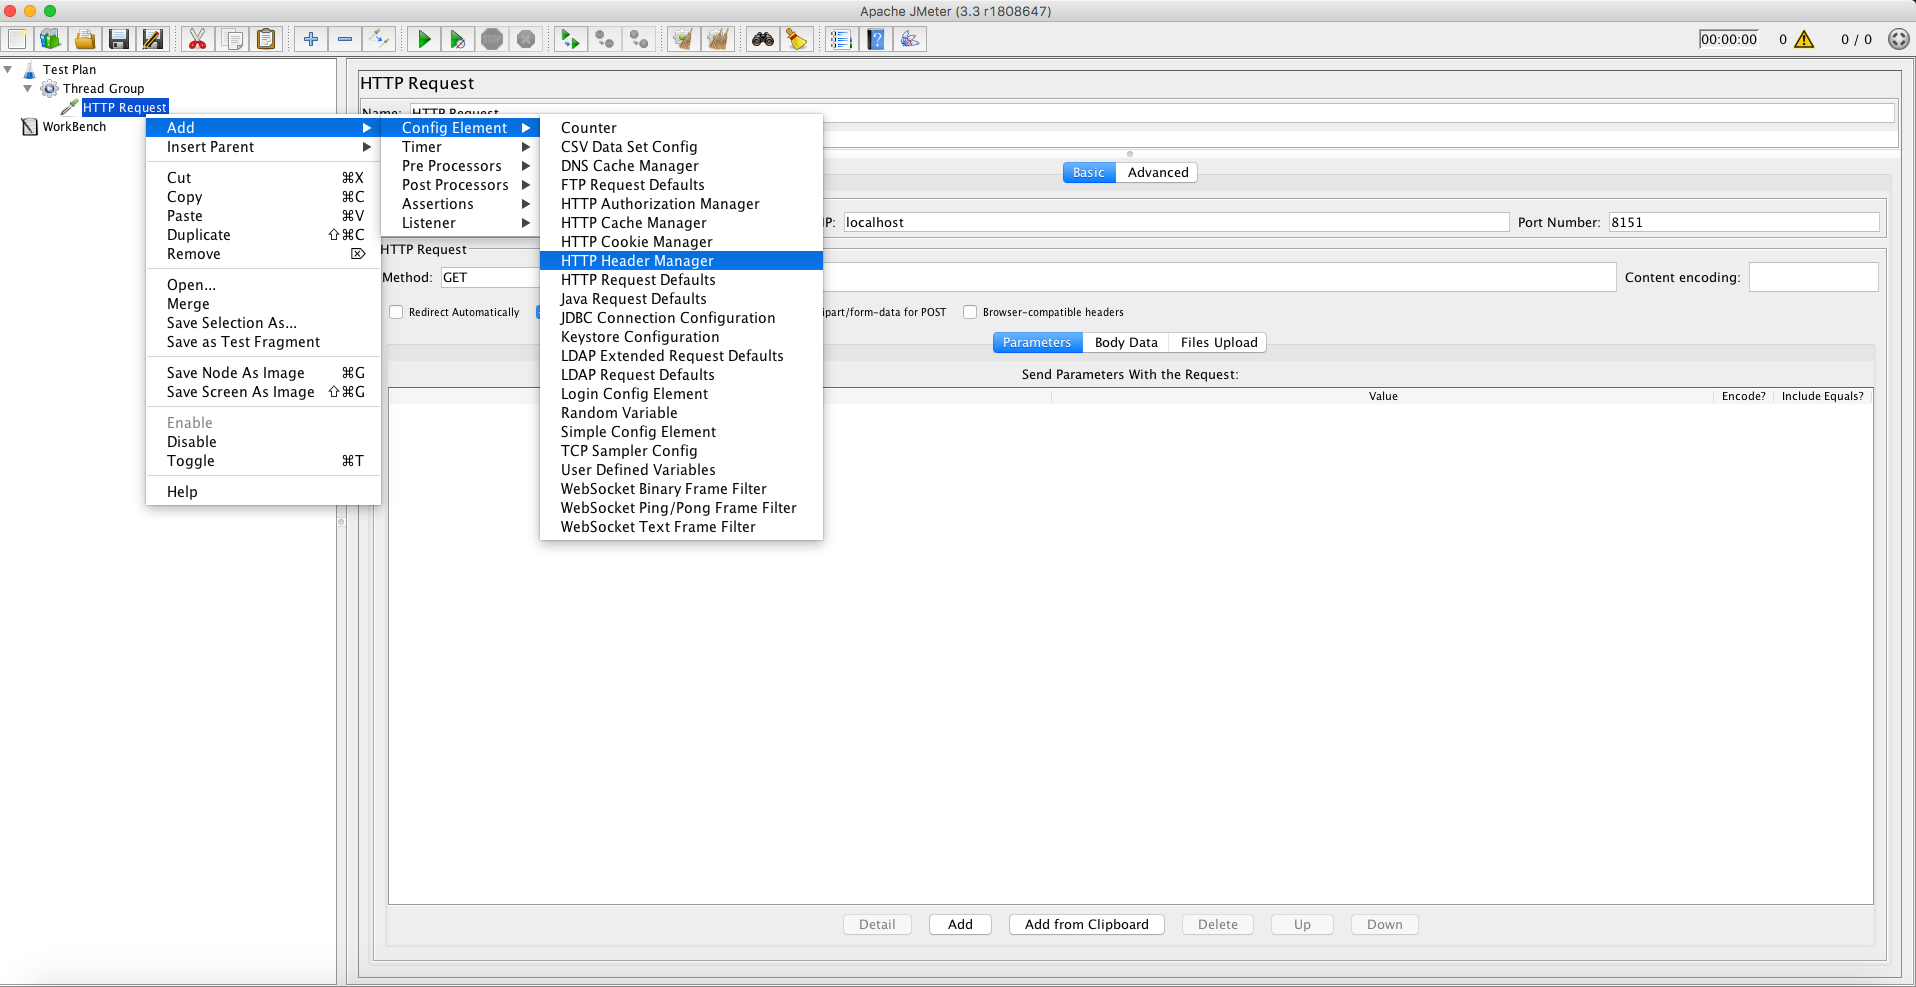
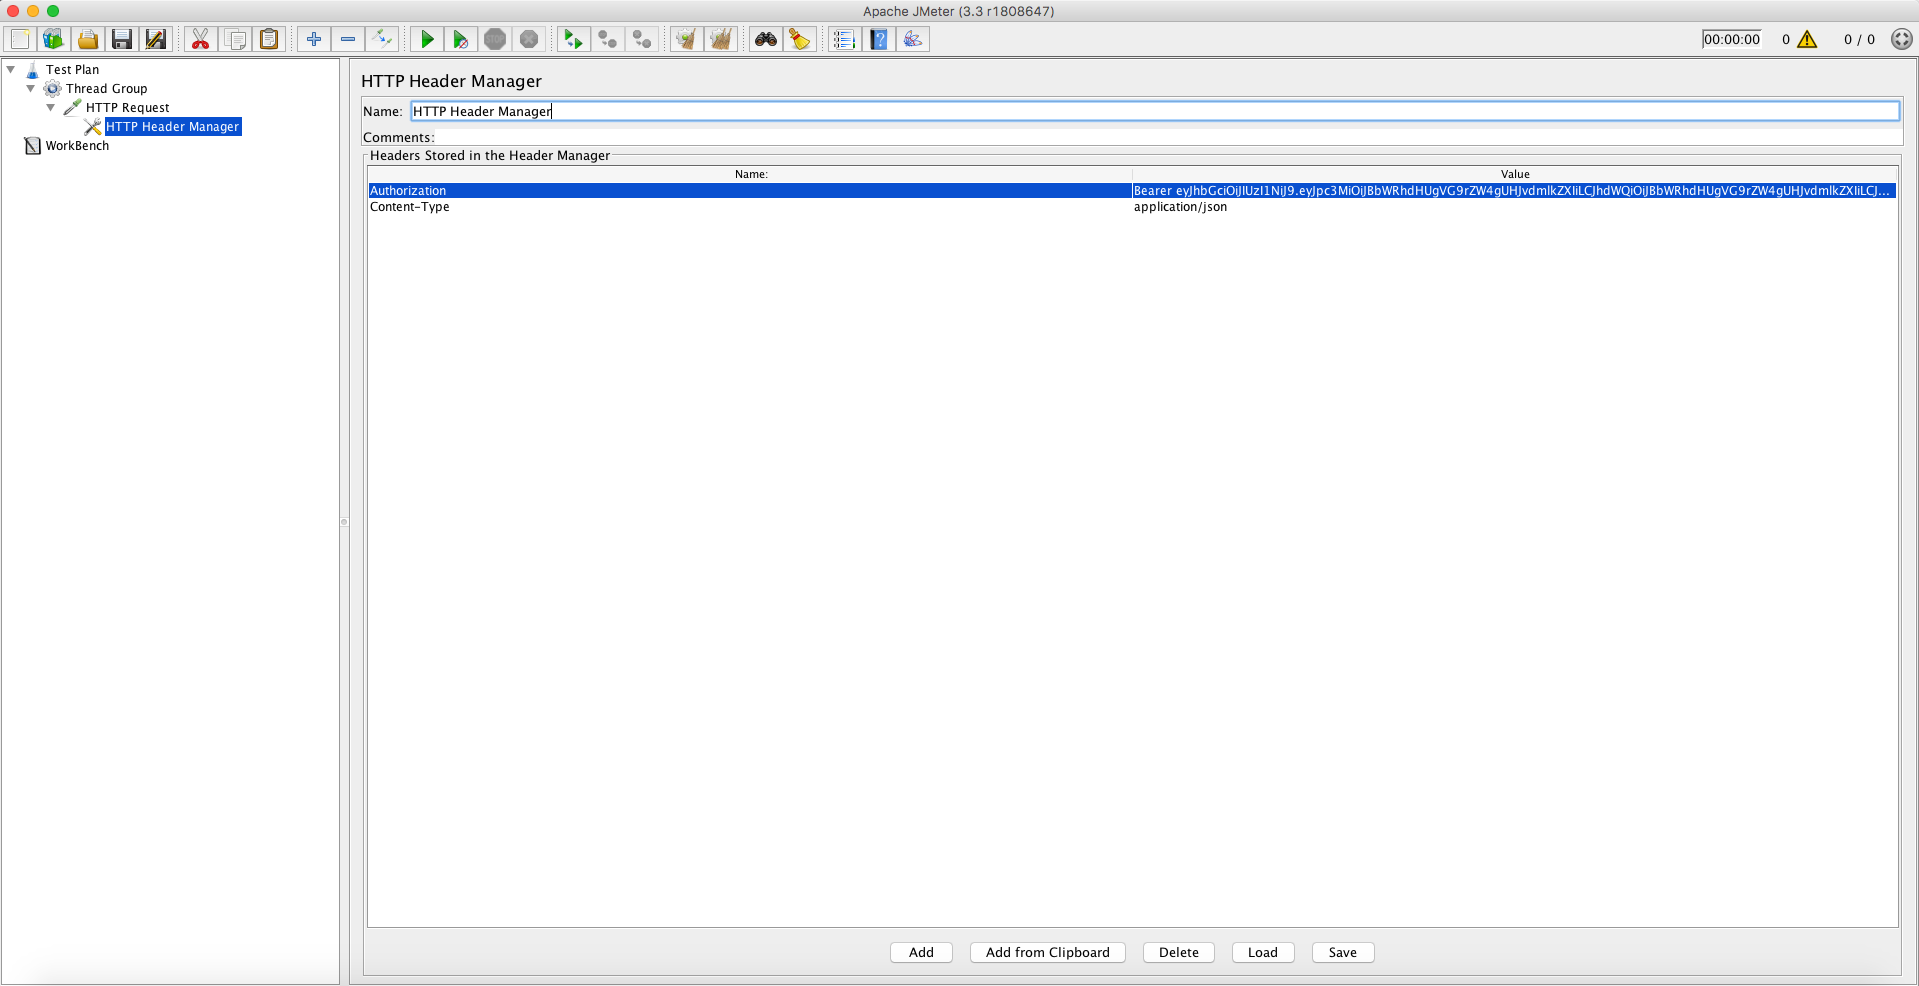
Here you can add your HTTP headers. Some examples are “Authorization” where you might send an authentication token, or the “Content-Type” header when sending POST body data:
View Results
We’re almost there! When running your JMeter script, you probably want to see the result of each action request. Right click on the Test Plan > Add > Listeners and add the following two items:
- View results in Tree
- View results in Table
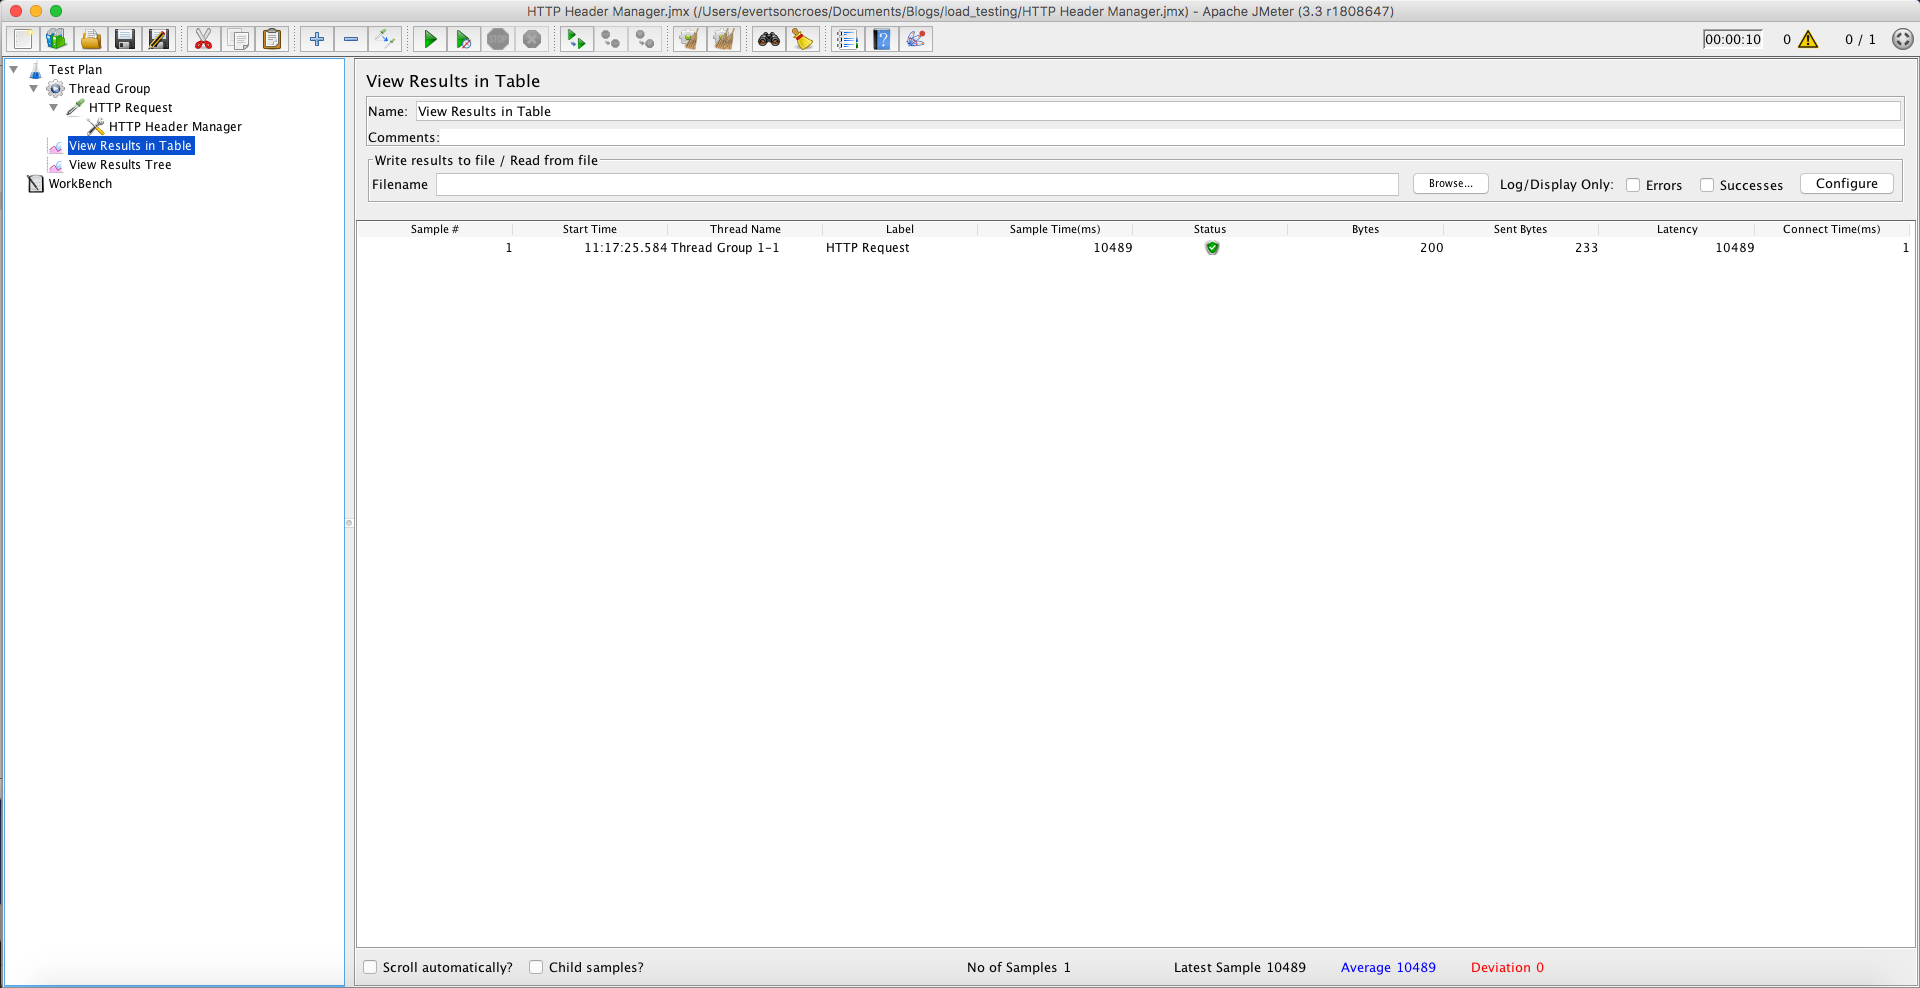
After running the script by pressing on the green play button, this is how these two views will display the results:
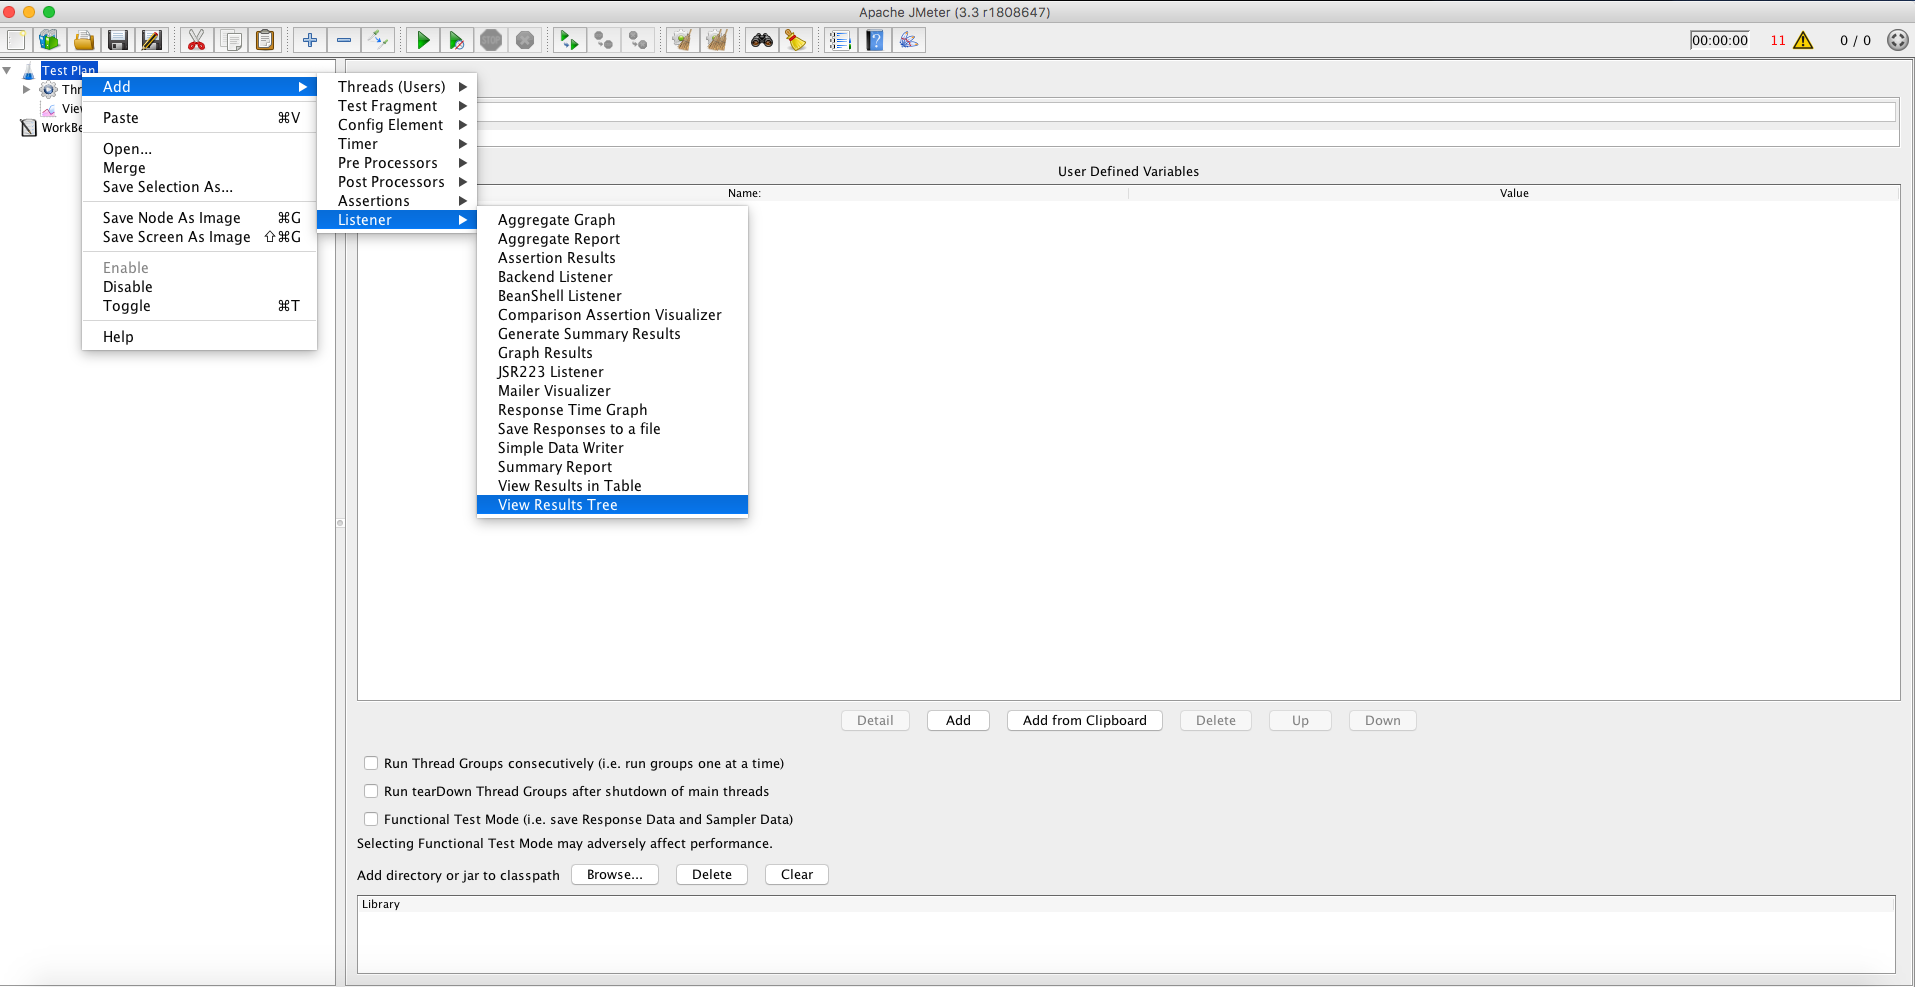
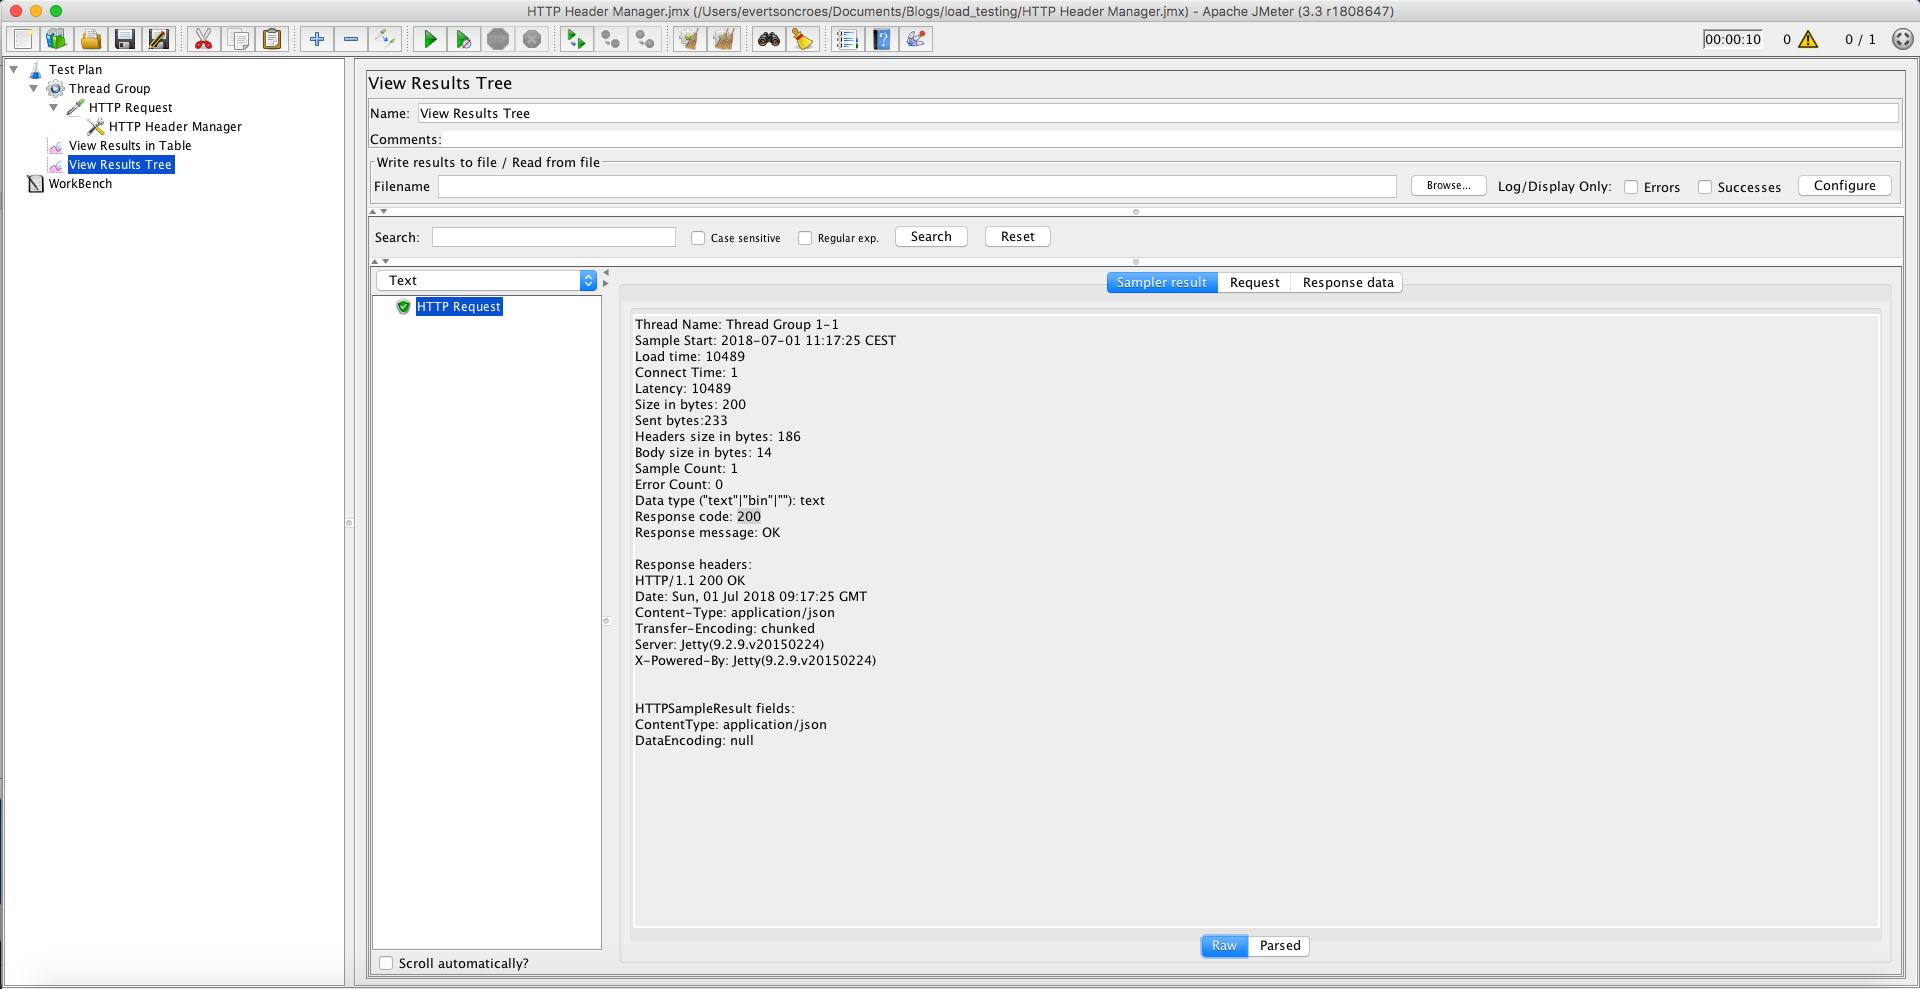
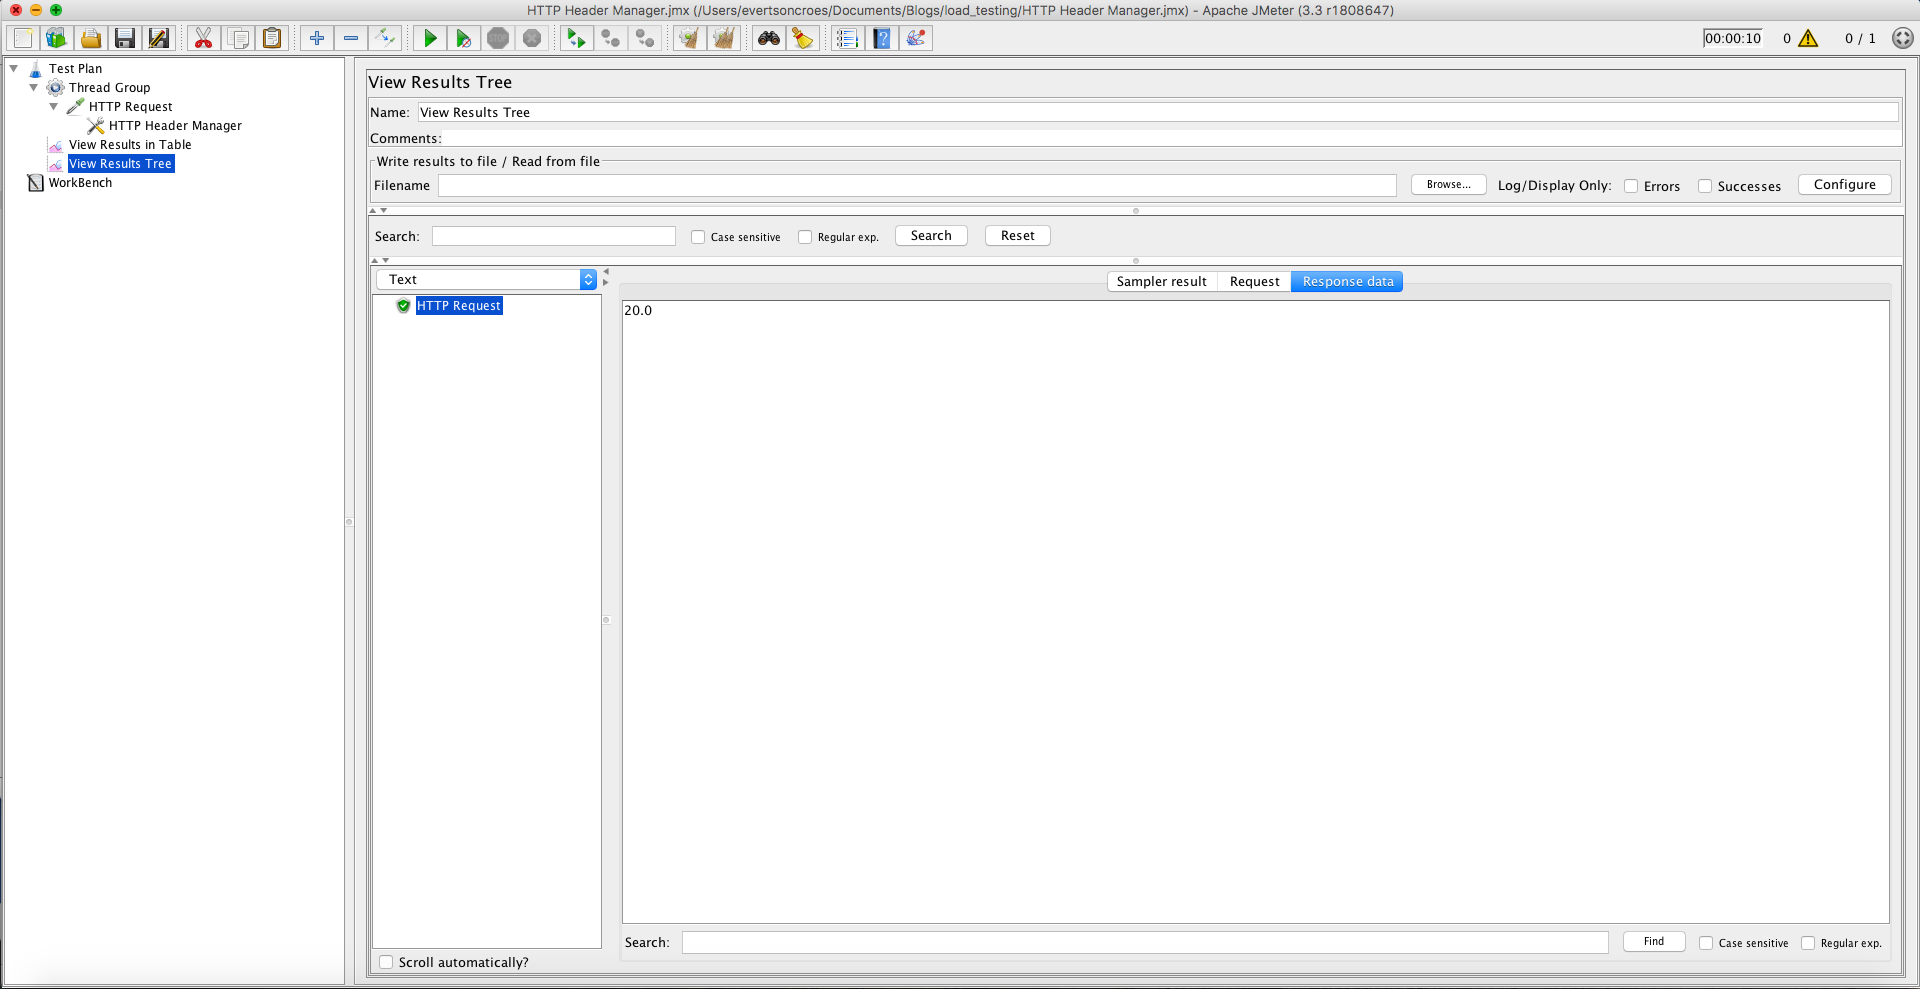
Here we can immediately see that the request was successful due to the green icon next to it in the tree. The sampler results give us a lot of extra info, including the status code. We can also check the request we sent and the response data we get back by clicking on those tabs. Here we can see that the response data is 20.0, which is what I programmed my mock object to return:
The table view looks like this:
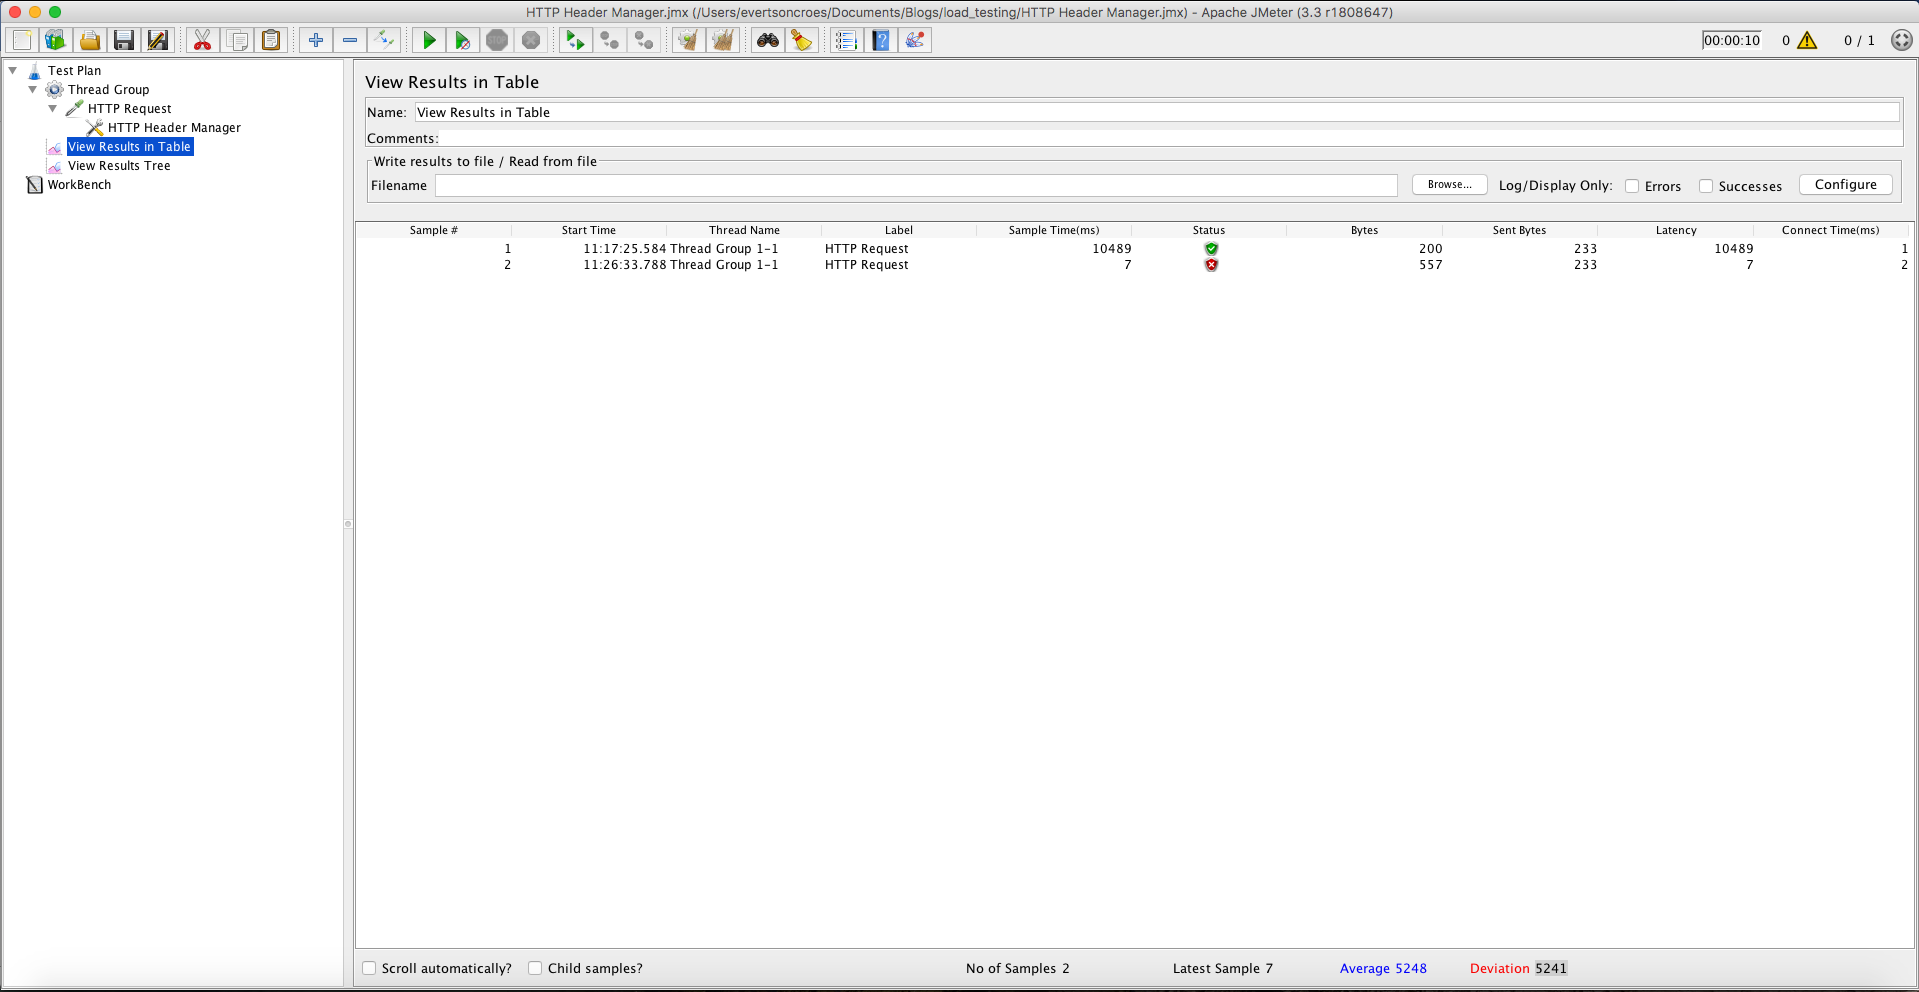
And if I run a request I know will fail, by sending an invalid token for example, then the table looks like this:
If you want to clear all your results, click on the button at the top with the cog and two brooms (clear all).
User-Defined variables
We’ve just added a lot of configuration in JMeter, however, it is also possible to add a list of variables that you define yourself and use them throughout JMeter. This is needed for later on when we want to run JMeter as a script and not from the GUI. To do this, right-click on the Test plan > Add > Config Element and select User-defined variables.
Let’s say I add the following variables that we previously entered into JMeter:

Now that I have these four variables set up, I can refer to them in the following way:
$(parameterName)
This means that if I want to reference the “numberOfThreads” variable, I will add $(numberOfThreads) and it will use “1” in this case. With these variables, our Thread Group configuration looks like this:
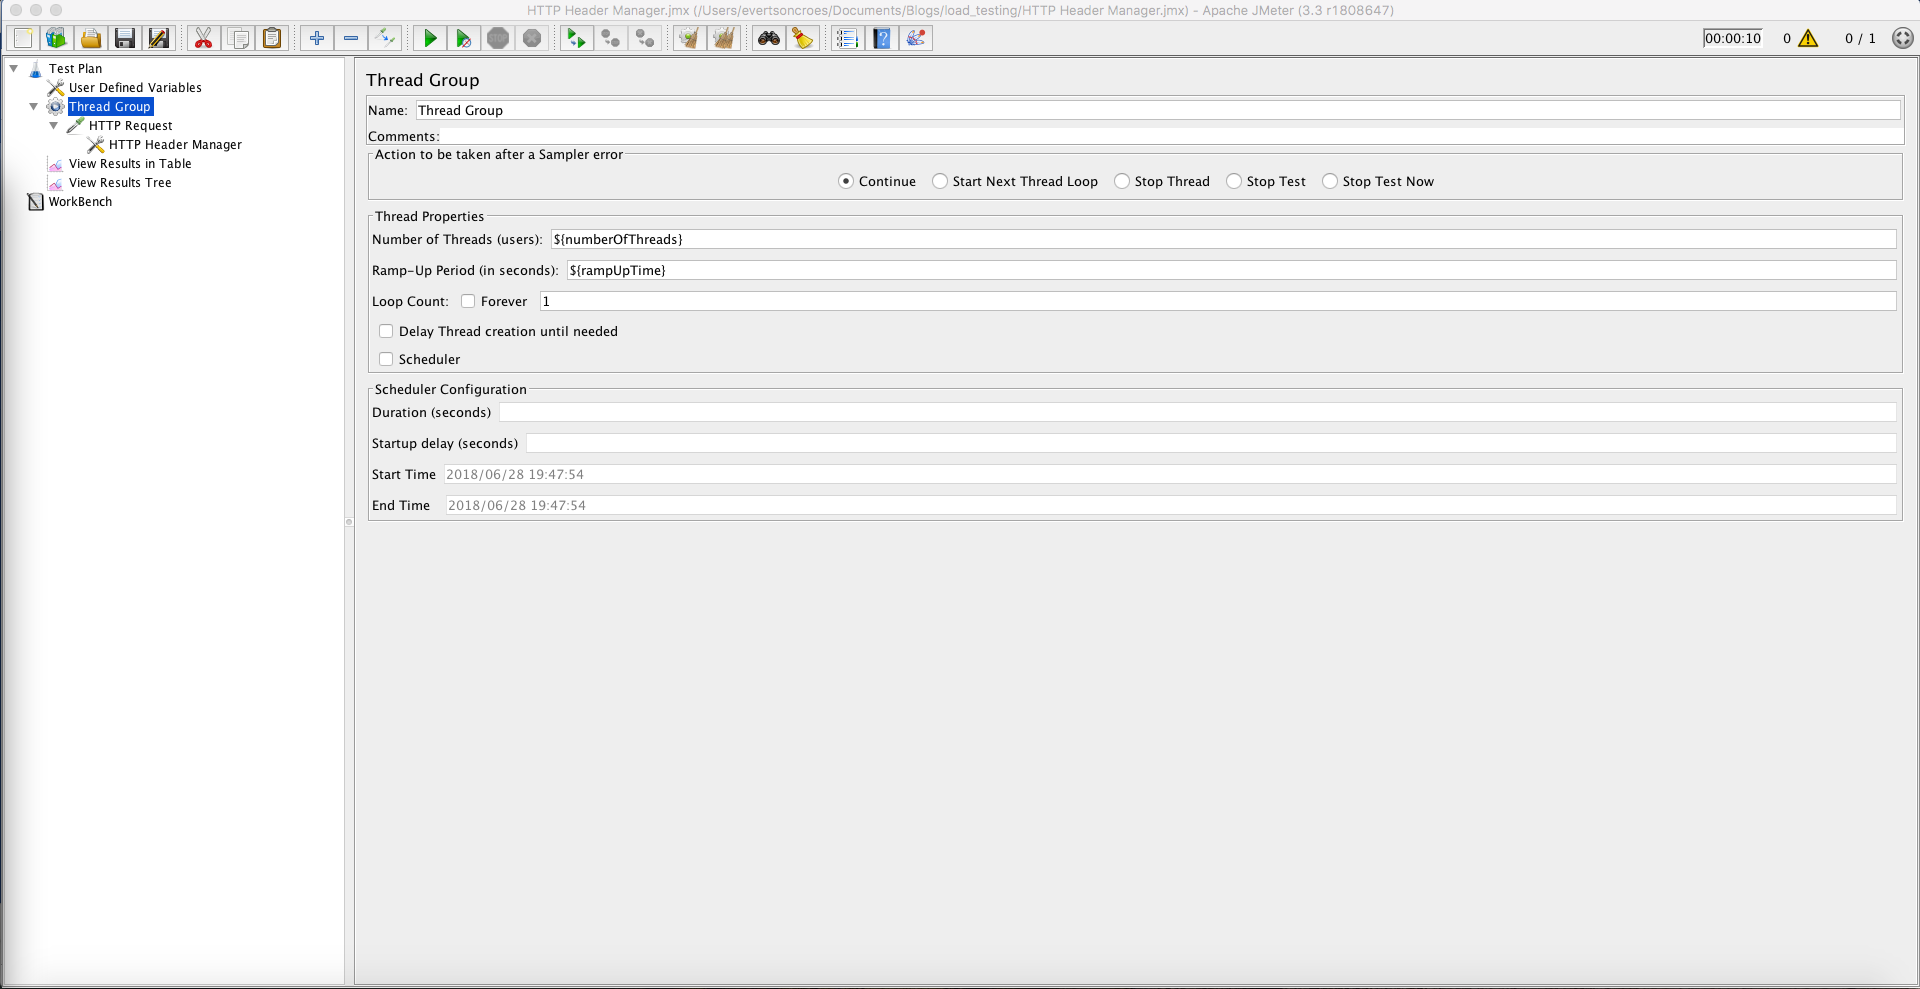
We’ll get back to these variables in a bit.
CSV Data Set Config
Up to this point, we have been running this request with a hardcoded authentication token. However, once we want to start running multiple requests and perform our load test, we might want to send a different authentication token per connection. This is possible by having a .csv file with these tokens and reading them in using the “CSV Data Set Config.”
To add this, right click on the Test plan > Add > Config element and select “CSV Data Set Config.”
Let’s say we have a .csv file that looks like this:
1, <<token1>>
2, <<token2>>
3, <<token3>>
…etc
If we set the CSV Data Set Config up in the following way, we can use the tokens per connection:
- Filename: Relative path to the .csv file (from the .jmx script)
- File-encoding: UTF-8 ---- I’m not going to explain file encoding.
- Variable Names (comma-delimited): id, token
- Recycle on EOF?: False ---- If set to true, if your numberOfThreads > numberOfTokensInCSVFile, it will startover from the top of the file when it runs out of tokens to use.
- Stop Thread on EOF?: True --- This is because we don’t want to have more threads than the number of tokens we have in our .csv file
What we’ve accomplished with this is that we’ve created two new variables, namely “id” and “token” which is available to use through JMeter. This is similar to the User Defined Variables and can be accessed in the same way ($(token) for example). Our HTTP Header Manager config now looks like this:

Now you should be ready to run multiple connections. Edit the numberOfThreads and rampUpTime in the User Defined Variables and see what happens! It probably won’t work in the first try and it will probably be your fault. Look at the errors in the view results listeners to see what the cause of the problem is.
Run JMeter in Non-GUI Mode
We’ve seen how to set up a JMeter test and run it in the JMeter GUI. However, when you want to perform this at a large scale, you will probably want to run it on a server somewhere in a non-GUI mode as a script.
In order to do this, you need to open your script one more time in JMeter and make a small adjustment. In the User Defined Variables, change the “numberOfThreads” value to:
${__P(numberOfThreads)}
This means that the value for this variable will be passed on to the script when it is called. You can do this with all your variables, but for now, let’s change this one.
Navigate to the .jmx file location in the command line and run the following:
./apache-jmeter-3.3/bin/jmeter -n \
    -t ./my_script.jmx \
    -j ./ my_script.log \
    -l ./my_script.xml \
    -Jjmeter.save.saveservice.output_format=xml \
    -Jjmeter.save.saveservice.response_data=true \
    -Jjmeter.save.saveservice.samplerData=true \
    -JnumberOfThreads=1 && \
    echo -e "\n\n===== TEST LOGS =====\n\n" && \
    cat my_script.log && \
    echo -e "\n\n===== TEST RESULTS =====\n\n" && \
    my_script.xml
No, I don’t know what the Windows equivalent is of this. An explanation of what just happened:
- ./apache-jmeter-3.3/bin/jmeter: This is the location to my JMeter when running this script. You should set the path to your JMeter.
- -t: The location of the .jmx file.
- -j: The location the log file should be saved
- -l: The location the results .xml file should be saved
- save.saveservice.output_format: The format to save the results in. XML is a good choice because you can load it into the JMeter GUI results to view them.
- JnumberOfThreads: This is the value will be passing which will be mapped to the “numberOfThreads” variables in our script. If you want to pass more values, be sure to add a CAPITAL J before the variable name.
The rest of the command is to just show output immediately to the command line. If you run this in the background, you can always follow the progress in the .log file.
WebSockets
I’ve started this story by explaining why our team looked into load testing. The connected devices use a WebSocket connection to connect to our backend application. In order to test this, we couldn’t use the HTTP Request Sampler. We needed a WebSocket Sampler. JMeter doesn’t come with such a sampler by default, so our colleague Peter Doornbosch decided to make his own JMeter Sampler.
You can find instructions on how to install this sampler into JMeter on the GitHub page for his sampler: https://github.com/ptrd/jmeter-websocket-samplers. Be sure to give it a star!
You can add the samplers in the same way you would add the HTTP Request Sampler. There are multiple WebSocket samplers you can use, however the one we use the most are the “WebSocket Open Connection” and the “WebSocket request-response Sampler”.
The first allows us to open a WebSocket connection with a host. It is very straight-forward, similar to the HTTP request sampler. The “WebSocket request-response Sampler” allows us to send a message via the WebSocket connection created. You can send text or binary. Again, this is very straight-forward.
For any more explanation on this Sampler and how to do more complicated things like Secury WebSockets, see the documentation on GitHub.
There are a lot more things you can do with JMeter, however those will remain out of scope of this blog because it’s my blog and I said so.
Docker

I’m not going to explain what Docker is in this blog. If you don’t know or want a refresher, view this page.
Our Dockerfile looks like this:
# Use a minimal base image with OpenJDK installed
FROM openjdk:8-jre-alpine3.7

# Install packages
RUN apk update && \
    apk add ca-certificates wget python python-dev py-pip && \
    update-ca-certificates && \
    pip install --upgrade --user awscli

# Set variables
ENV JMETER_HOME=/usr/share/apache-jmeter \
    JMETER_VERSION=3.3 \
    WEB_SOCKET_SAMPLER_VERSION=1.2 \
    TEST_SCRIPT_FILE=/var/jmeter/test.jmx \
    TEST_LOG_FILE=/var/jmeter/test.log \
    TEST_RESULTS_FILE=/var/jmeter/test-result.xml \
    USE_CACHED_SSL_CONTEXT=false \
    NUMBER_OF_THREADS=1000 \
    RAMP_UP_TIME=25 \
    CERTIFICATES_FILE=/var/jmeter/certificates.csv \
    KEYSTORE_FILE=/var/jmeter/keystore.jks \
    KEYSTORE_PASSWORD=secret \
    HOST=your.host.com \
    PORT=443 \
    OPEN_CONNECTION_WAIT_TIME=5000 \
    OPEN_CONNECTION_TIMEOUT=20000 \
    OPEN_CONNECTION_READ_TIMEOUT=6000 \
    NUMBER_OF_MESSAGES=8 \
    DATA_TO_SEND=cafebabecafebabe \
    BEFORE_SEND_DATA_WAIT_TIME=5000 \
    SEND_DATA_WAIT_TIME=1000 \
    SEND_DATA_READ_TIMEOUT=6000 \
    CLOSE_CONNECTION_WAIT_TIME=5000 \
    CLOSE_CONNECTION_READ_TIMEOUT=6000 \
    AWS_ACCESS_KEY_ID=EXAMPLE \
    AWS_SECRET_ACCESS_KEY=EXAMPLEKEY \
    AWS_DEFAULT_REGION=eu-central-1 \
    PATH="~/.local/bin:$PATH" \
    JVM_ARGS="-Xms2048m -Xmx4096m -XX:NewSize=1024m -XX:MaxNewSize=2048m -Duser.timezone=UTC"

# Install Apache JMeter
RUN wget http://archive.apache.org/dist/jmeter/binaries/apache-jmeter-${JMETER_VERSION}.tgz && \
    tar zxvf apache-jmeter-${JMETER_VERSION}.tgz && \
    rm -f apache-jmeter-${JMETER_VERSION}.tgz && \
    mv apache-jmeter-${JMETER_VERSION} ${JMETER_HOME}

# Install WebSocket samplers
RUN wget https://bitbucket.org/pjtr/jmeter-websocket-samplers/downloads/JMeterWebSocketSamplers-${WEB_SOCKET_SAMPLER_VERSION}.jar && \
    mv JMeterWebSocketSamplers-${WEB_SOCKET_SAMPLER_VERSION}.jar ${JMETER_HOME}/lib/ext

# Copy test plan
COPY NonGUITests.jmx ${TEST_SCRIPT_FILE}

# Copy keystore and table
COPY certs.jks ${KEYSTORE_FILE}
COPY certs.csv ${CERTIFICATES_FILE}

# Expose port
EXPOSE 443

# The main command, where several things happen:
# - Empty the log and result files
# - Start the JMeter script
# - Echo the log and result files' contents
CMD echo -n > $TEST_LOG_FILE && \
    echo -n > $TEST_RESULTS_FILE && \
    export PATH=~/.local/bin:$PATH && \
    $JMETER_HOME/bin/jmeter -n \
    -t=$TEST_SCRIPT_FILE \
    -j=$TEST_LOG_FILE \
    -l=$TEST_RESULTS_FILE \
    -Djavax.net.ssl.keyStore=$KEYSTORE_FILE \
    -Djavax.net.ssl.keyStorePassword=$KEYSTORE_PASSWORD \
    -Jhttps.use.cached.ssl.context=$USE_CACHED_SSL_CONTEXT \
    -Jjmeter.save.saveservice.output_format=xml \
    -Jjmeter.save.saveservice.response_data=true \
    -Jjmeter.save.saveservice.samplerData=true \
    -JnumberOfThreads=$NUMBER_OF_THREADS \
    -JrampUpTime=$RAMP_UP_TIME \
    -JcertFile=$CERTIFICATES_FILE \
    -Jhost=$HOST \
    -Jport=$PORT \
    -JopenConnectionWaitTime=$OPEN_CONNECTION_WAIT_TIME \
    -JopenConnectionConnectTimeout=$OPEN_CONNECTION_TIMEOUT \
    -JopenConnectionReadTimeout=$OPEN_CONNECTION_READ_TIMEOUT \
    -JnumberOfMessages=$NUMBER_OF_MESSAGES \
    -JdataToSend=$DATA_TO_SEND \
    -JbeforeSendDataWaitTime=$BEFORE_SEND_DATA_WAIT_TIME \
    -JsendDataWaitTime=$SEND_DATA_WAIT_TIME \
    -JsendDataReadTimeout=$SEND_DATA_READ_TIMEOUT \
    -JcloseConnectionWaitTime=$CLOSE_CONNECTION_WAIT_TIME \
    -JcloseConnectionReadTimeout=$CLOSE_CONNECTION_READ_TIMEOUT && \
    aws s3 cp $TEST_LOG_FILE s3://performance-test-logging/uploads/ && \
    aws s3 cp $TEST_RESULTS_FILE s3://performance-test-logging/uploads/ && \
    echo -e "\n\n===== TEST LOGS =====\n\n" && \
    cat $TEST_LOG_FILE && \
    echo -e "\n\n===== TEST RESULTS =====\n\n" && \
    cat $TEST_RESULTS_FILE
This file can be divided into 9 sections:
- Select the base Docker image. In this case it was a minimal base image with OpenJDK installed
- Some bootstrap things to be able to install everything we need later.
- Set the environment variables. These will be referenced later in the Docker file. Worth noting:You should add your Amazon keys in this section, so that the result and log file can be copied to Amazon S3. These keys need to be changed:
- AWS_ACCESS_KEY_ID=<<Your access key ID>>
- AWS_SECRET_ACCESS_KEY=<<Your secret access key>>
- AWS_DEFAULT_REGION=<<Your AWS region>>
These should be available in account settings.
- Install Apache JMeter.
- Install the WebSocket Samplers made by Peter Doornbosch
- Copy the test plan (.jmx) to the location indicated in the environment variable. In this case when we build the Docker image, it is in the same directory as the Docker file.
- Copy some keystore information needed for WSS
- Expose port 443. This statement doesn’t actually do anything. It is just for documentation. (see: https://docs.docker.com/engine/reference/builder/#expose)
- The main command where we run JMeter with all the configurations and values we want to pass. This is similar to the command we used earlier to run JMeter as a script (non-GUI). What we also do here is use the Amazon CLI to copy our JMeter log and result files to Amazon s3 (storage). This will be explained in the next section.
This is it for the Docker part of things. Hopefully, there is enough information in this section for you to set up your own Dockerfile. In the next section, we will see how to build the Docker image and upload it to Amazon and run it there.
Amazon Web Services

Alright, so now you know how to use JMeter to design your test script and how to create a Docker image that sets up an environment needed to run your script. The reason you would want to run these kinds of tests in a Cloud service such as Amazon Web Services (AWS) in the first place is because your Personal Computer has its limits. For a MacBook Pro, for example, we could only simulate around 2100 WebSocket connections before we started getting errors stating that “no more native threads could be created”.
AWS gives us the ability to run Docker containers on Amazon EC2 clusters which will run the tests for us. In order to do this, you will first need to sign up with AWS here: https://portal.aws.amazon.com/billing/signup#/start.
Once you have your account ready, log in to aws.amazon.com and you will hopefully see something like this:
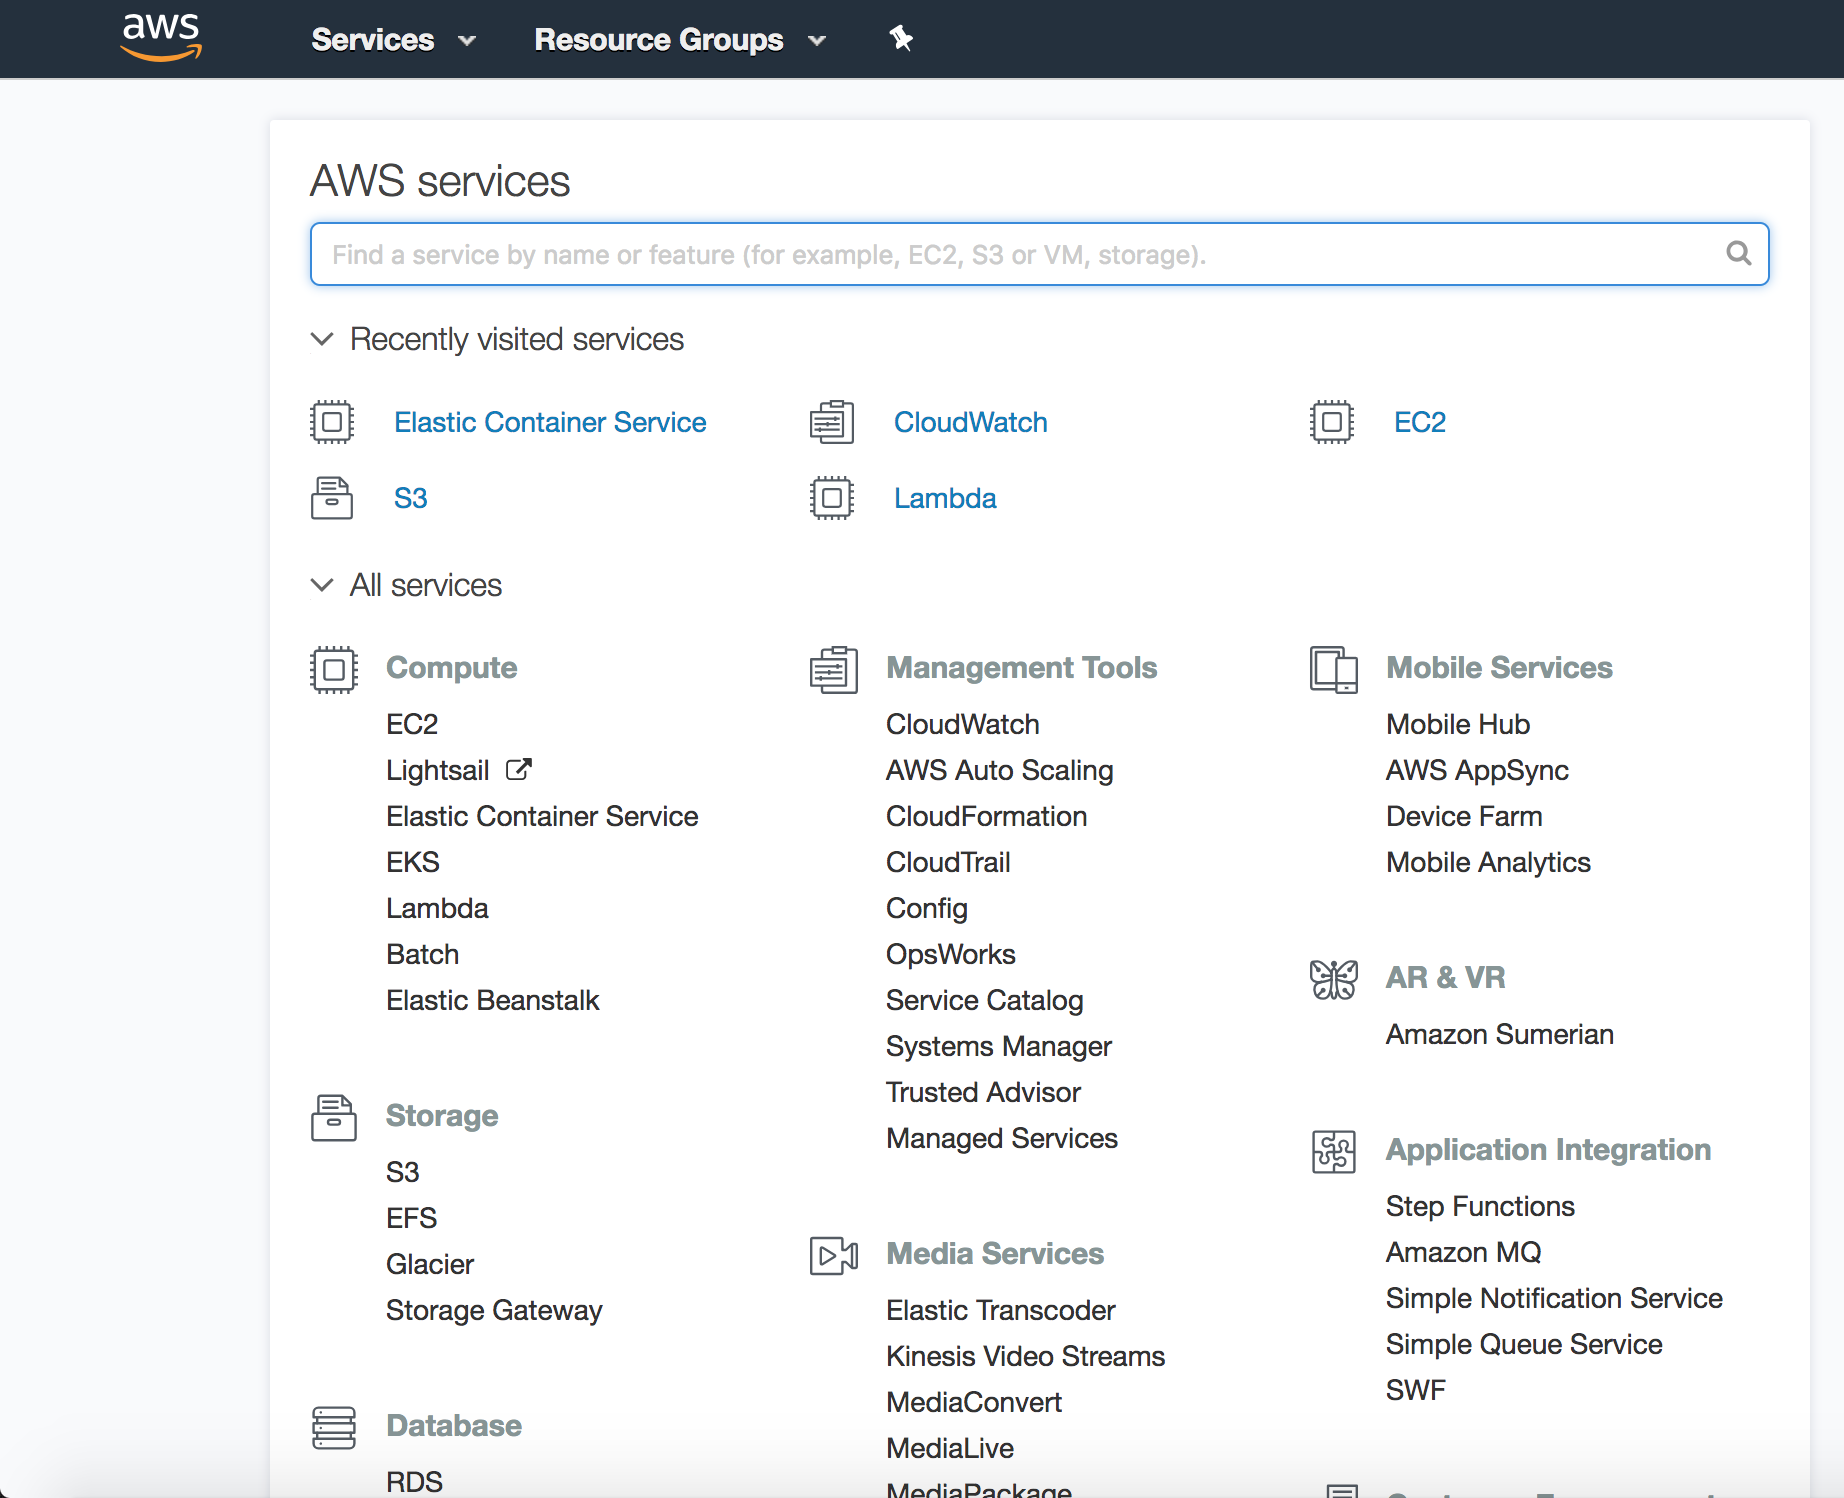
In the search bar, type “Elastic Container Service” and select it. This will be the service we will use to run our Docker container.
Elastic Container Service
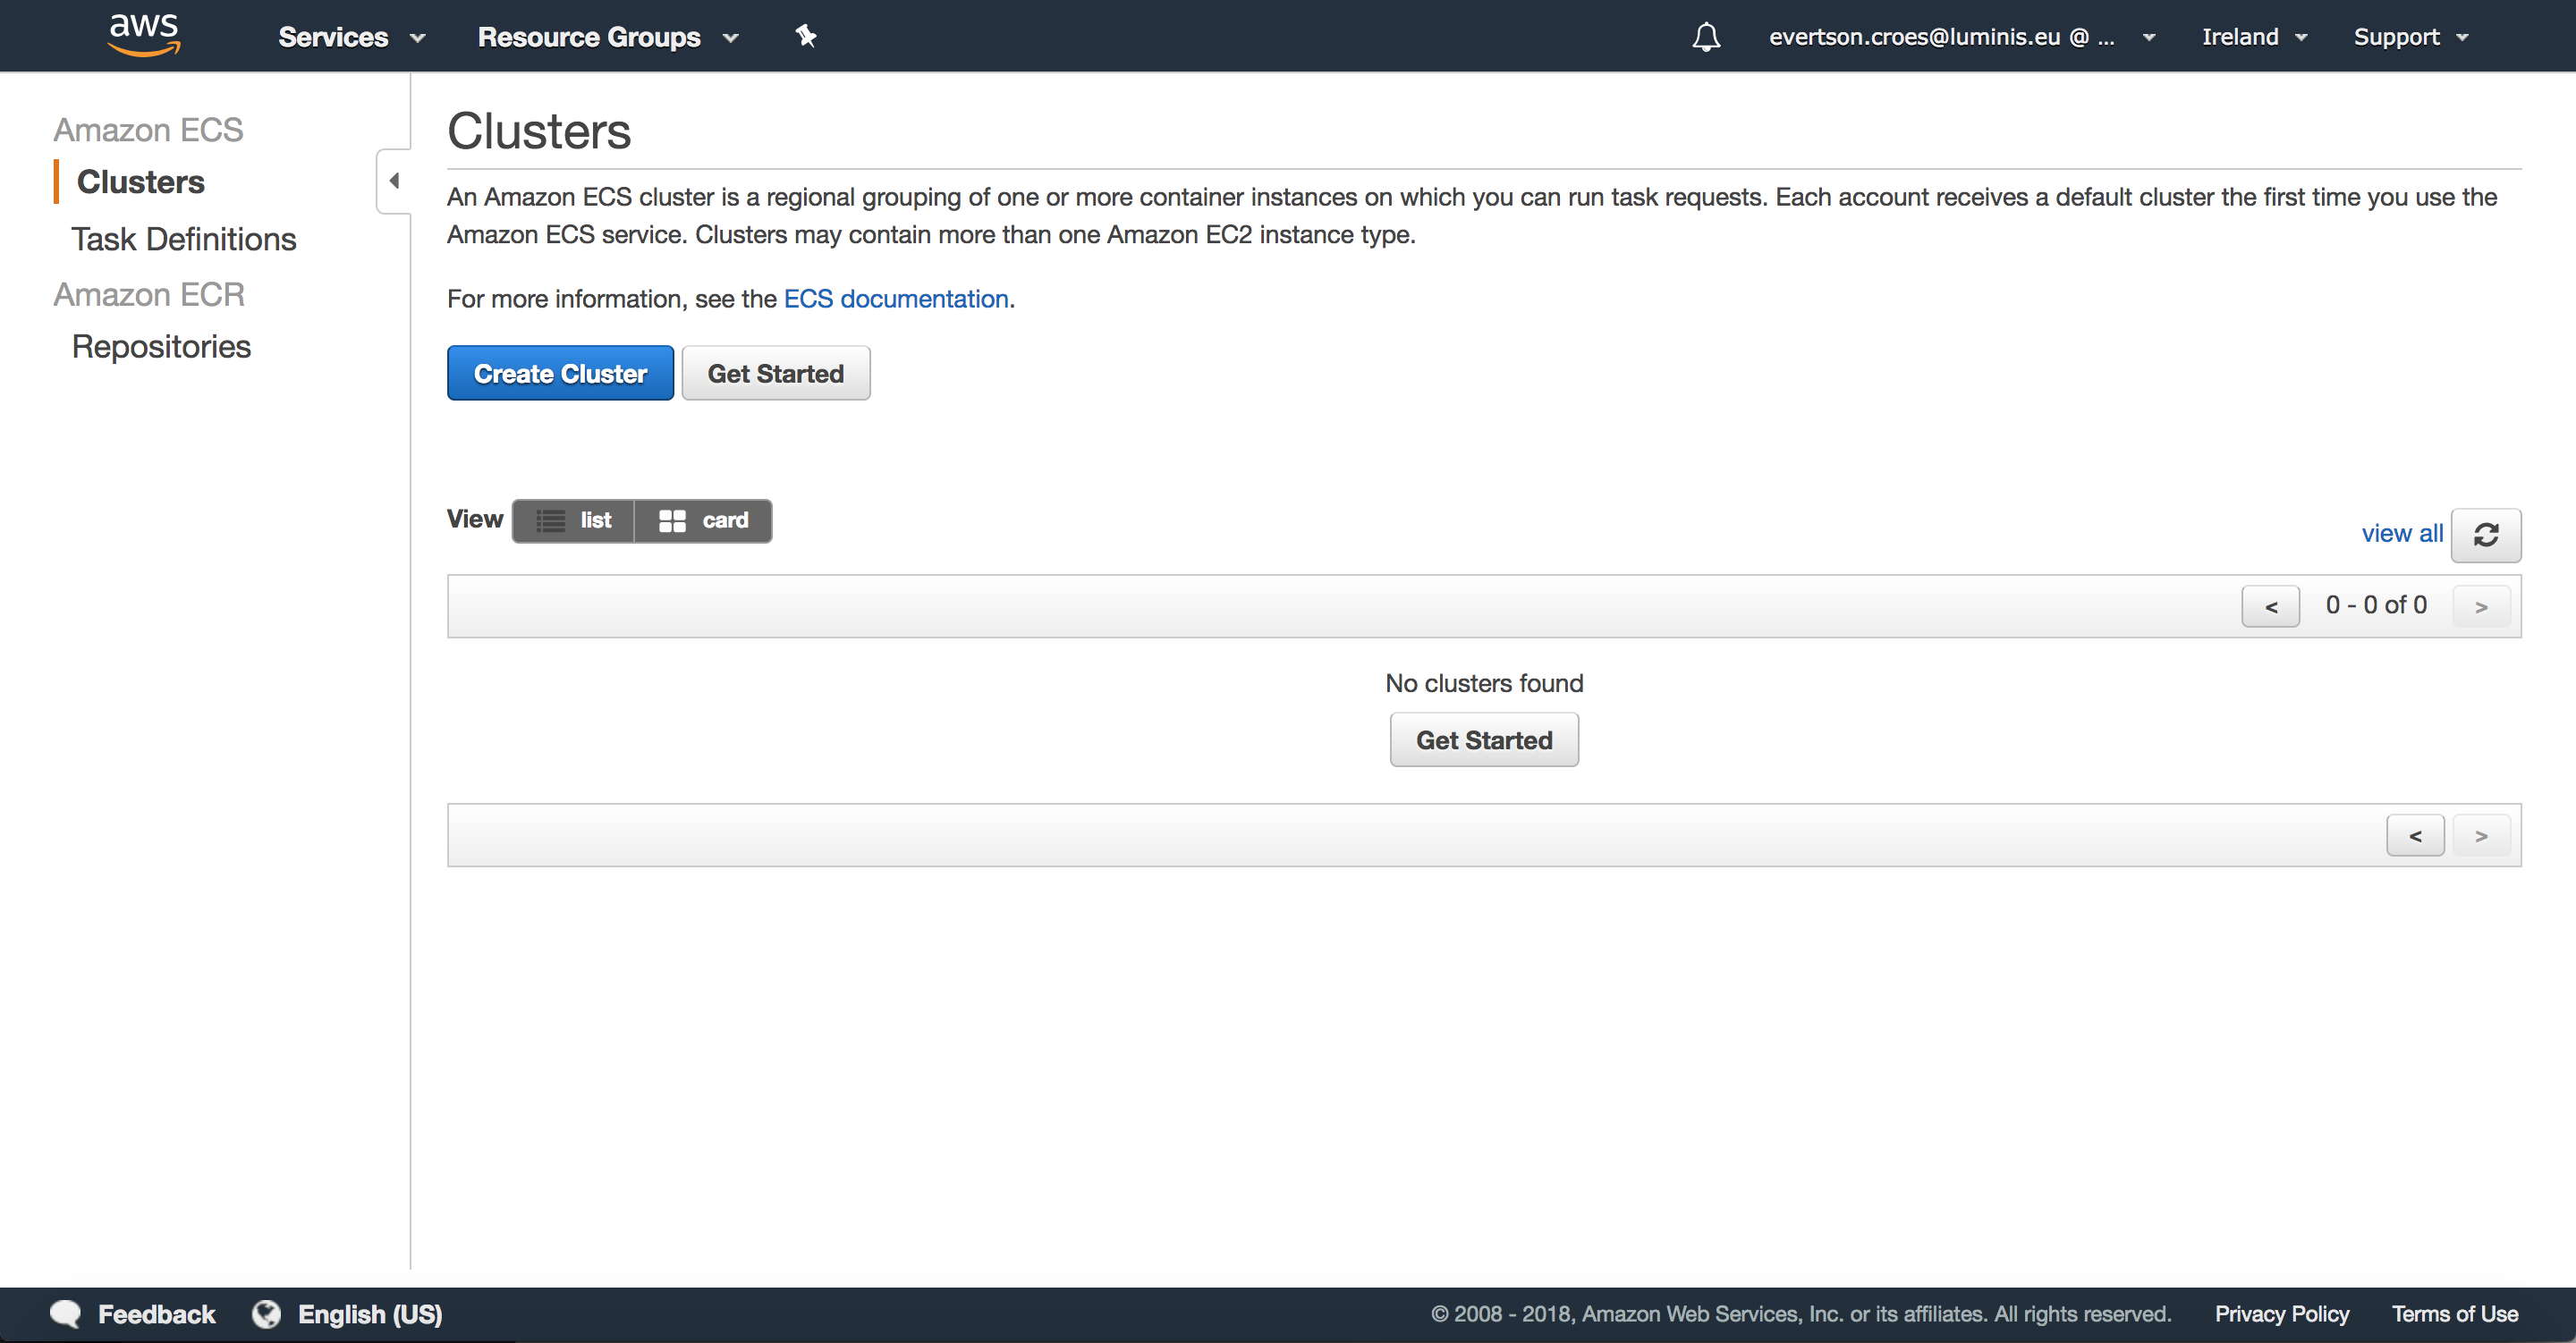
The Elastic Container service is an AWS service that allows us to run our Docker containers in the Cloud. There are three things we are going to discuss regarding the Elastic Container Service:
- Repository: Where we save our Docker images
- Task Definitions: Where we define how to run our Docker containers
- Clusters: Where we start a cluster of VM’s, which will run the Tasks containing the Docker container which contains our JMeter script.
This is what it looks like:
Repositories
Select “Repositories” to get started. As mentioned, this is where we will create a repository to push our Docker image to. Whenever we make a change to our Docker image, we can push to the same repository. Select “Create repository.”
The first thing you have to do is think of a good name for your repository:
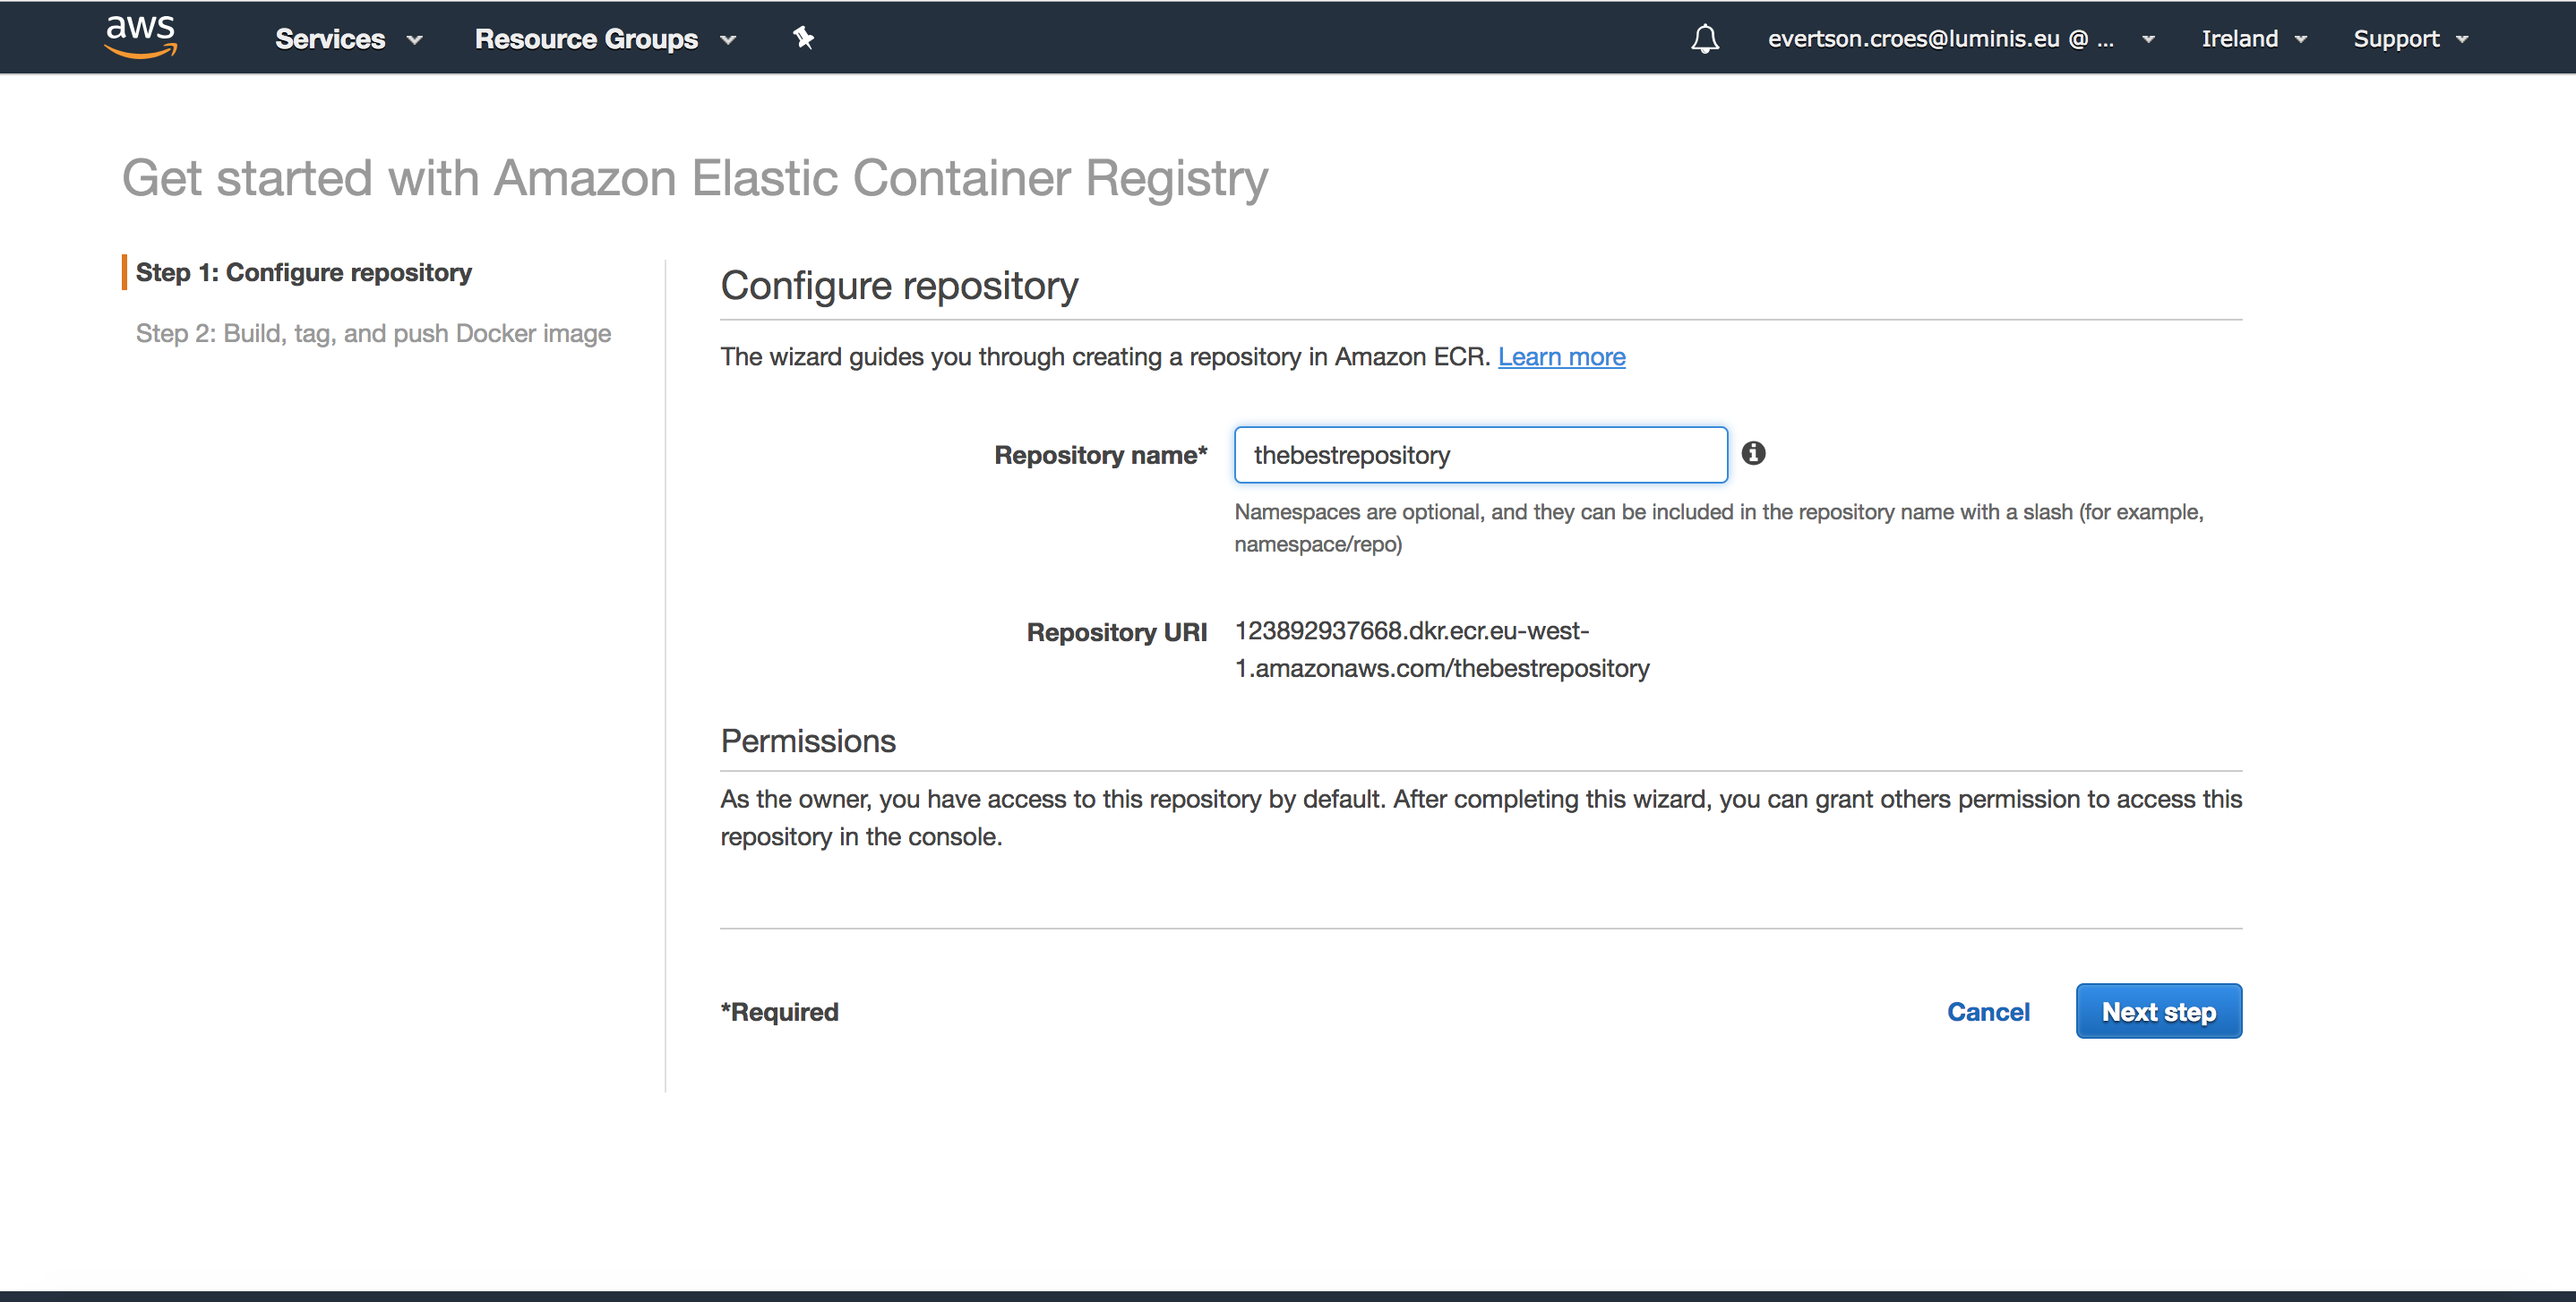
This next page, I personally really like. It is a page which all the Docker commands needed to get your Docker image pushed to this newly created repository. Follow the instructions on this page:
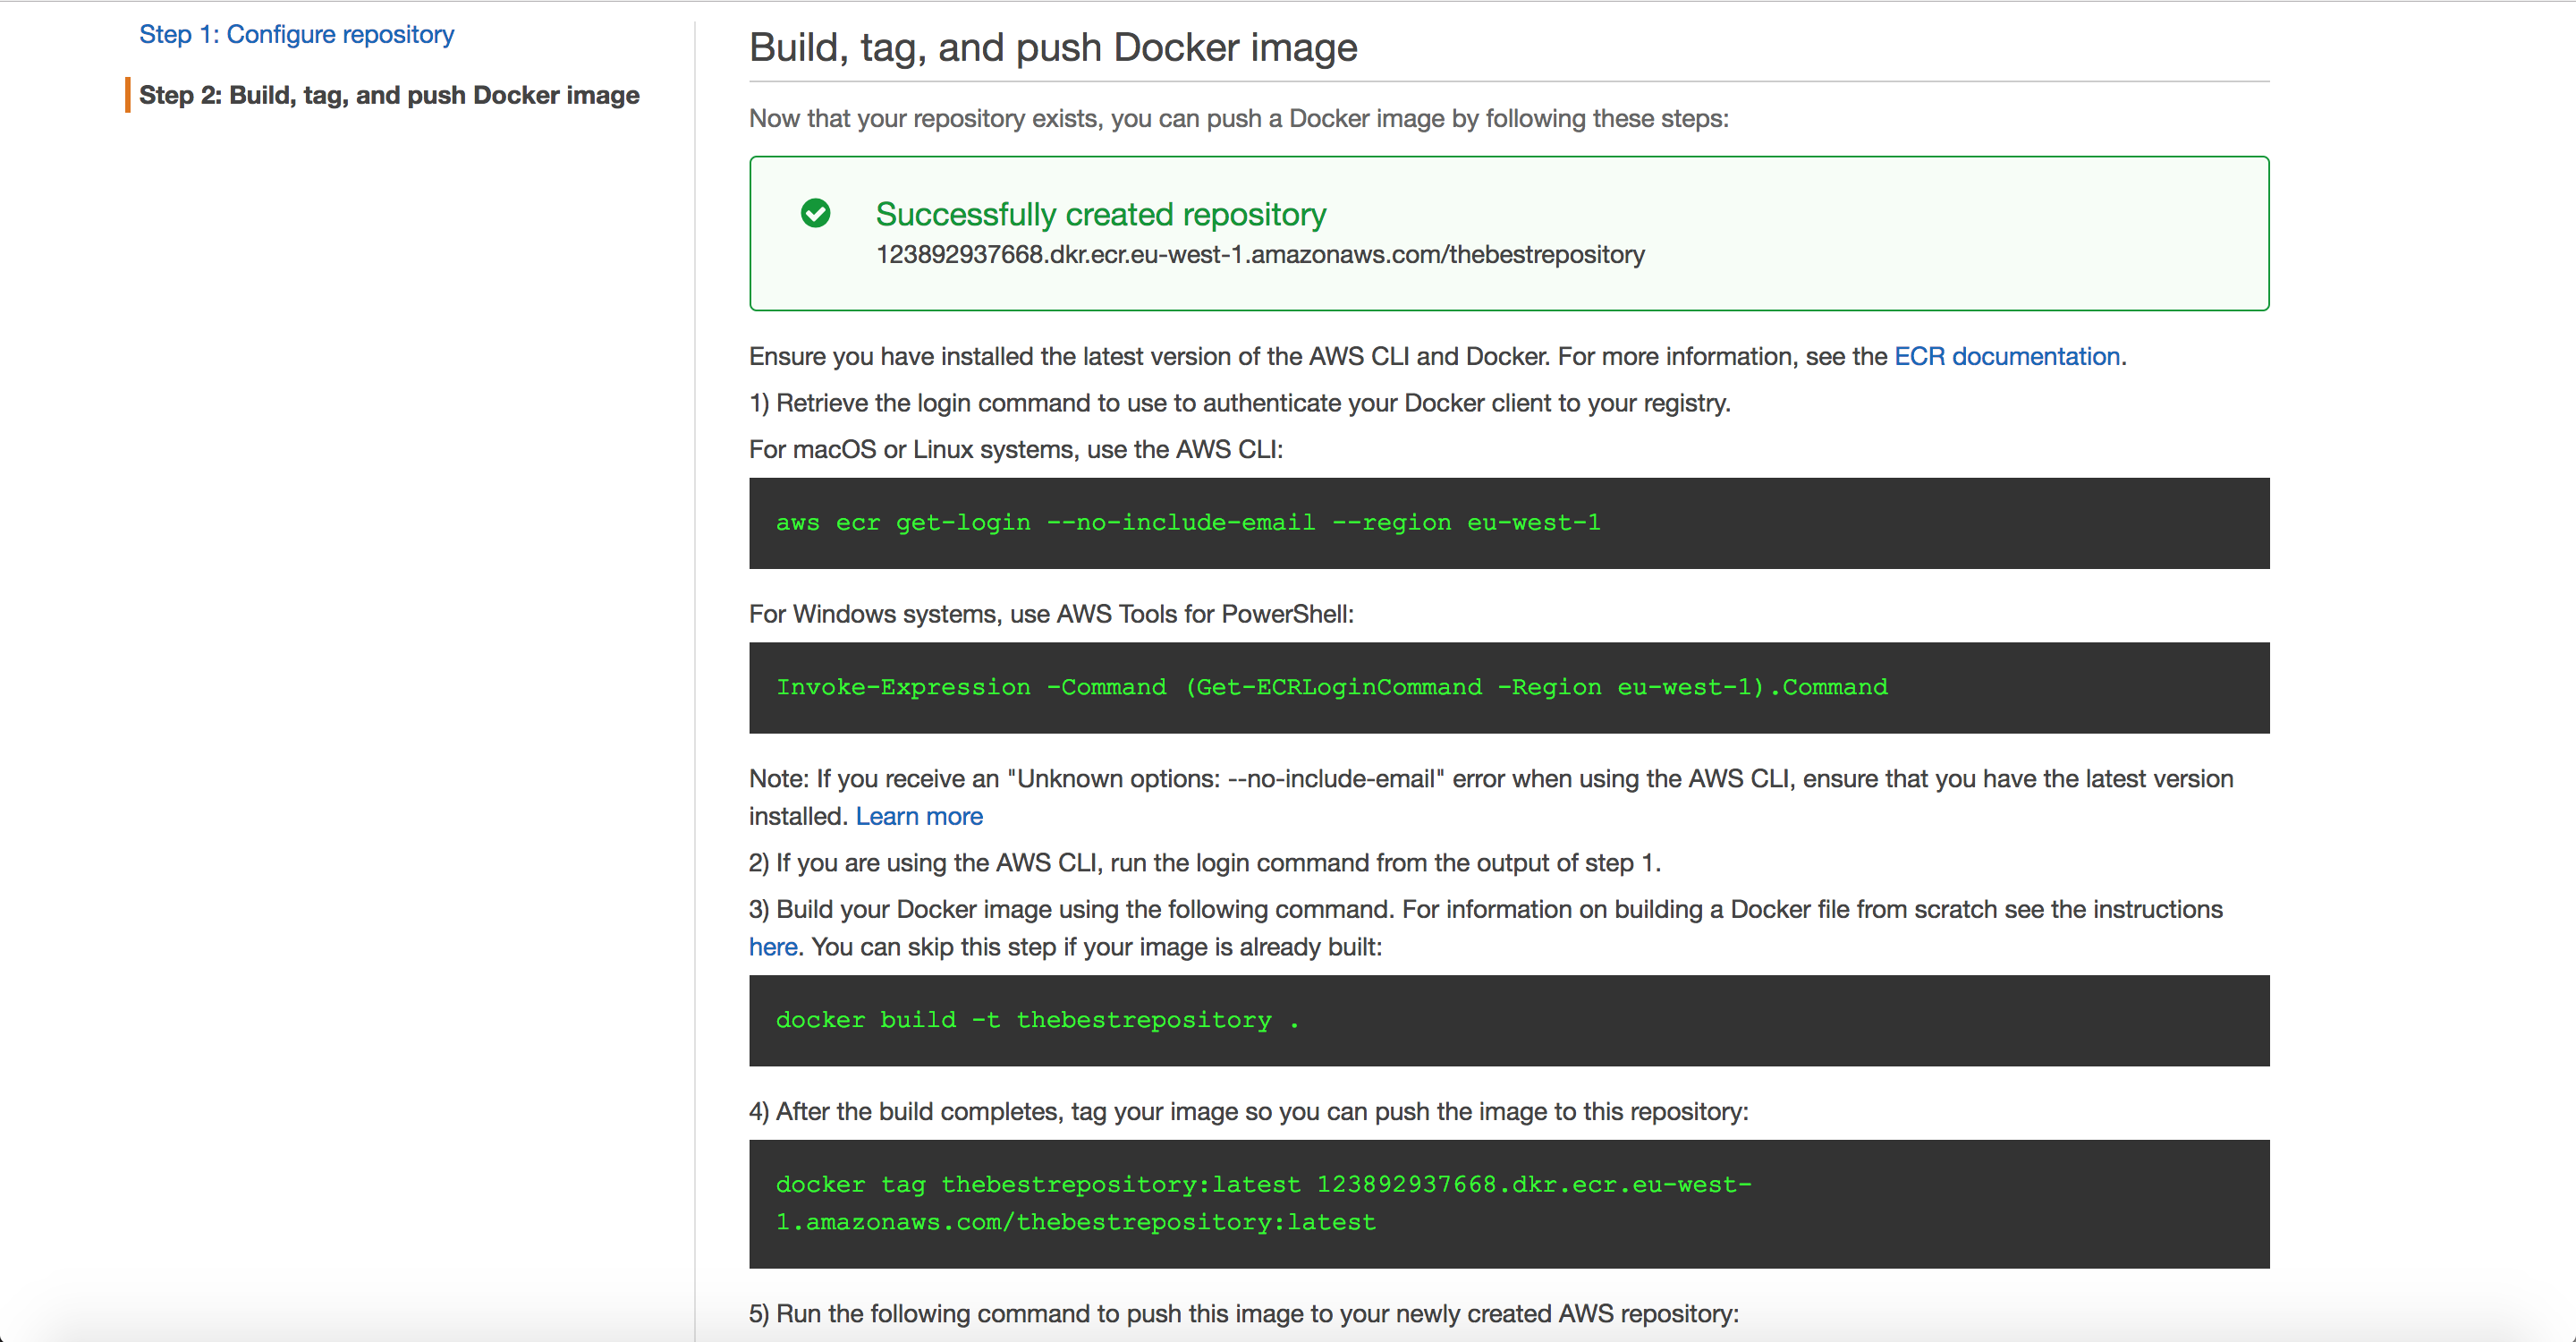
It’s always nice not having to think too much…
If everything on this page goes well, you should see the following:
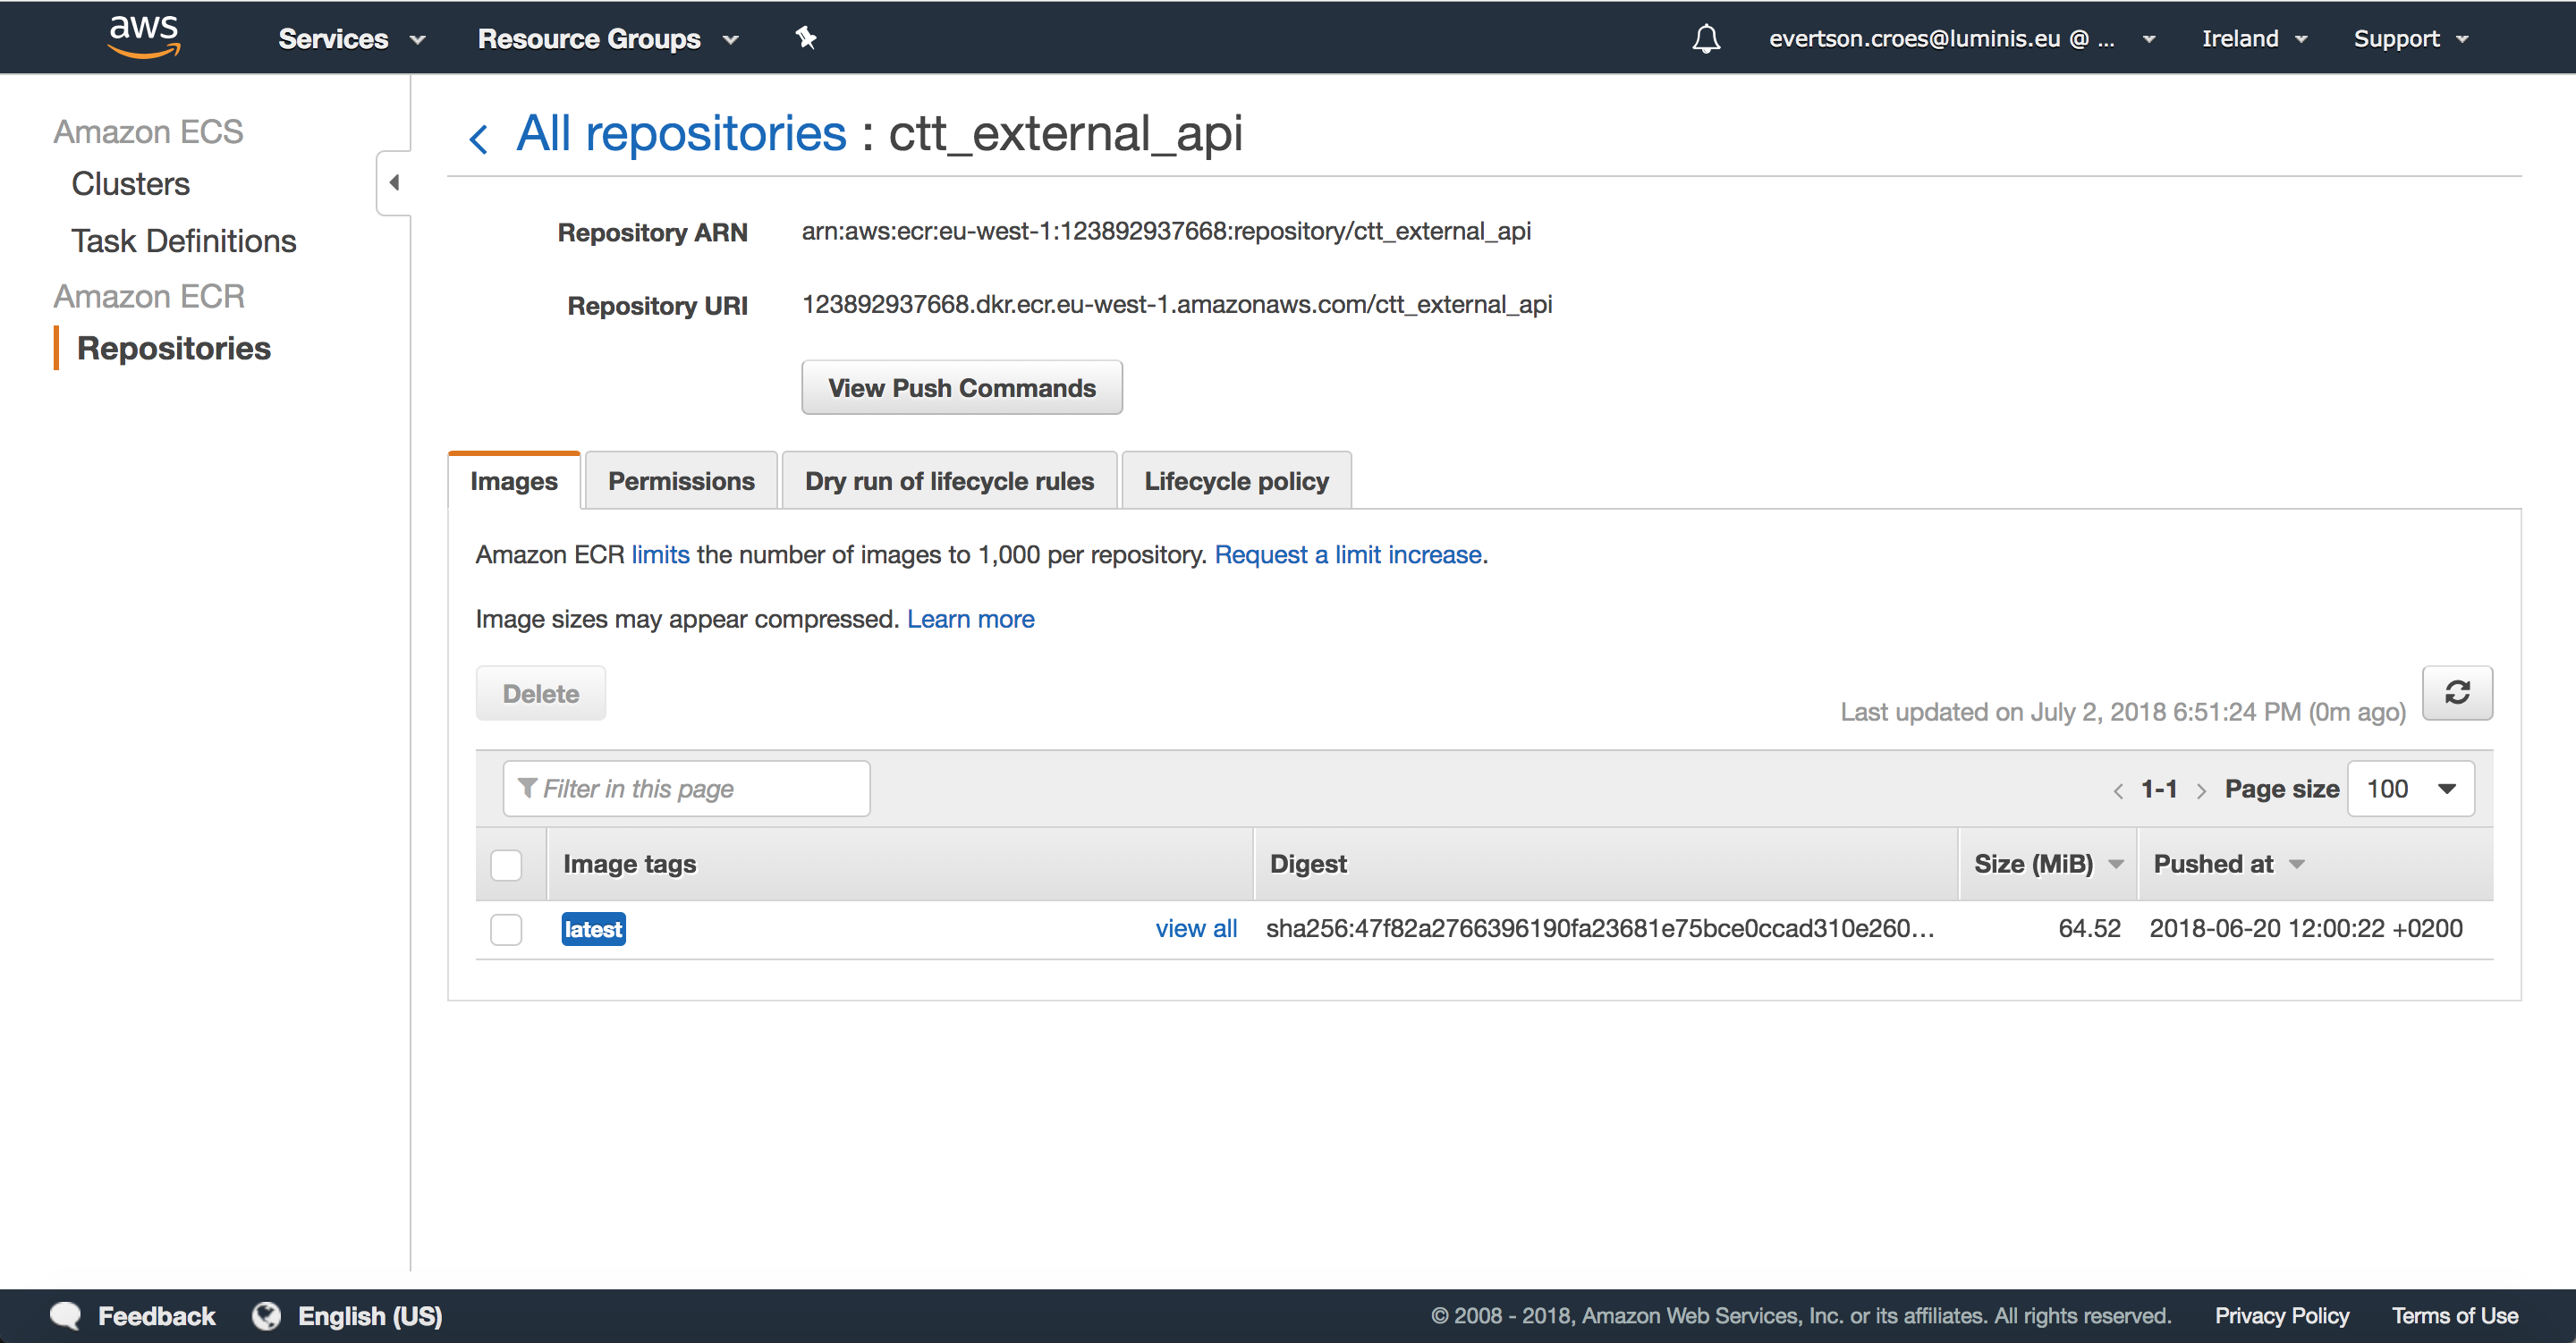
With the table at the bottom showing all the versions of the image that have been pushed. If you want to push to this repository again, just click on the “View Push Commands” button to see the Docker commands again. I never really used any of the other tabs or buttons on this page, so let’s ignore those.
Task Definitions
Go to Task Definitions and select “Create a new Task Definition.” When prompted to select a compatibility type, choose “Fargate.” On the next page, simply enter a valid name for the task and scroll to the bottom where the button “add container” is situated. Ignore all the other settings on this page.
Click on that button and a modal will show up. Fill in the following:
- Container name: You’re good at this by now
- Image: This can be found by going to repositories, clicking on your repository and copying the Repository URI (See last image)
- Port mappings: 443 (if you are using secure, otherwise 80)
- Environment Variables: Here you can overwrite any variables that are set in the Docker file. Scroll back up to the Docker section and notice that the Docker file was configured for 1000 threads. If I add an environment variables here with name “NUMBER_OF_THREADS” and set the value to 1500, the test will run with 1500 instead of the default set in the Docker file.
- Log configuration: Make sure Auto-configure CloudWatch logs is on.
Leave everything else open/unchanged.
Once you are done with this, click on “Add” to close the container settings modal and then click on “Create” to create the task definition. The new task definition should now show up in the list of task definitions. Now we’re ready to run our test!
Clusters
Now we’re going to start a cluster of EC2 instances, which will run our task we just defined. Navigate to Clusters and select “Create cluster”. You will be prompted with three options. I usually go with EC2 Linux + Networking.
Give the cluster a name and leave everything else the way it is and select “Create”. Note:If you are going to be running a lot of requests and notice later on that the EC2 instance type does not have enough memory or CPU, you can select a larger instance type. See this page for more info: https://aws.amazon.com/ec2/instance-types/.
If everything works out, you should see a lot of green:
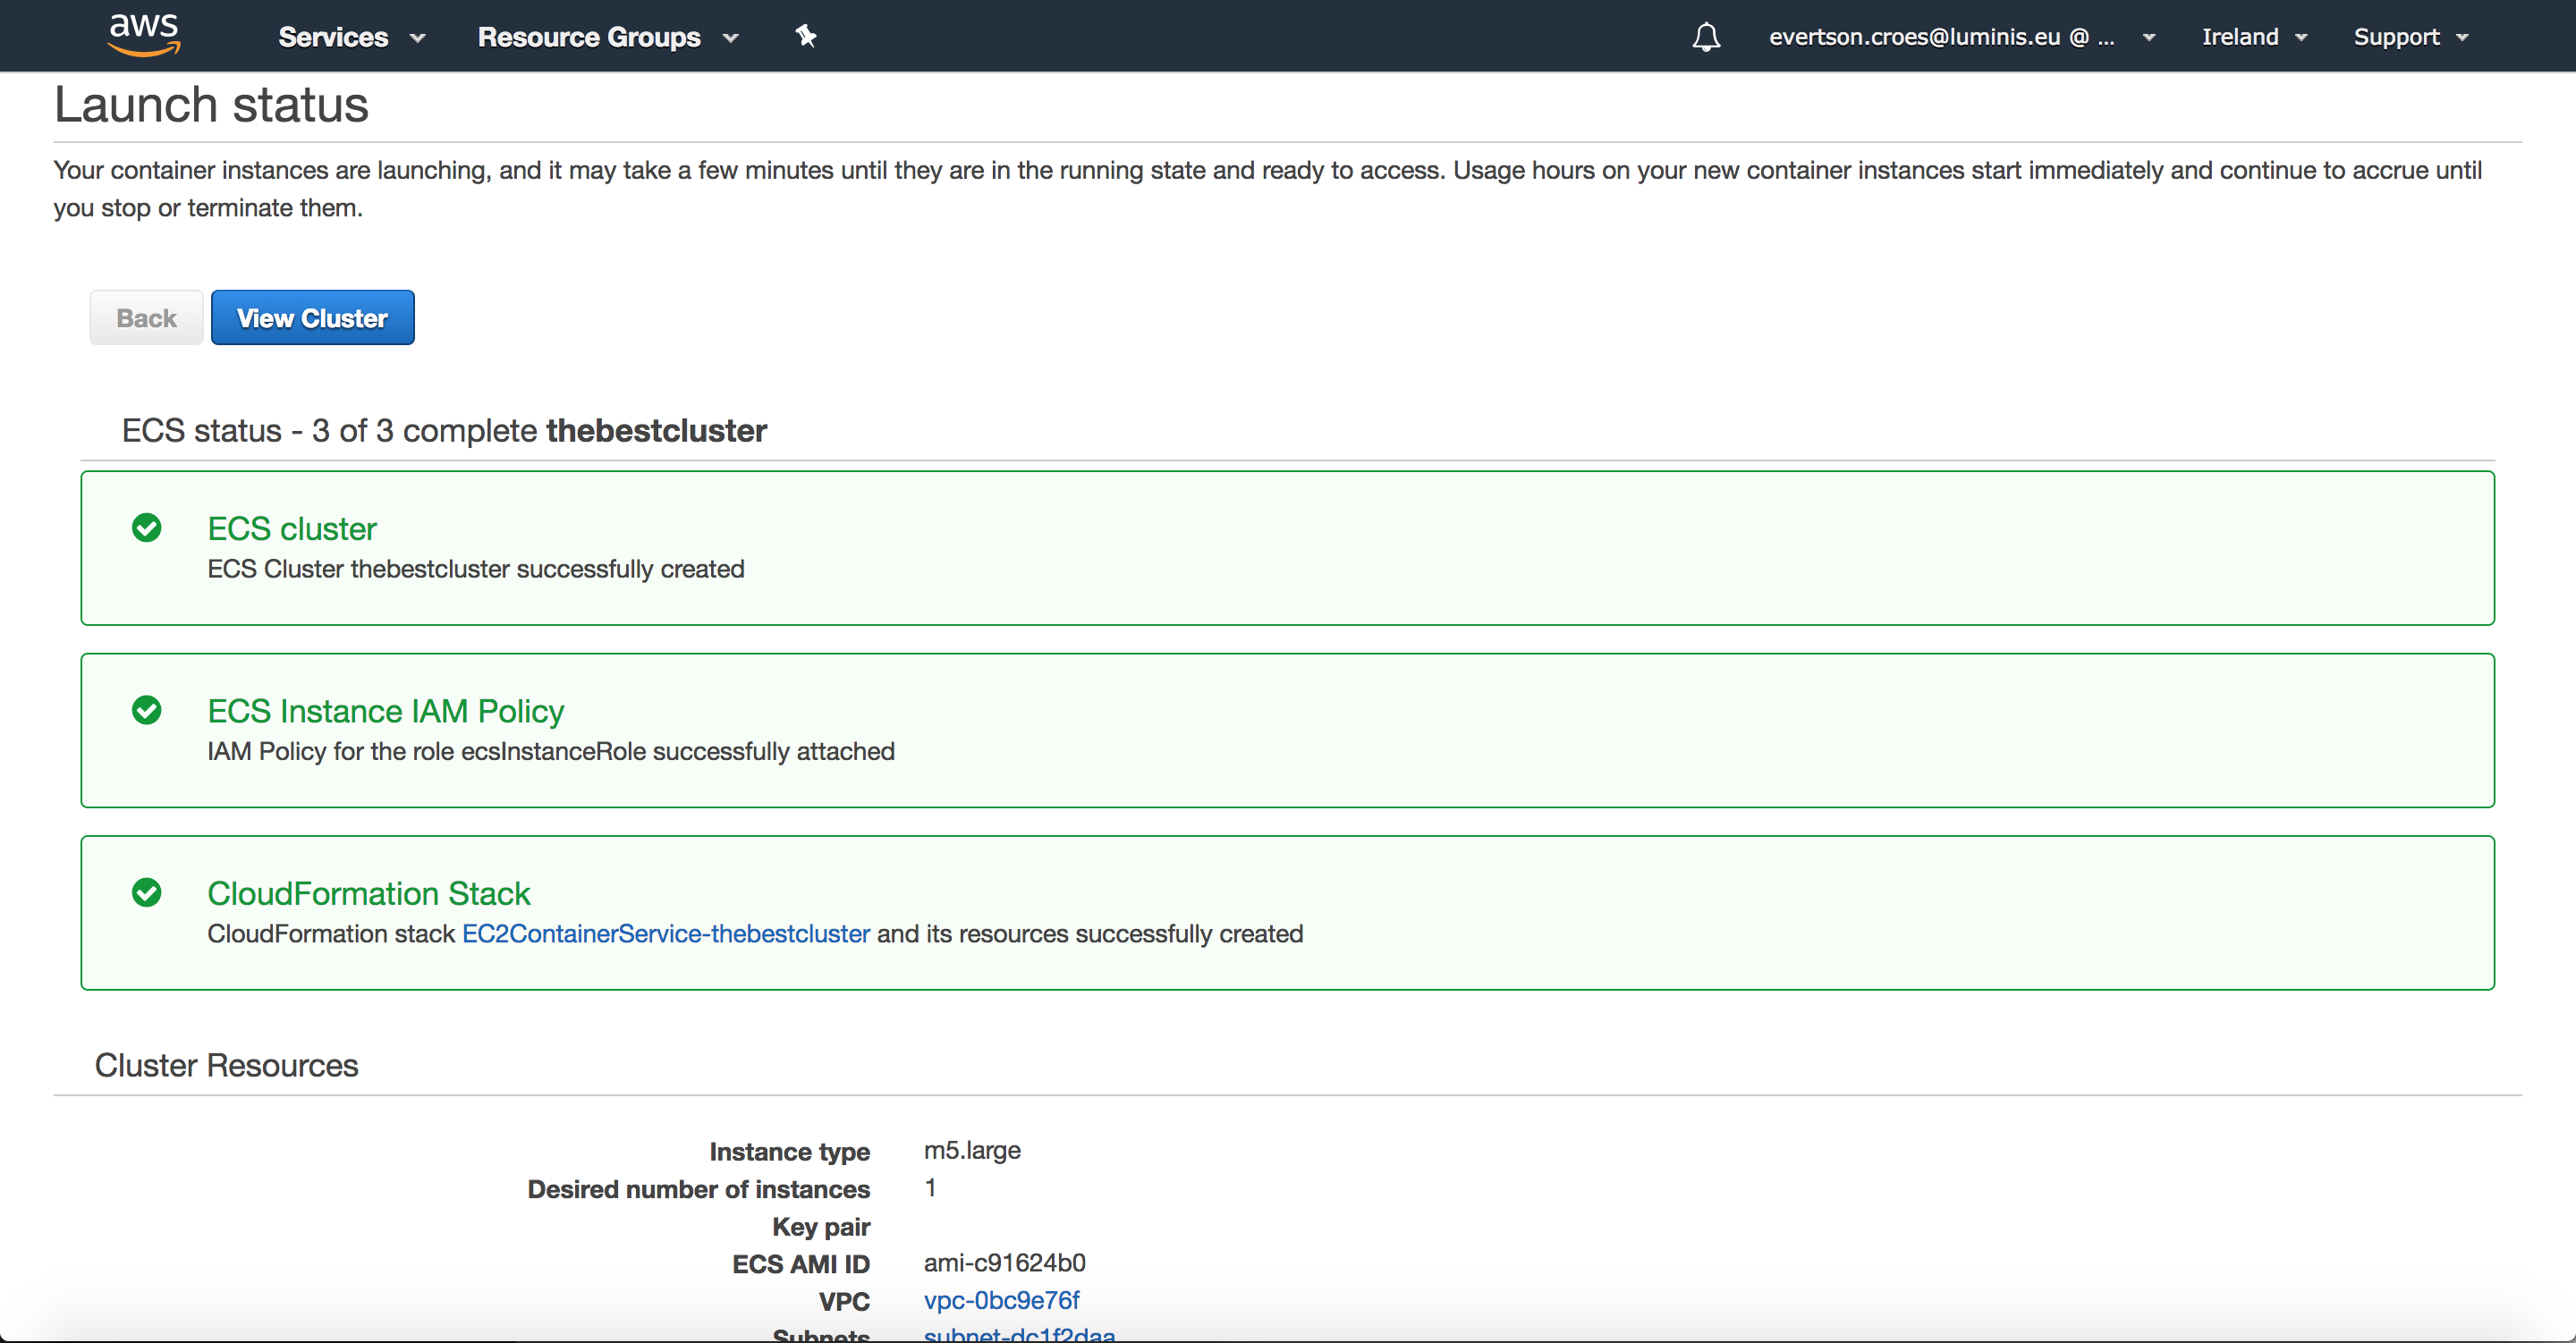
Select “View Cluster” to go to the Cluster management page:
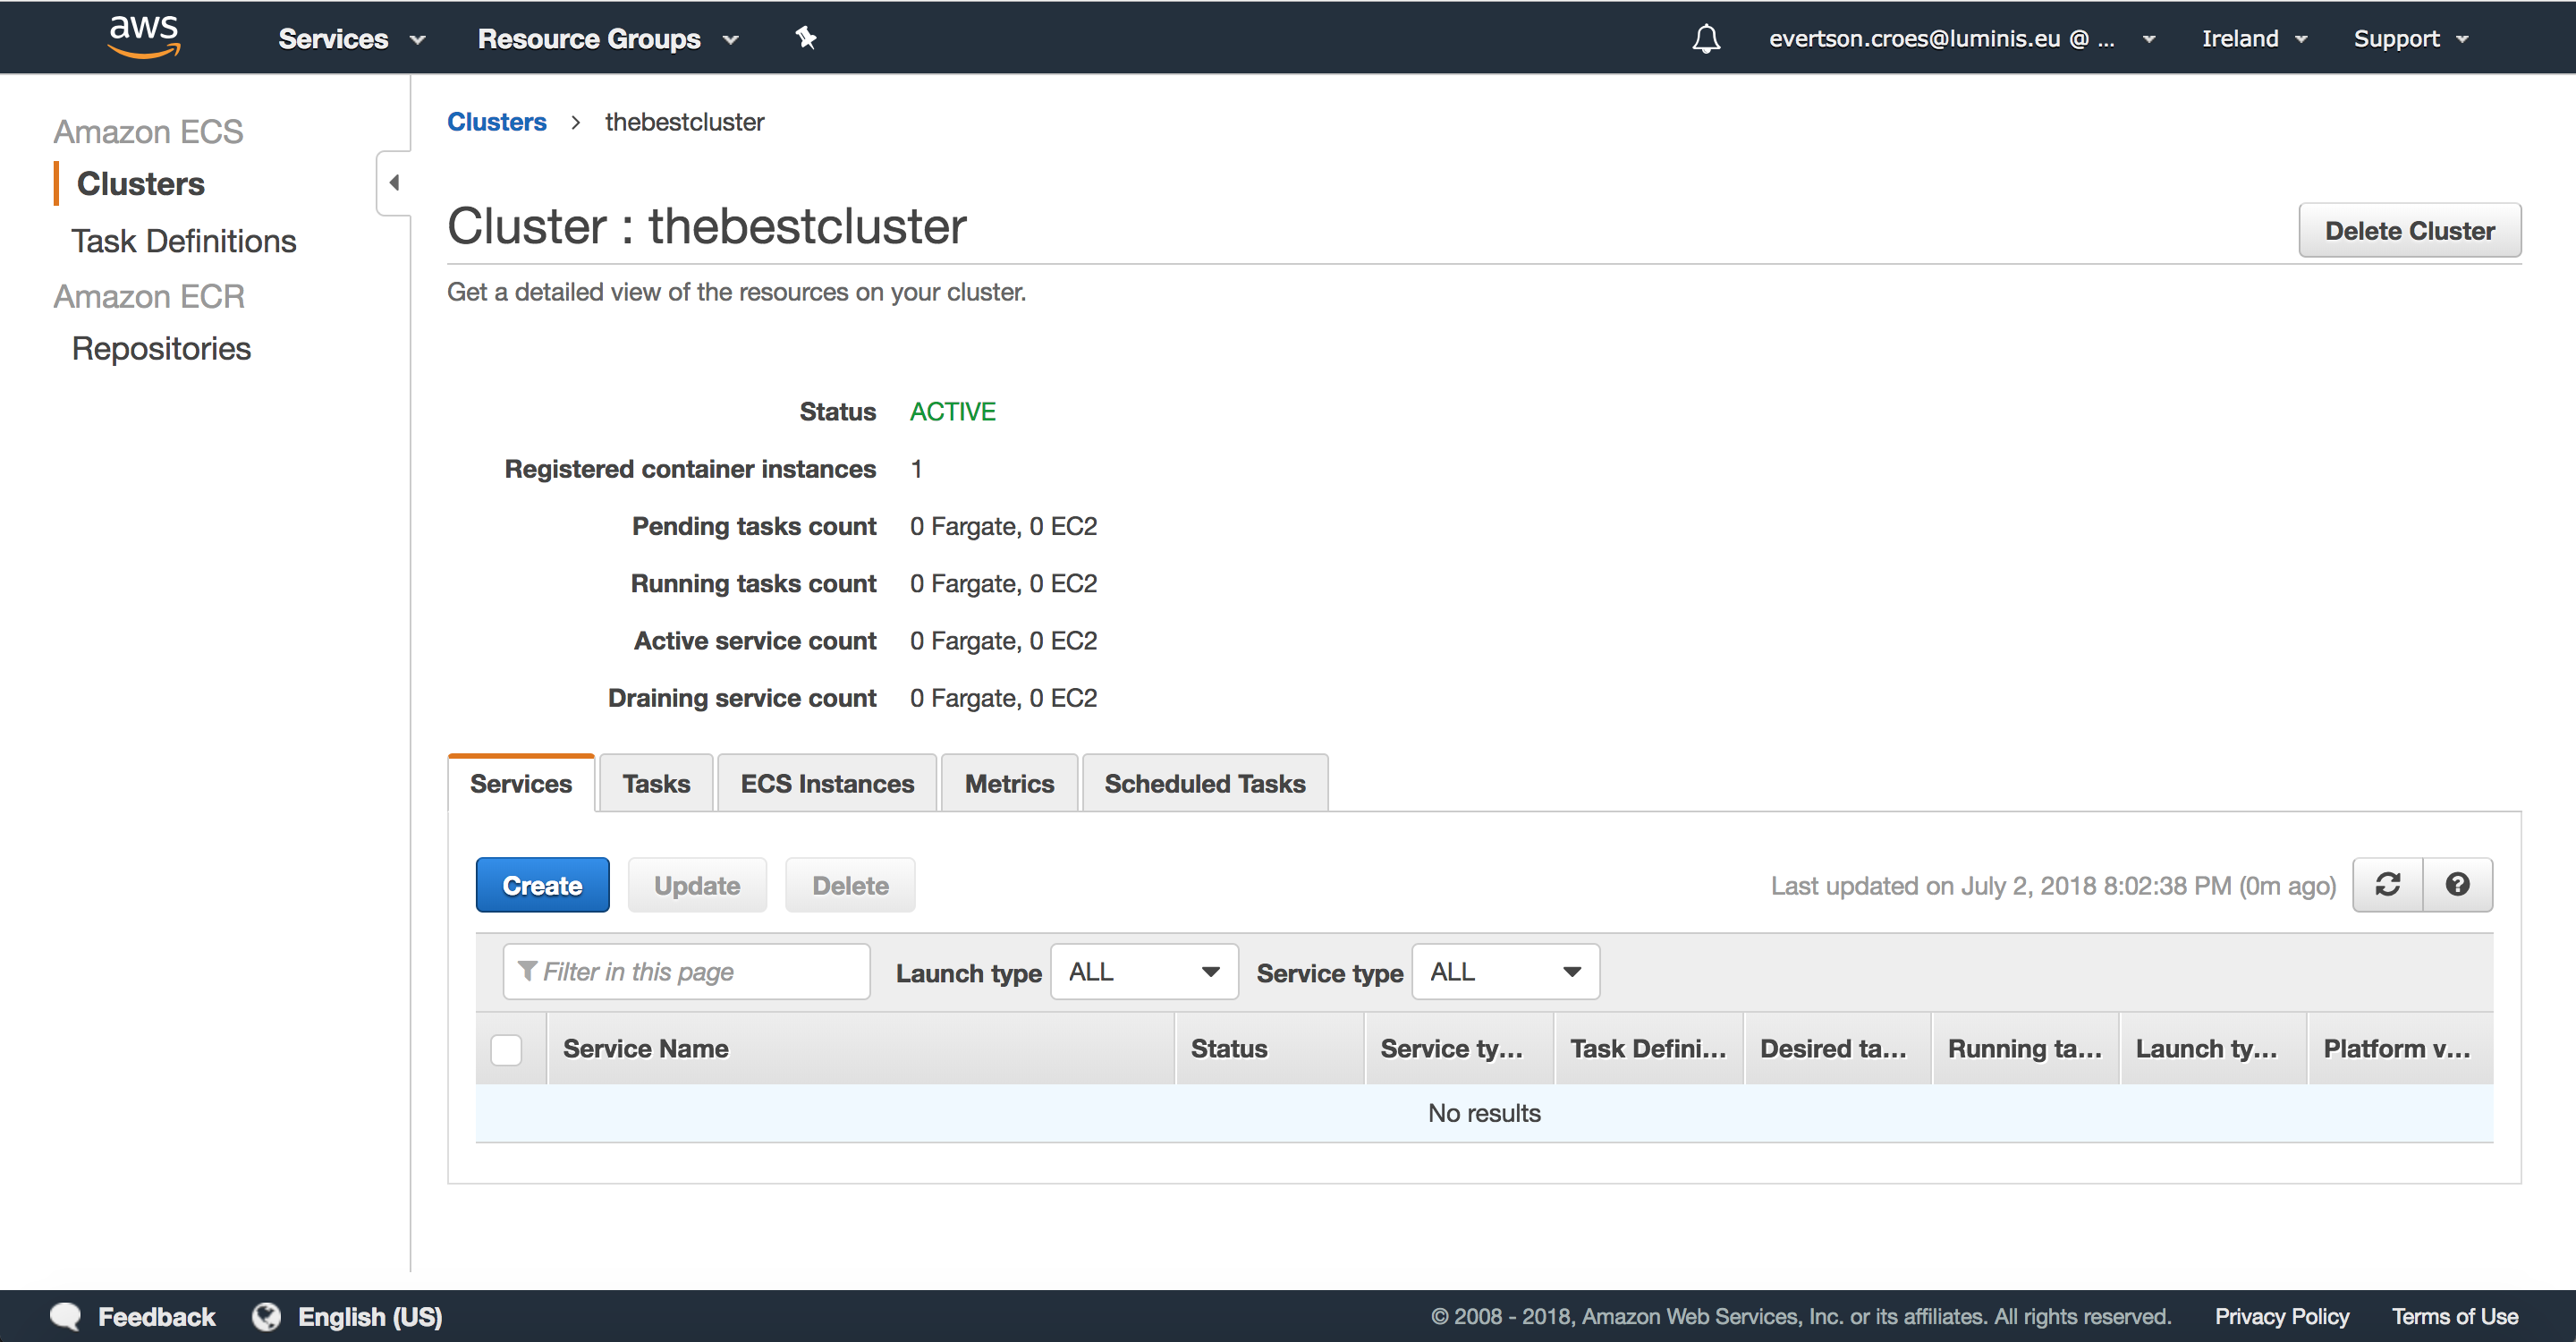
The last thing to do is to open the “Task” tab, select "run new task" and fill in the following:
- Launch type: FARGATE
- Task definition: The task we defined in the previous sub-section
- Cluster: The cluster we just created
- Number of tasks: 1 ---- You could add more, however, this would mean that you would have the n times EC2 instances performing the same operations.
- Cluster VPC: Select the first one
- Subnets: Select the first one
The rest can be left unedited. Note: You can still overwrite environment variables for this run specifically by clicking on “Advanced Options” and clicking on “Container Overrides”. You can change any of the values there. Select “Run Task” to finally run your test. Viola! Your test is now running:
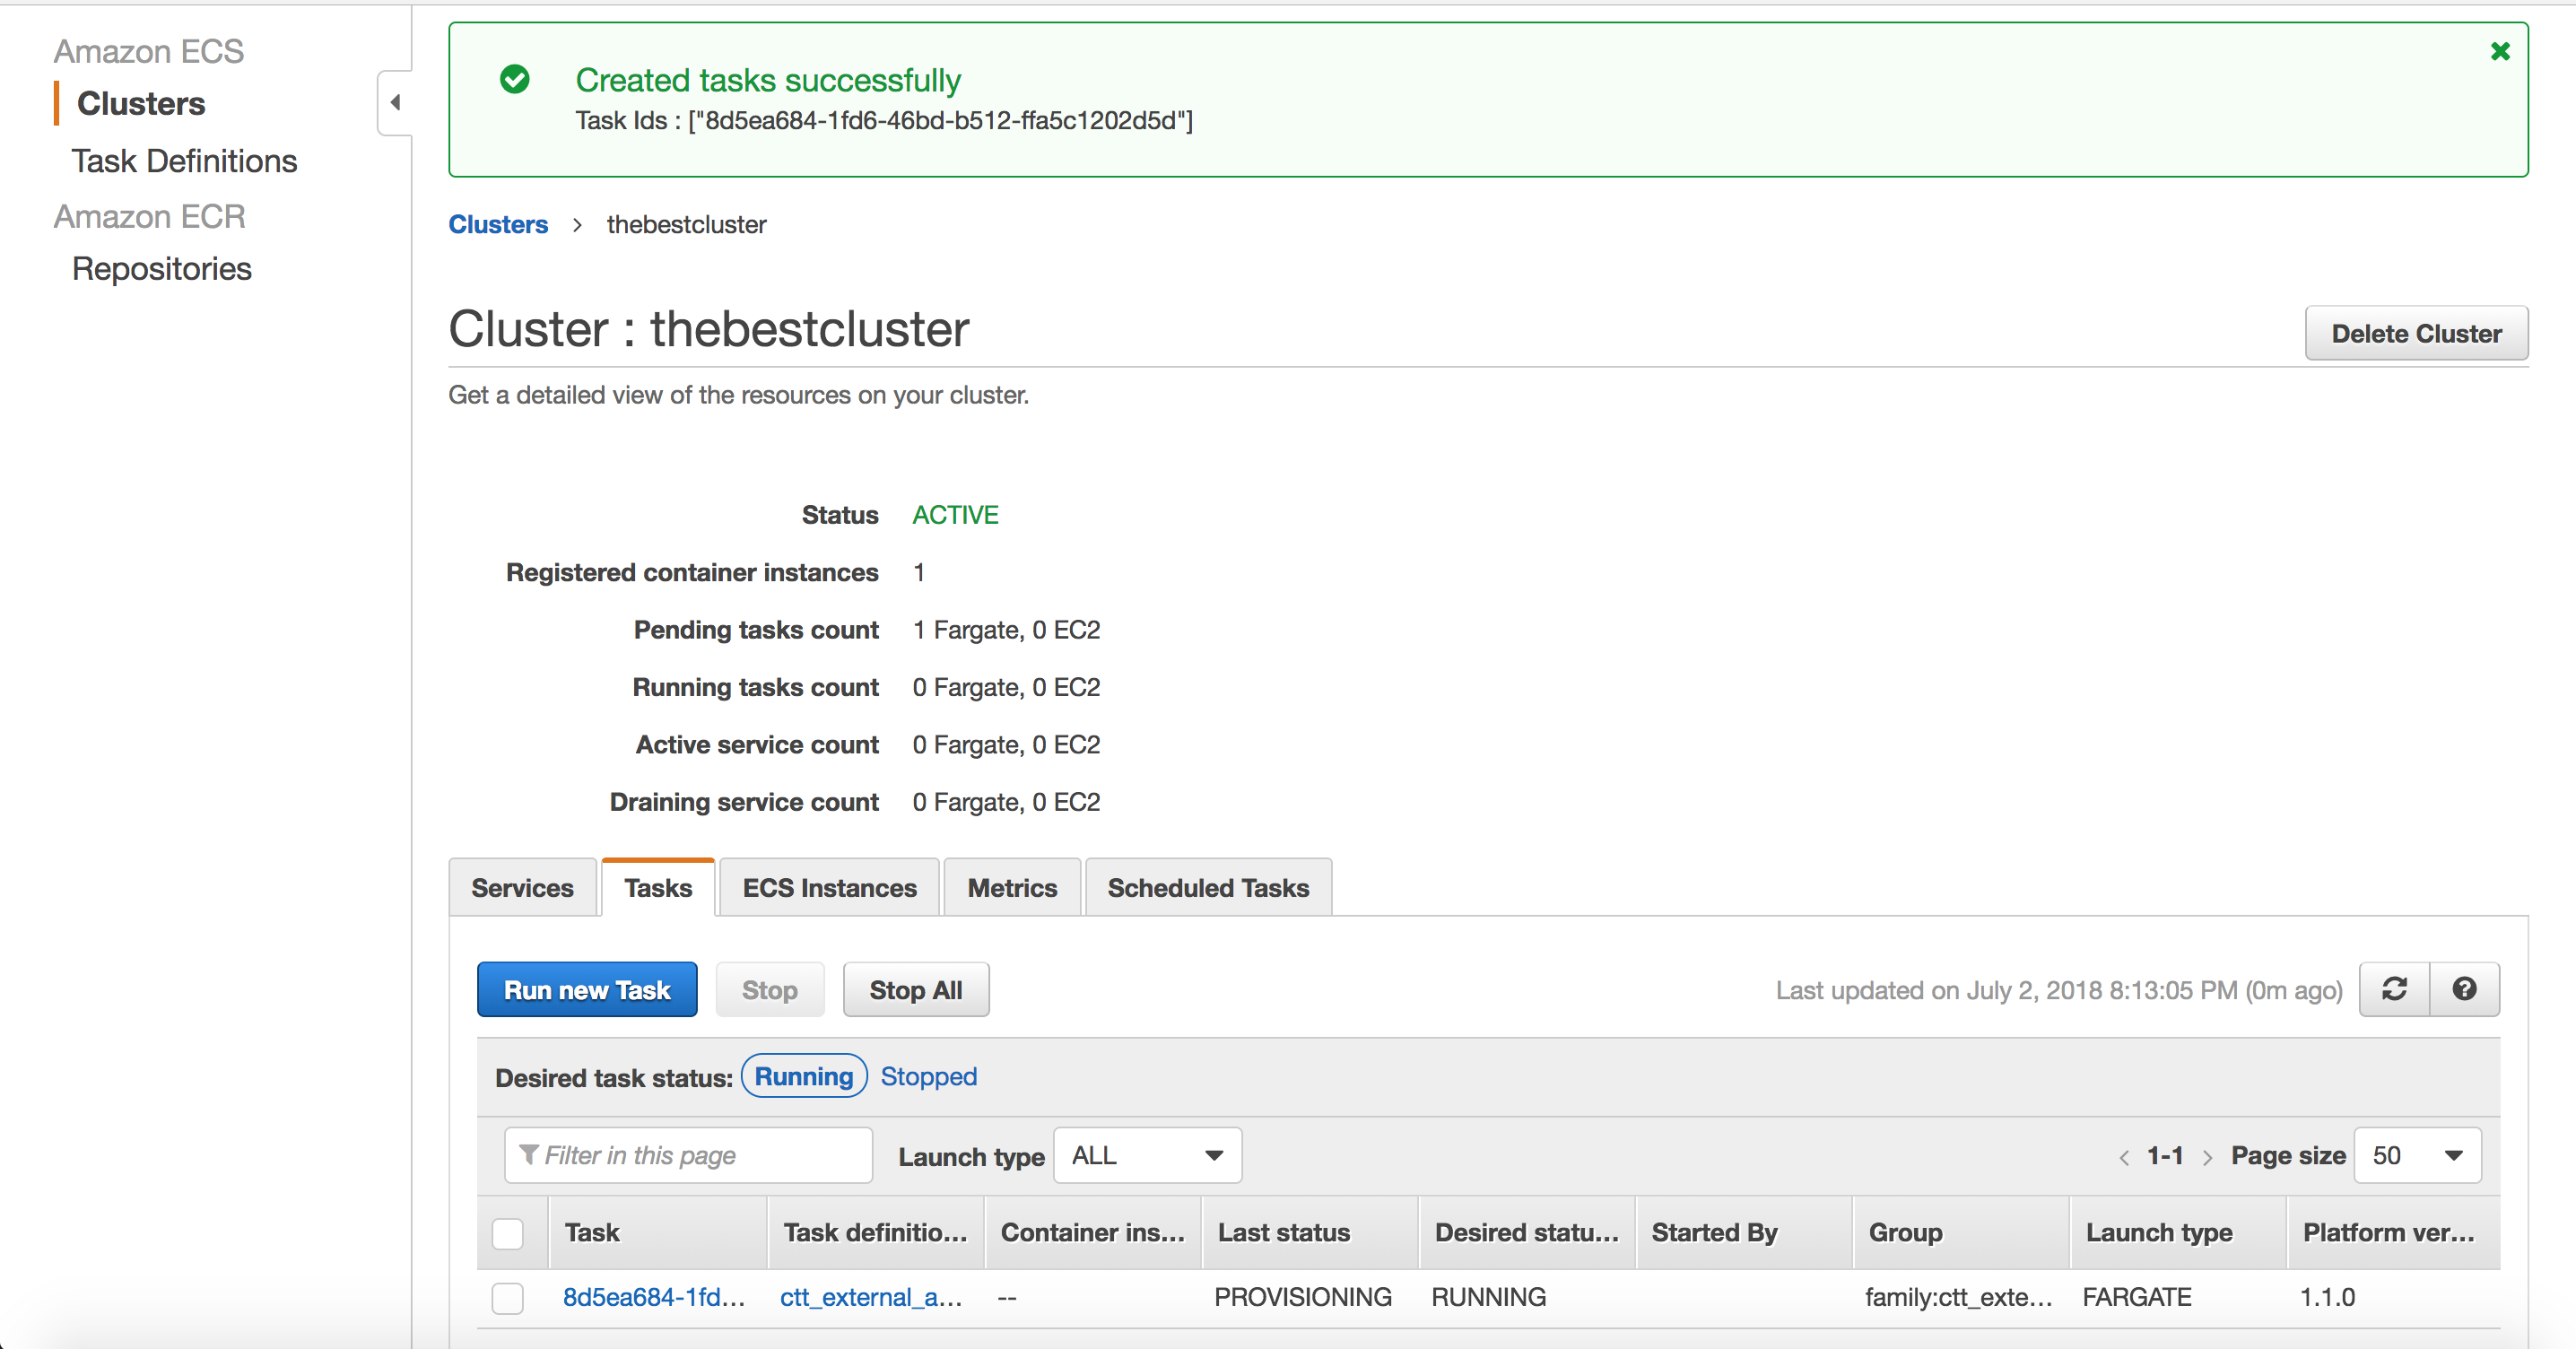
NOTE: The JMeter Log file and .xml file will be copied to S3 “bucket” specified in the Docker file:
aws s3 cp $TEST_LOG_FILE s3://performance-test-logging/uploads/ && \
aws s3 cp $TEST_RESULTS_FILE s3://performance-test-logging/uploads/ && \
S3 is another AWS service used for storage. You can find it under the list of services, in the same way that you found the Elastic Container service.
CloudWatch
Remember when I told you to make sure that auto config was on for Cloud Watch? This is where it comes in handy. CloudWatch is a service that offers many monitoring capabilities, including log streaming and storing. In this case, we are interested in following our tests as they are being run.
Click on the Amazon logo to go back to the screen with all the services, type in CloudWatch and select it. It should look something like this:
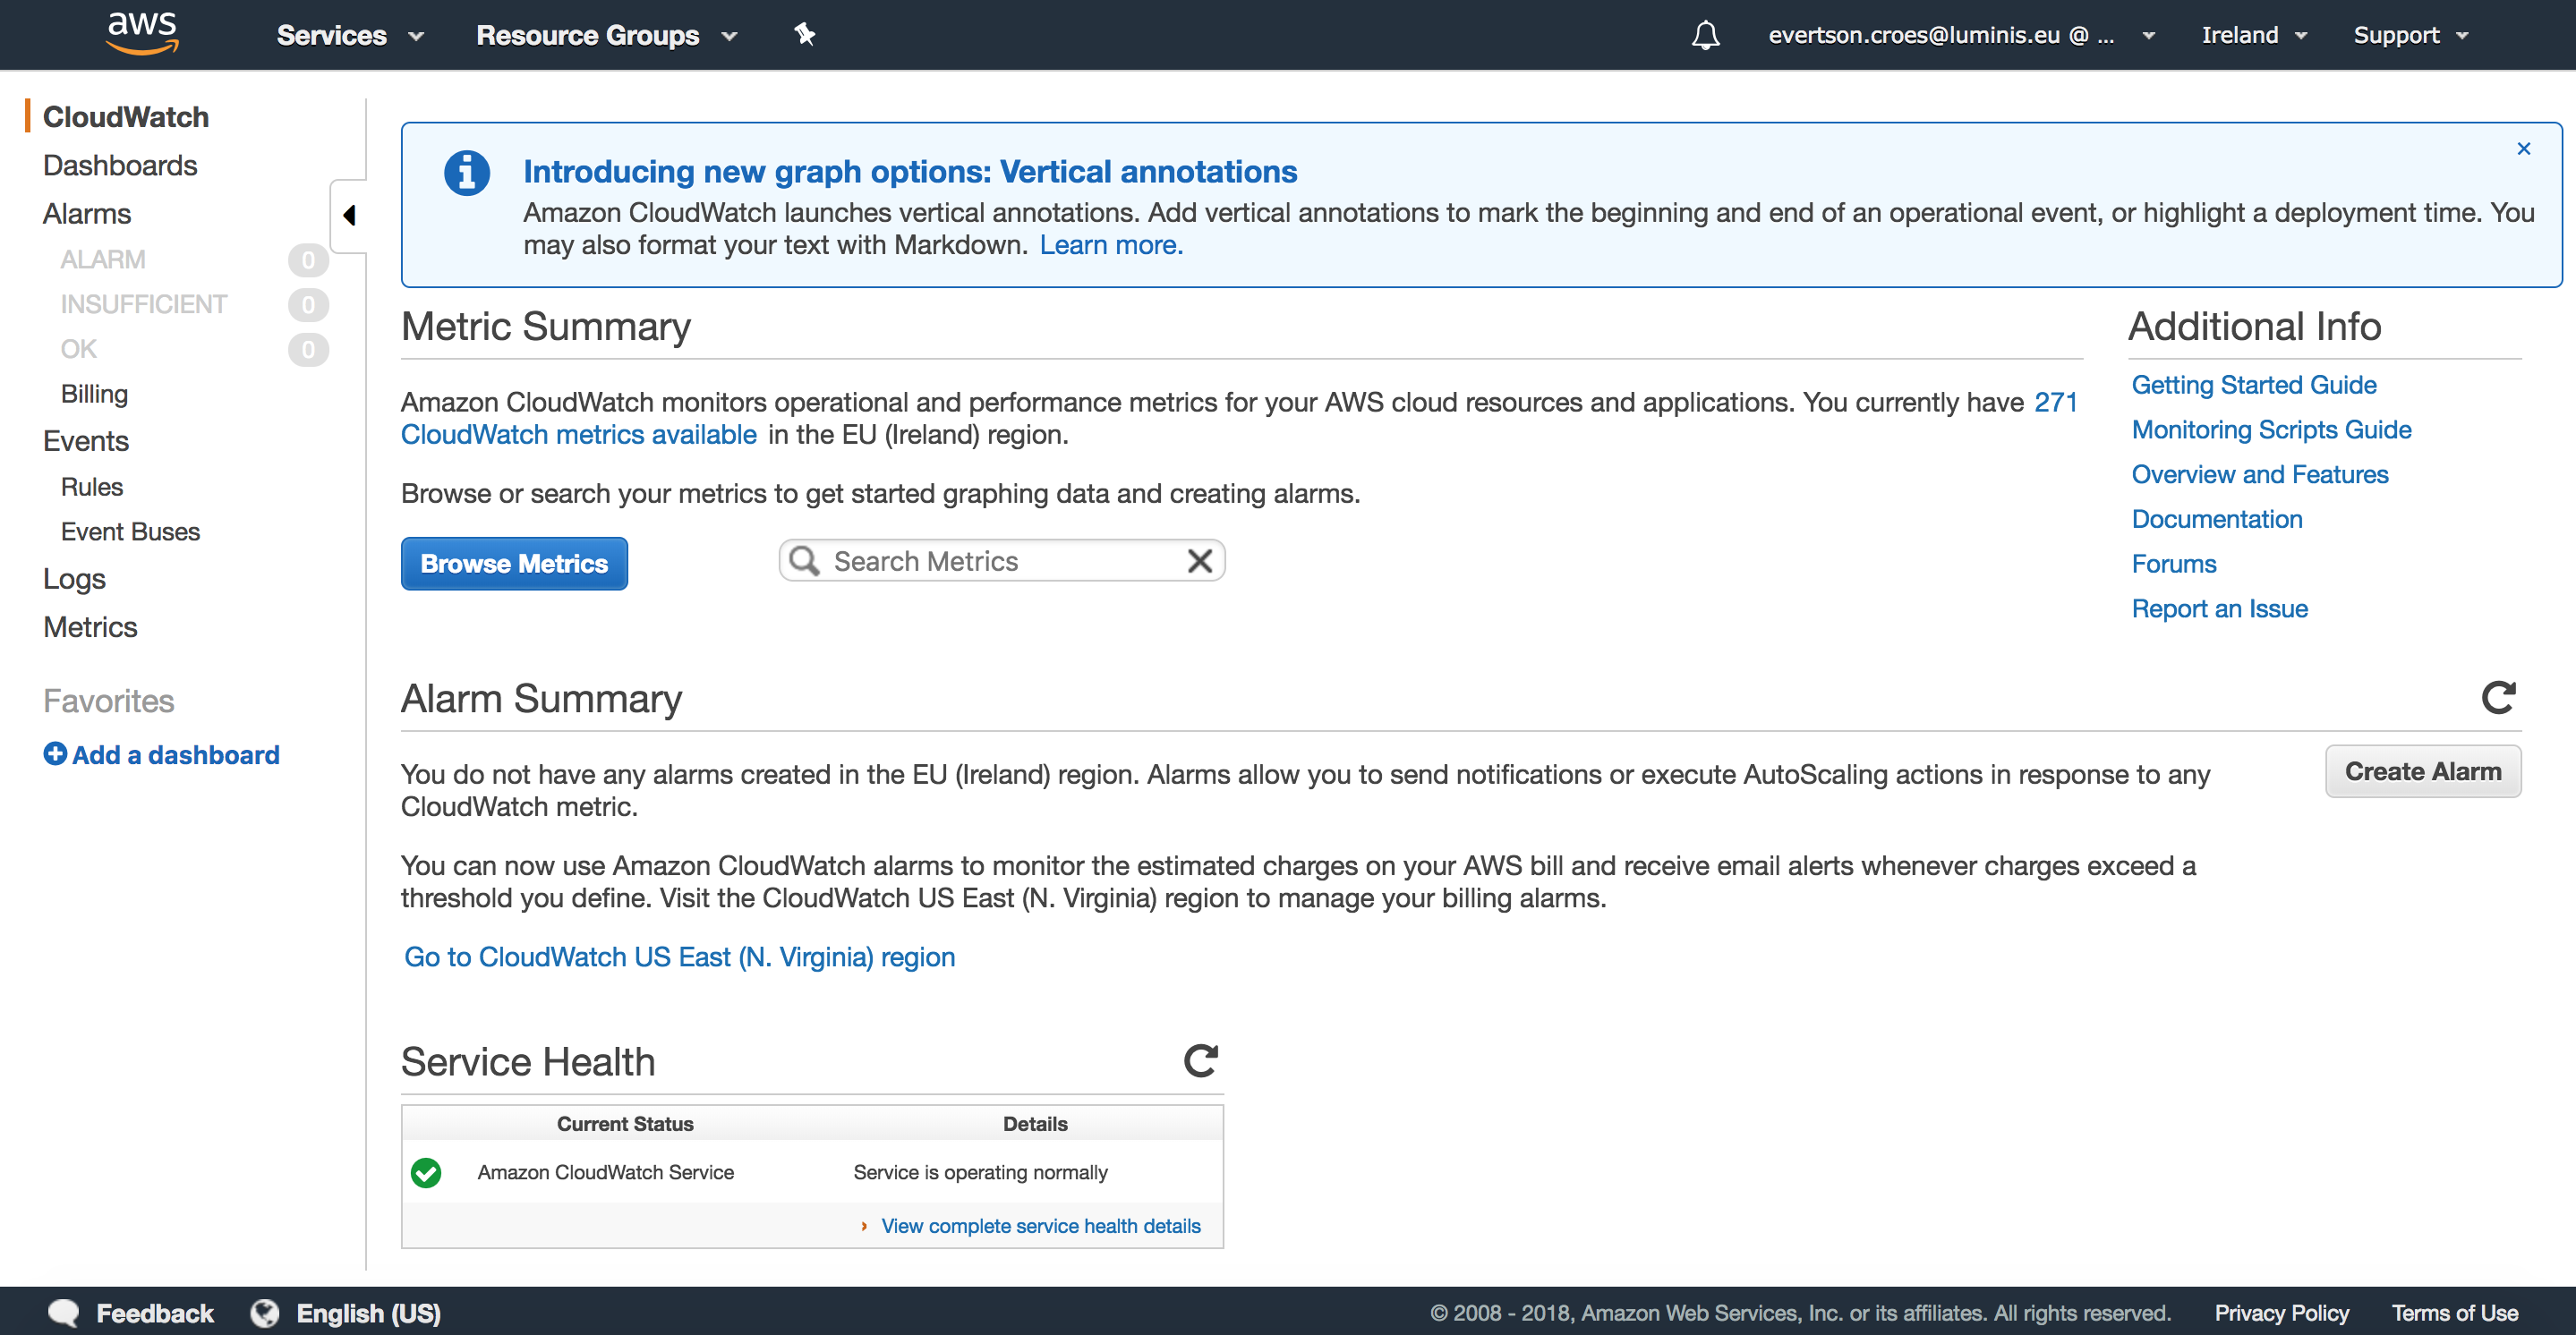
On the left navigation bar, select "Logs." You should see a table with log groups. One of the log groups should have the name of your Task Definition that you defined earlier. Click on it to see a list of logs for test runs that you have performed. When clicking on one, you will be able to see the logging of that test. It is also possible to the see the live logging as the test is being performed:
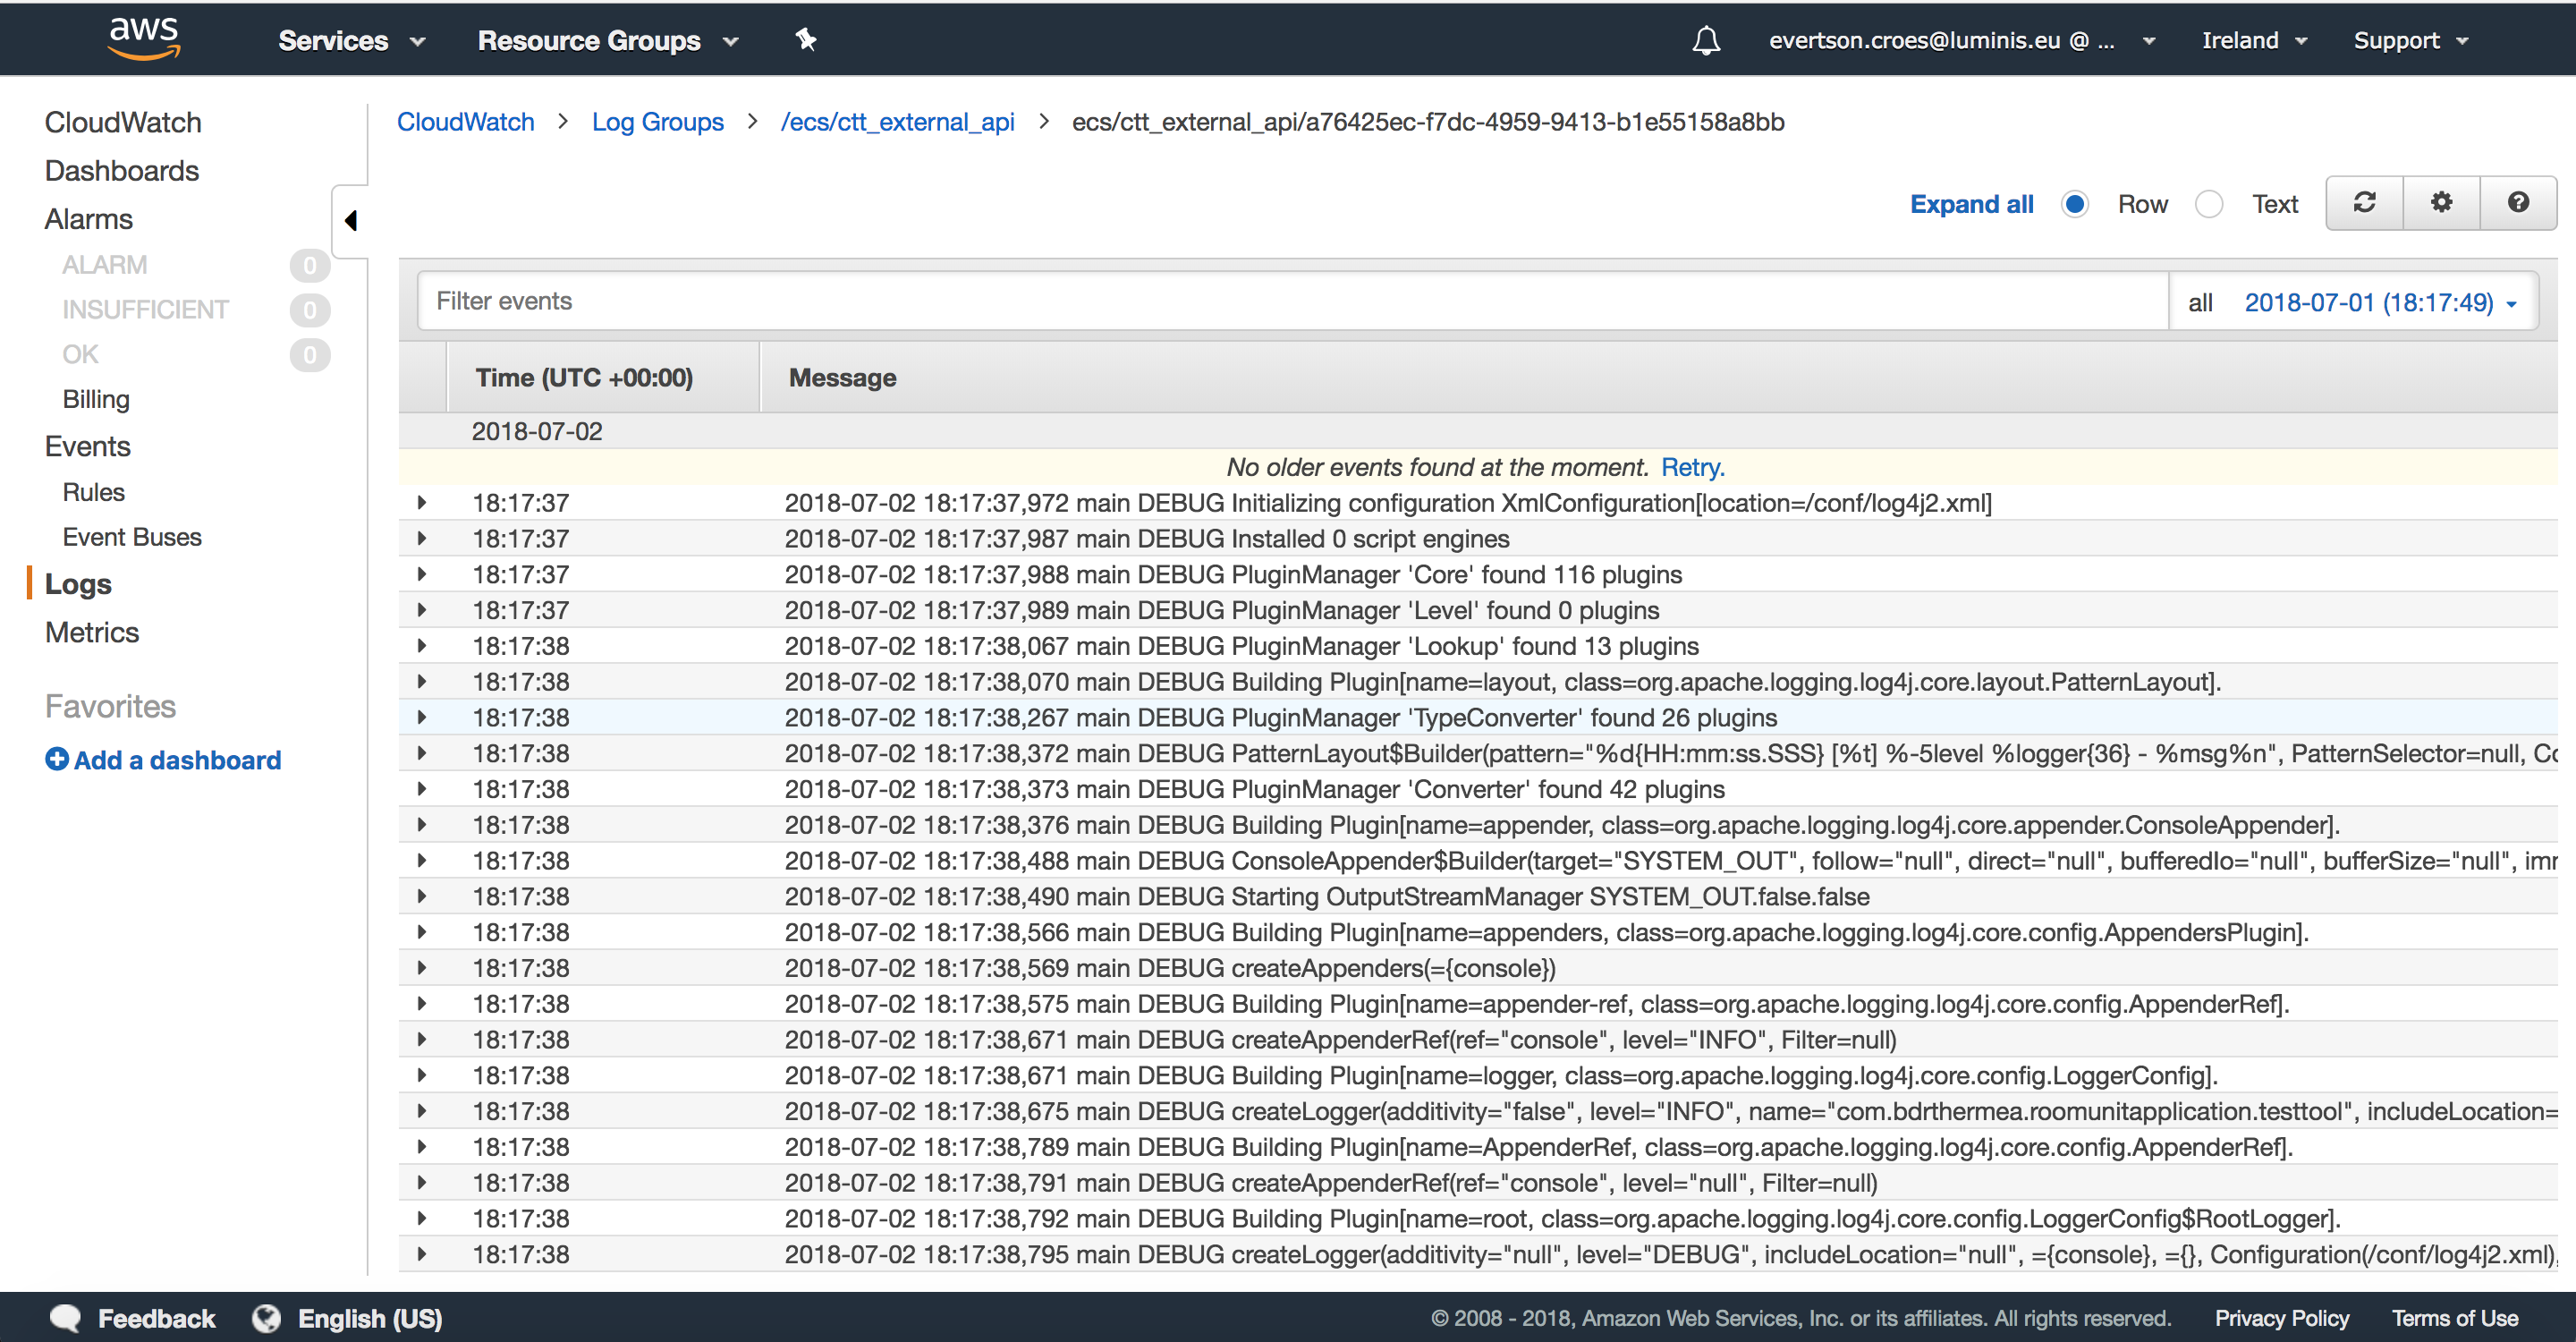
As the test is running, the log file becomes pretty big and hard to follow. Here are some keywords you can type into the “filter events” text field in order to get some useful info of the test that is currently running:
- “summary”: This will show you the JMeter summary of the test, including the number of error percentages.
- “jmeter”: To see a list of all the parameters used for this test
- “error”: To see a list of all the errors. You can click on an error log to see more info.
Some Advice Based on Experience
Here is a list of some things we figured out while running these tests on our application:
- Feedback is important. Make sure you have enough feedback to be sure that your tests are being performed the way you expect. Some of the things you can do we already covered in this blog, such as setting up CloudWatch and copying the .log and .xml files to s3 to be viewed later on. Other valuable feedback is logging in your application. Set it to Debug mode if possible during these tests. If you have any type of monitoring that can check the server and how many open TCP connections it has would also be great for proving that your tests are successful if you are using WebSockets.
- You might get errors because of your client rather than your application on the server. If you try to do too many requests or create too many WebSocket connections from one AWS EC2 instance, you might start to run into client-side errors. For us, we could only run around 5000 WebSocket connections per instance. What we ended up doing was creating separate containers and task definitions per 5000 connections and running those tasks simultaneously.
- Don’t only test your application for the number of connections/request, but also test the connection/request rate it can handle. This means decreasing the ramp-up time in order to increase the number of connections/requests per second. This is important to know, as your applications might be challenged with this connection rate in the future. For us, it was important, since restarting the application meant that all connected devices would start connecting within a certain time period.
- A single TCP port can handle 64k open connections. If you want to perform a test where you will need more than this, you will have to use another port and have your application listen to both ports. You will also need to have a load balancer of some kind which can distribute the load between the ports.
Conclusion
I hope this blog has given you an idea of what is possible when combining these three technologies. I know in a lot of the sections I simply told you to do something without giving much of an explanation as to what everything does. There are a lot of things you can do with JMeter, Docker, and AWS and I encourage you to look them up and find what works for you. This setup worked for our case, and we are planning on running a test with 100k connections in the near future using this stack. Thanks for reading!
Published at DZone with permission of Evertson Croes. See the original article here.
Opinions expressed by DZone contributors are their own.

Comments