Simulating and Troubleshooting Thread Leaks in Kotlin
In this series of simulating and troubleshooting performance problems in Kotlin, let’s discuss how to simulate thread leaks.
Join the DZone community and get the full member experience.
Join For FreeIn this series of simulating and troubleshooting performance problems in Kotlin, let’s discuss how to simulate thread leaks. java.lang.OutOfMemoryError: unable to create new native thread will be thrown when more threads are created than the memory capacity of the device. This error will disrupt the application’s availability.
Video: To see the visual walk-through of this post, click below:
Kotlin Sample Thread Leak Program
Here is a sample kotlin program, which will generate java.lang.OutOfMemoryError: unable to create new native thread.
package com.buggyapp
   class ThreadLeakApp {
     fun start() {
        while (true) {
          ForeverThread().start()
        }
     }
  }
  class ForeverThread : Thread() {
      override fun run() { // Put the thread to sleep forever, so they don't die.
          while (true) {
             try {
             // Sleeping for 100 milliseconds repeatedly
             Thread.sleep(100)
             } catch (e: Exception) {
             }
          }
      }
  }
You can notice that the sample program contains the ThreadLeakApp class. This class has astart() method. In this method, ForeverThread is created an infinite number of times because of the while (true) loop.
In the ForeverThread class, there is therun() method, where the thread is put to continuous sleep, i.e., the thread is repeatedly sleeping for 100 milliseconds again and again. This will keep the ForeverThread alive always without doing any activity. A thread will die only if it exits the run() method. In this sample program, the run() method will never exit because of the never-ending sleep.
Since the ThreadLeakApp class creates non-terminating ‘ForeverThread’ infinitely, it will ultimately result in java.lang.OutOfMemoryError: unable to create new native thread problem.
How To Diagnose ‘java.lang.OutOfMemoryError: unable to create new native thread’
You can diagnose OutOfMemoryError: unable to create new native thread problem either through a manual or automated approach.
Manual Approach
In the manual approach, you need to capture thread dumps as the first step. A thread dump shows all the threads that are in memory and their code execution path. You can capture a thread dump using one of the 8 options mentioned here. But an important criterion is: You need to capture thread dump right when the problem is happening (which might be tricky to do). Once the thread dump is captured, you need to manually import the thread dump from your production servers to your local machine and analyze it using thread dump analysis tools like fastThread, and samurai.
Automated Approach
On the other hand, you can also use yCrash open source script, which would capture 360-degree data (GC log, 3 snapshots of thread dump, heap dump, netstat, iostat, vmstat, top, top -H,…) right when the problem surfaces in the application stack and analyze them instantly to generate root cause analysis report.
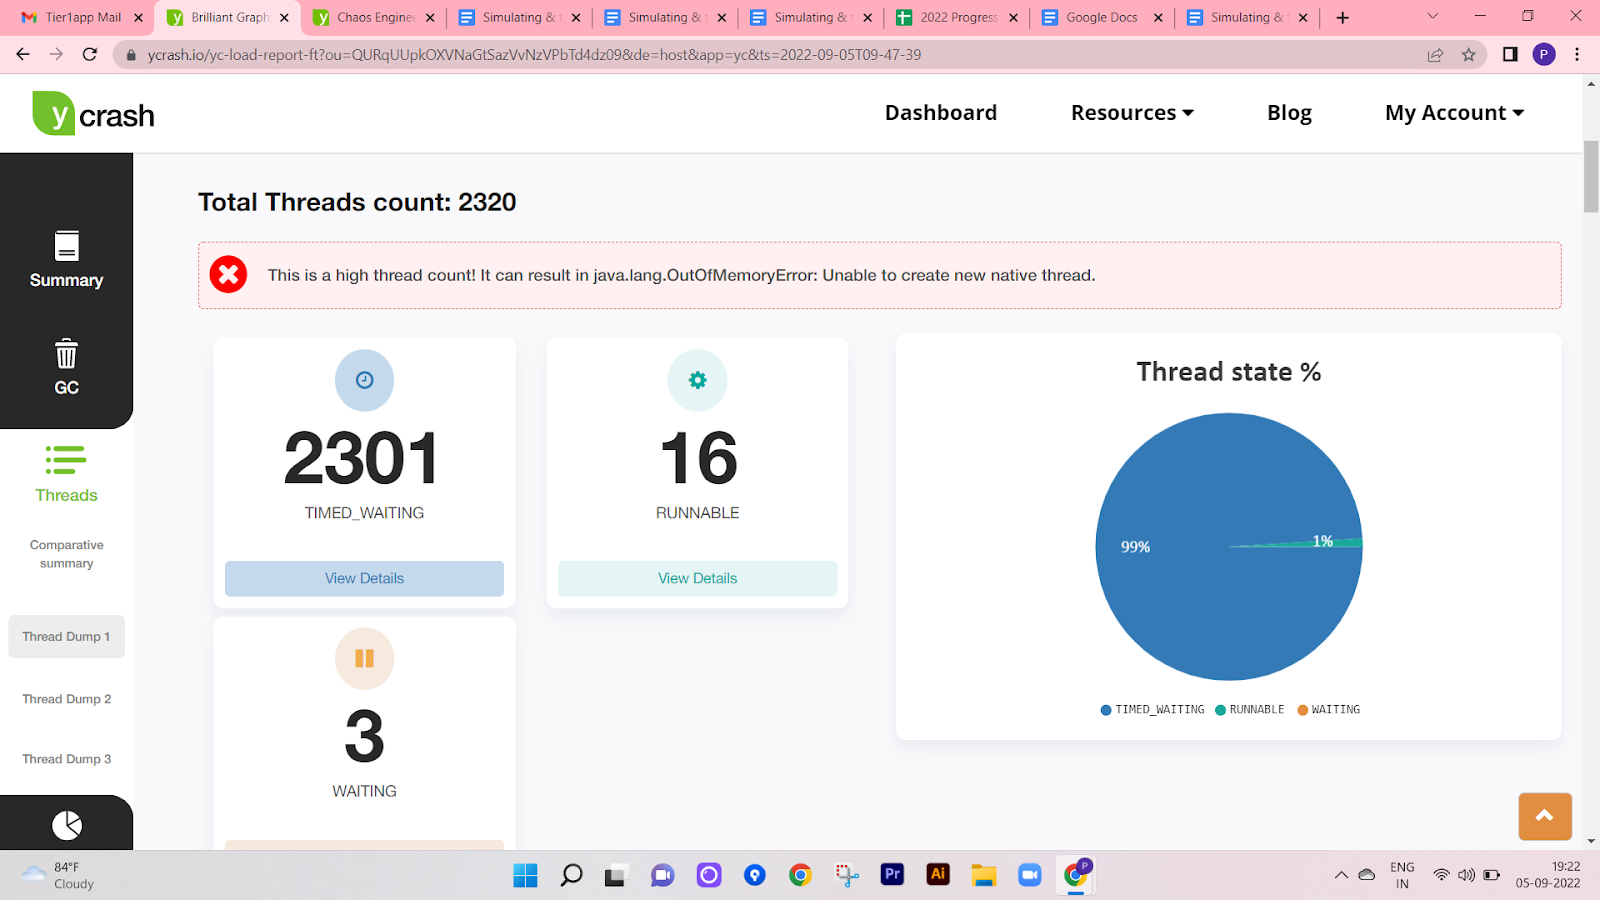
We used the automated approach. Below is the root cause analysis report generated by the yCrash tool highlighting the source of the problem.

Fig: yCrash reporting 2,300+ are created, and they can cause OutOfMemoryError: unable to create new native thread

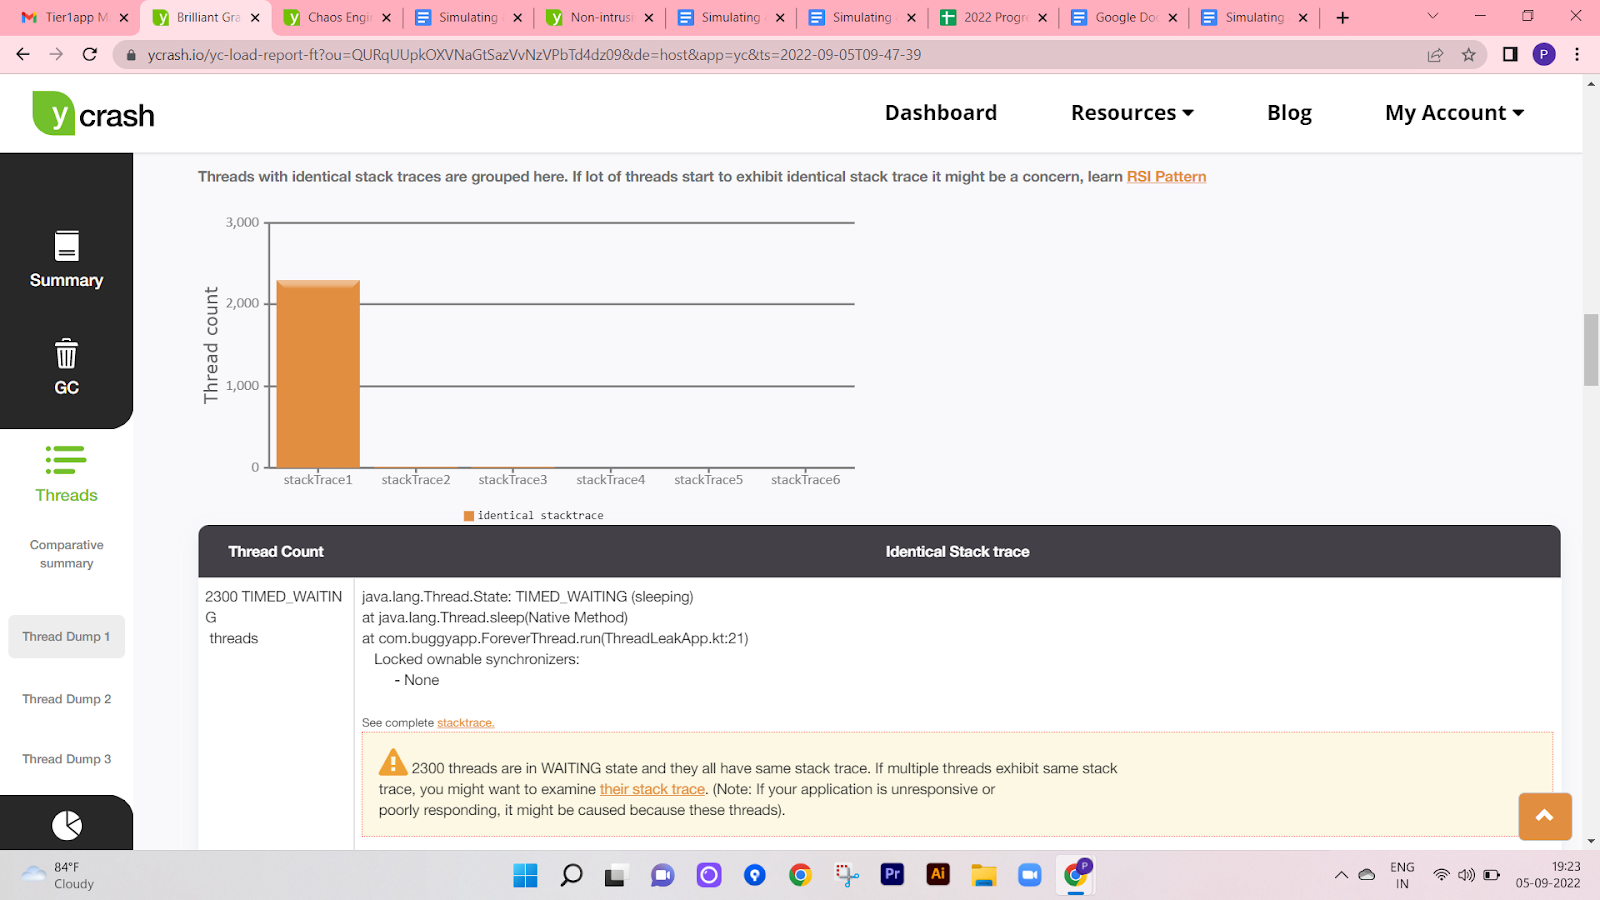
Fig: yCrash reporting the exact leaking threads
From the report, you can notice that yCrash points out that 2300 threads are in the TIMED_WAITING state, and they have the potential to cause OutOfMemoryError: unable to create new native thread problem. Besides the thread count, the tool is also reporting the exact line of code, i.e., com.buggyapp.ForeverThread.run(ThreadLeakApp.kt:21) in which all the 2300 threads are stuck. Equipped with this information, one can quickly go ahead and fix the java.lang.OutOfMemoryError: unable to create new native thread problem.
Opinions expressed by DZone contributors are their own.

Comments