How to Implement Splunk Enterprise On-Premise for a MuleSoft App
In this article, see how to implement Splunk Enterprise on-premise for a MuleSoft application using Anypoint Studio and Anypoint Platform Runtime Manager.
Join the DZone community and get the full member experience.
Join For FreeWhat Is Splunk?
Splunk is a tool used for logging, analyzing, reporting, visualizing, monitoring, or searching the machine data in real time.
Machine data is information that is generated by a computer process, application, device, or any other mechanism without any active intervention from humans. Machine data is everywhere, and it can be generated automatically from various sources like computer processes, elevators, cars, smartphones, etc., and generally, such data is generated in forms of events in an unstructured form.
Splunk is capable of searching, reporting, visualizing, logging, or monitoring any type of data including structured and unstructured data.
Splunk Main Components
Splunk Search Heads
Splunk Search Head is a Splunk instance that distributes searches across the indexers.
Splunk Indexers
Indexers are a Splunk component used to index and store incoming data from forwarders. Splunk instances transform the incoming data into events and stores them into indexes to perform search operations efficiently.
Splunk Forwarders
Forwarders are used to collect the data from various sources in a secure, reliable way and forward data to Splunk for indexing and analysis.

Splunk Deployments
Splunk Enterprise
Splunk can be deployed and administered on-premise.
Splunk Cloud
Splunk Cloud is a SaaS (Software as a Service) platform for operational intelligence and enterprise as a scalable service. No infrastructure is required.
Splunk Light
Splunk Light is the solution for small scale IT environments.
You may also like: Java Applications Log Message Analytics Using Splunk
Download and Install Splunk Enterprise On-Premise
For installing the Splunk on-premise or on your machine, you need to navigate to Splunk Free download and create an account by filling out a form. Click here to start downloading for free.
There are 2 options: either you can download an on-premise Splunk Enterprise trial for 60 days or a Splunk Cloud trial for 15 days.
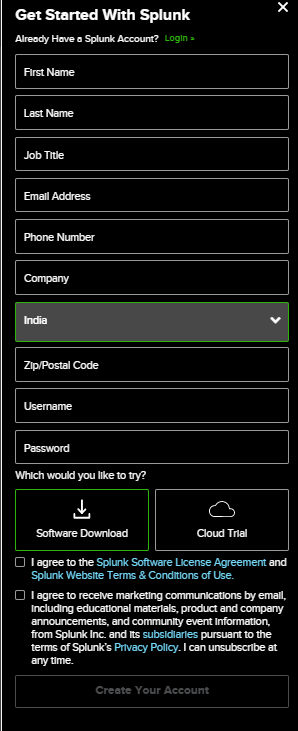
Once you create a Splunk account, it will give you the option to download Splunk Enterprise and Splunk Cloud.
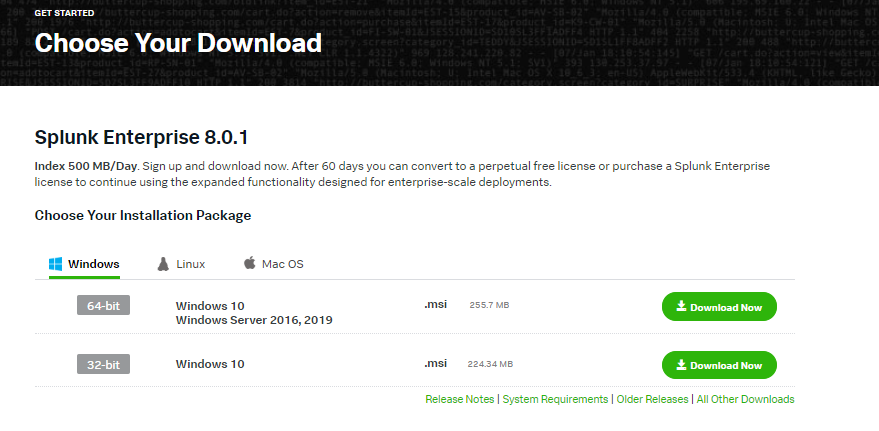
For this article, we will be downloading Splunk 8.0.1 Windows 64-Bit, and it will download splunk-8.0.1-x64-release.msi and simply run the msi. This will start installing Splunk on your machine, and during the installation process, you need to create a password for admin users and you can select local accounts during installation. For windows, it will create windows services “Splunkd Service.”

Once the Splunk is installed, you can browse to http://localhost:8000, and it will navigate you to Splunk Web GUI.
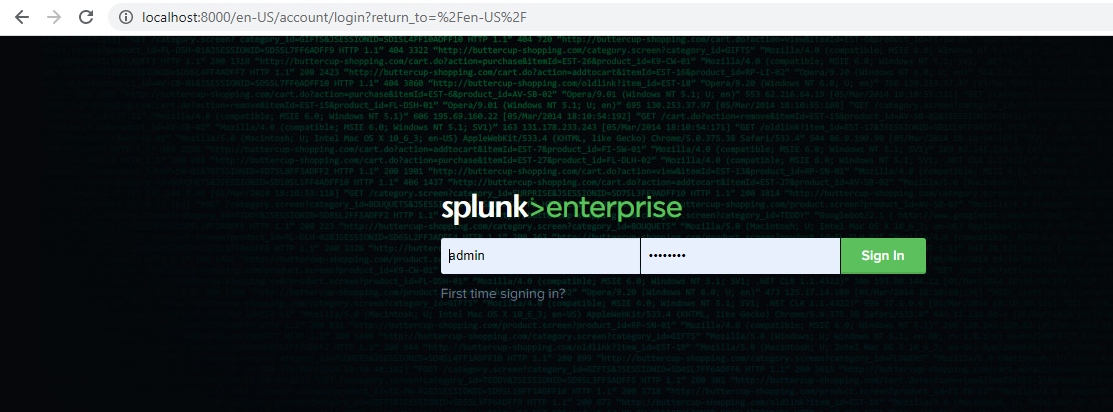
To Login into Splunk, you need to provide username “admin” and password that you have created during installation.

Creating HTTP Event Collector Token
The HTTP Event Collector (HEC) lets you send data and application events to a Splunk deployment over the HTTP and Secure HTTP (HTTPS) protocols. HEC uses a token-based authentication model.
For creating tokens, navigate to Settings → Data inputs → HTTP Event Collector.
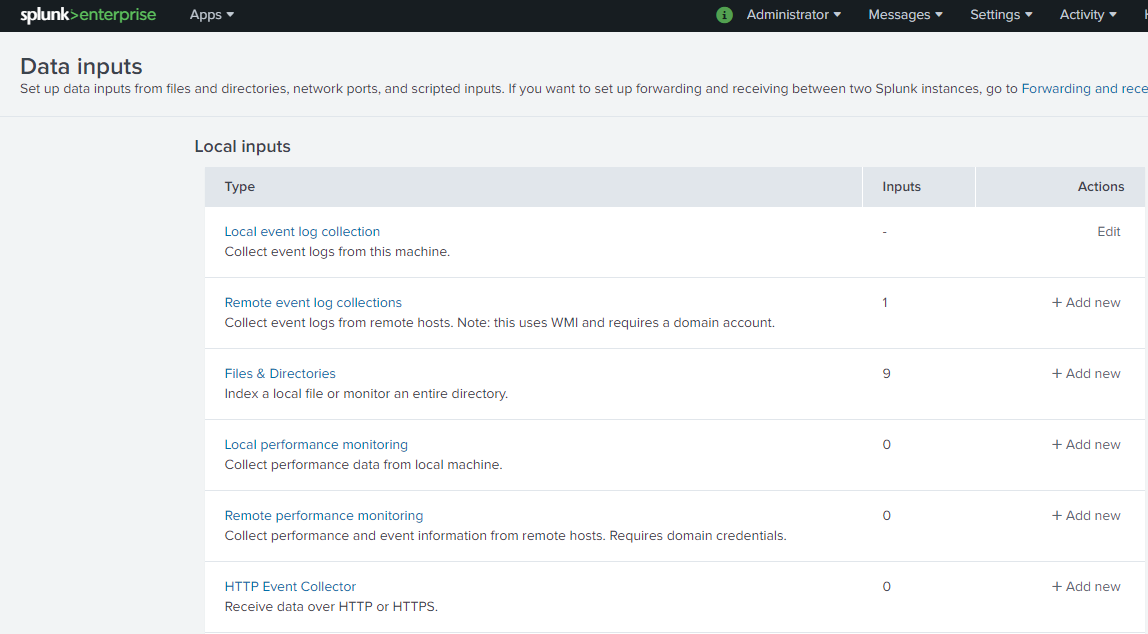
Once you select the HTTP Event Collector, it will navigate you to the screen from where you can create a New Token. Click on the New Token button.

Once you click on the New Token button, it will navigate to form and start filling out the details like Name. Click on Next at the top of the web page for filling further details.
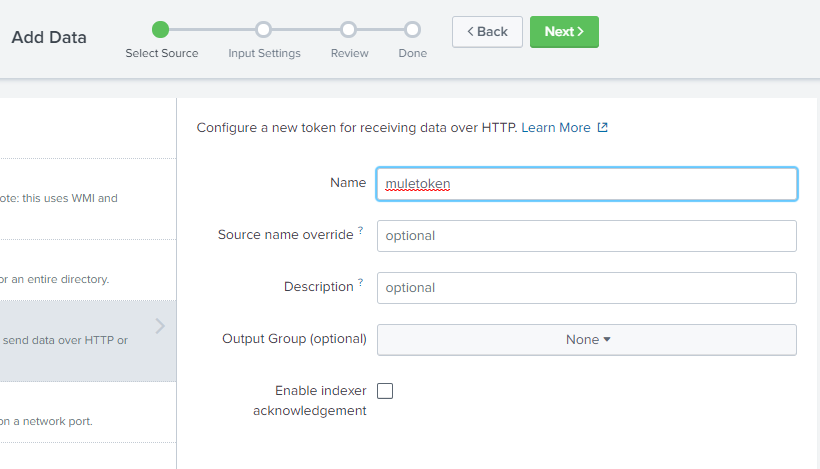
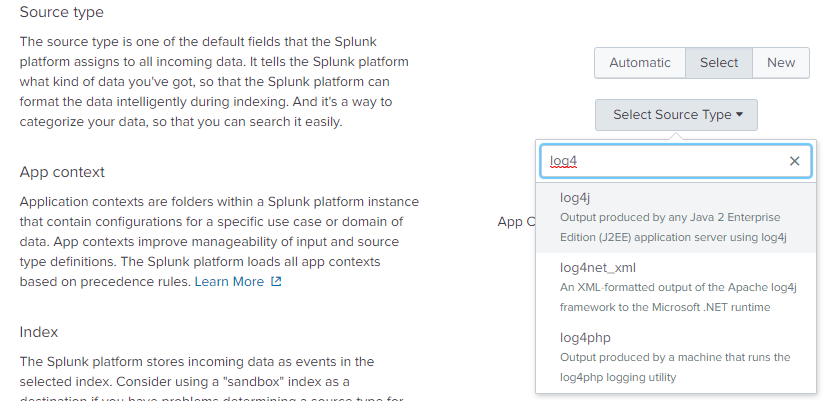
On the next screen, you can select SourceType as log4j, as we will be using log4j as a source for sending data to Splunk from the MuleSoft application.
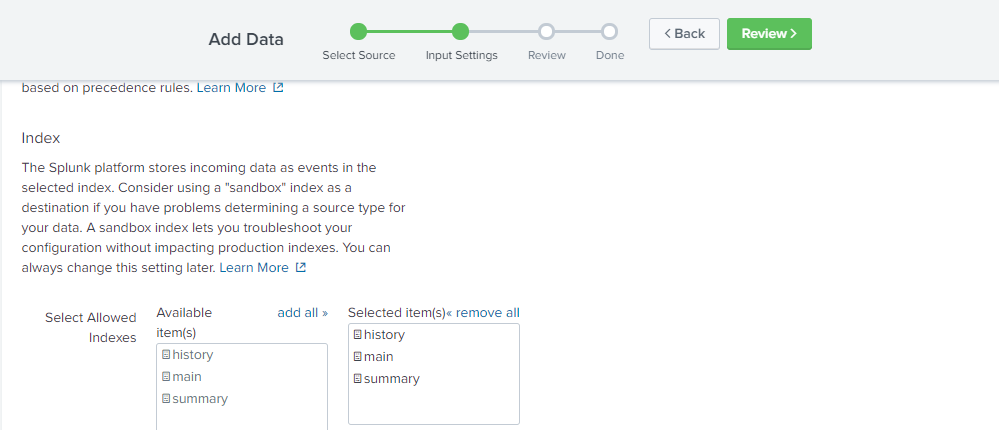
On the same screen, select all index main, summary, and history.
Now click on the Review button on top of the screen. Finally, review the details and click on Submit Button.
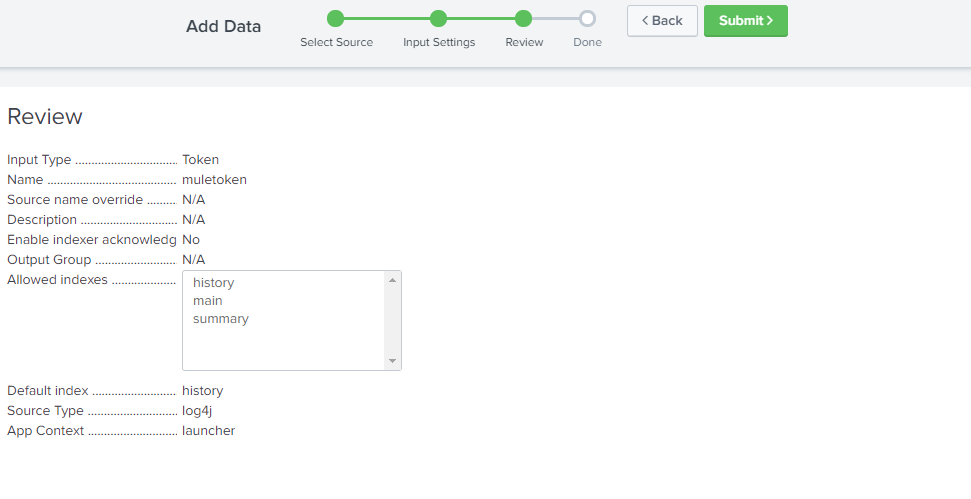
Once you click on the Submit button, it will create a token that we will be using for authentication purposes.
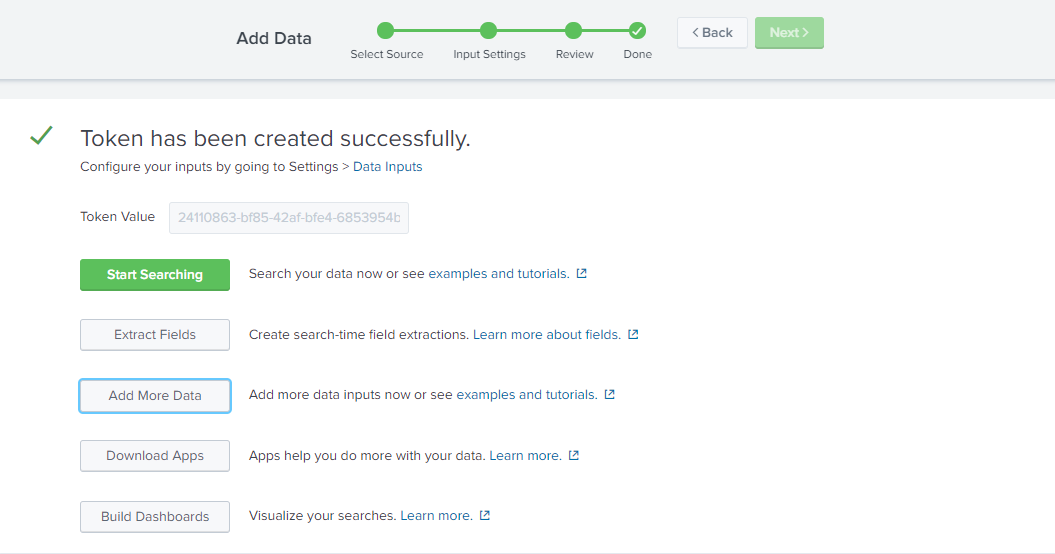
You can again navigate to Settings → Data inputs → HTTP Event Collector to see the newly created token.

Also, make sure that token is enabled. In case it is not enabled, you can click on Global Settings and enable the token as shown in the below screenshot.
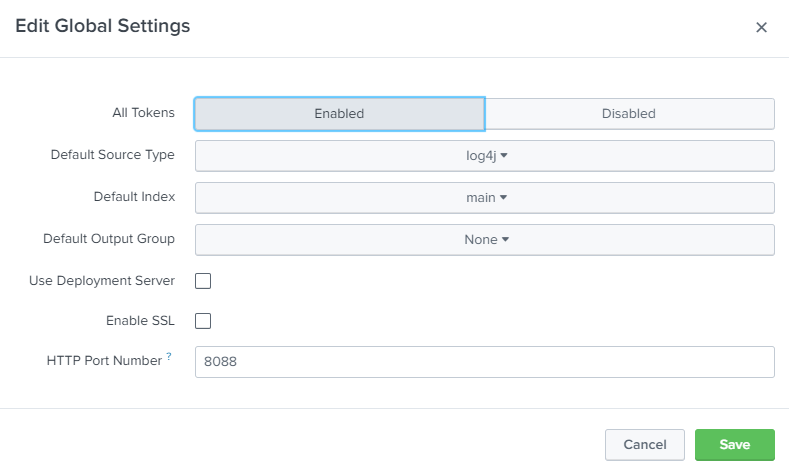
Also, notice the HTTP Port Number 8088 and it will be required for sending logs from the application to Splunk. We will be using URL http://localhost:8088 and the token that we have created above for sending logs to Splunk from the MuleSoft application.
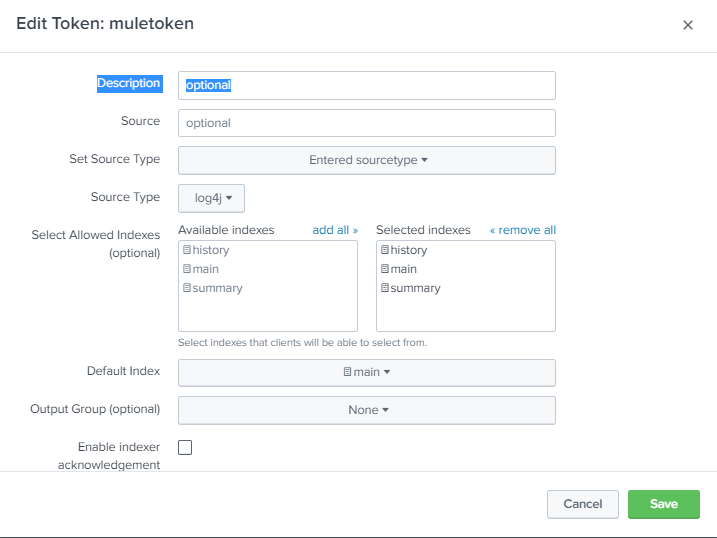
Edit the Token and select Default Index as main.
Setting Up Mail Server on Splunk
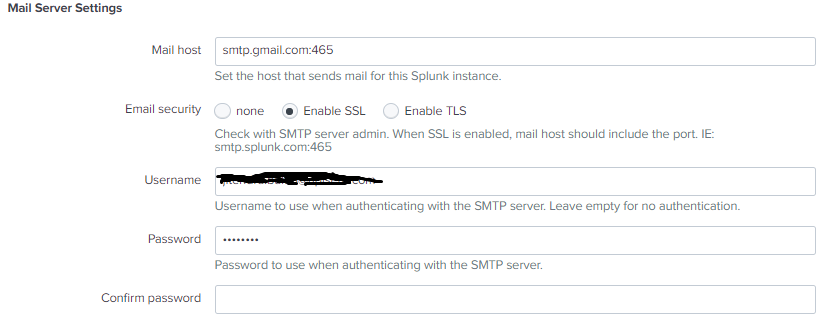
For setting up a mail server, navigate to Settings → Server Settings → Mail Server Settings.
You need to provide Mail host, username, and password. If you are using smtp.gmail.com, use port number 465 for SSL and 587 for TLS.
You can define email format in Mail Server Settings, and we will keep the default for this article. Click Save.
Integrating MuleSoft Application With Splunk Enterprise Using Anypoint Studio
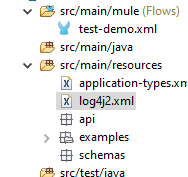
For integrating a MuleSoft application with Splunk, we will be adding HttpAppender in log4j2.xml located at src/main/resources
xxxxxxxxxx
<Appenders>
<Http name="Splunk" url="http://localhost:8088/services/collector/raw">
<Property name="Authorization" value="Splunk 42e1dcf7-6e14-4a1b-8485-c5fa15edb47d" ></Property>
<PatternLayout pattern="[%d{MM-dd HH:mm:ss}] %-5p %c{1} [%t]: %m%n"></PatternLayout>
</Http>
</Appenders>
For connecting to Splunk from a MuleSoft application, you need to provide the URL where we will be sending logs to Splunk. In our case, the URL is “http://localhost:8088/services/collector/raw”, and you need to add an authorization property and value Token we have created above with Prefix Splunk.
We need to define loggers in log4j2.xml.
xxxxxxxxxx
<AsyncRoot level="INFO">
<AppenderRef ref="Splunk" ></AppenderRef>
</AsyncRoot>
Also, make sure AppenderRef matches the name of HTTP Appender.
xxxxxxxxxx
<Configuration status="INFO" name="cloudhub"
packages="com.splunk.logging,org.apache.logging.log4j">
<Appenders>
<Http name="Splunk" url="http://localhost:8088/services/collector/raw">
<Property name="Authorization" value="Splunk 24110863-bf85-42af-bfe4-6853954b6ba6" ></Property>
<PatternLayout pattern="[%d{MM-dd HH:mm:ss}] %-5p %c{1} [%t]: %m%n" ></PatternLayout>
</Http>
</Appenders>
<Loggers>
<logger name="httpclient.wire">
<level value="debug" ></level>
</logger>
<AsyncRoot level="INFO">
<AppenderRef ref="Splunk" ></AppenderRef>
</AsyncRoot>
<AsyncLogger name="com.gigaspaces" level="ERROR" ></AsyncLogger>
<AsyncLogger name="com.j_spaces" level="ERROR" ></AsyncLogger>
<AsyncLogger name="com.sun.jini" level="ERROR" ></AsyncLogger>
<AsyncLogger name="net.jini" level="ERROR" ></AsyncLogger>
<AsyncLogger name="org.apache" level="WARN" ></AsyncLogger>
<AsyncLogger name="org.apache.cxf" level="WARN" ></AsyncLogger>
<AsyncLogger name="org.springframework.beans.factory"
level="WARN" ></AsyncLogger>
<AsyncLogger name="org.mule" level="INFO" ></AsyncLogger>
<AsyncLogger name="com.mulesoft" level="INFO" ></AsyncLogger>
<AsyncLogger name="org.jetel" level="WARN" ></AsyncLogger>
<AsyncLogger name="Tracking" level="WARN" ></AsyncLogger>
<AsyncLogger name="org.mule.module.http.internal.HttpMessageLogger"
level="DEBUG" ></AsyncLogger>
<AsyncLogger name="com.ning.http" level="DEBUG" ></AsyncLogger>
</Loggers>
</Configuration>
There is a Mulesoft application created that will be logging information, errors, and other information into Splunk.
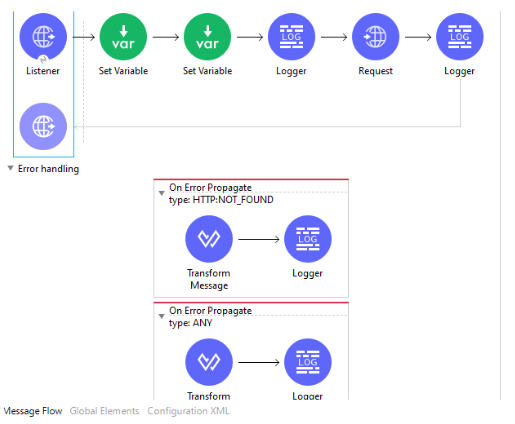
This MuleSoft application will receive a request and send the request to a world time zone API to fetch timezone details.
xxxxxxxxxx
<mule xmlns:edifact="http://www.mulesoft.org/schema/mule/edifact" xmlns:scripting="http://www.mulesoft.org/schema/mule/scripting"
xmlns:kafka="http://www.mulesoft.org/schema/mule/kafka"
xmlns:wsc="http://www.mulesoft.org/schema/mule/wsc" xmlns:sap="http://www.mulesoft.org/schema/mule/sap" xmlns:ee="http://www.mulesoft.org/schema/mule/ee/core" xmlns:db="http://www.mulesoft.org/schema/mule/db" xmlns:http="http://www.mulesoft.org/schema/mule/http" xmlns="http://www.mulesoft.org/schema/mule/core" xmlns:doc="http://www.mulesoft.org/schema/mule/documentation" xmlns:xsi="http://www.w3.org/2001/XMLSchema-instance" xsi:schemaLocation="http://www.mulesoft.org/schema/mule/core http://www.mulesoft.org/schema/mule/core/current/mule.xsd
http://www.mulesoft.org/schema/mule/http http://www.mulesoft.org/schema/mule/http/current/mule-http.xsd
http://www.mulesoft.org/schema/mule/db http://www.mulesoft.org/schema/mule/db/current/mule-db.xsd
http://www.mulesoft.org/schema/mule/ee/core http://www.mulesoft.org/schema/mule/ee/core/current/mule-ee.xsd
http://www.mulesoft.org/schema/mule/sap http://www.mulesoft.org/schema/mule/sap/current/mule-sap.xsd
http://www.mulesoft.org/schema/mule/wsc http://www.mulesoft.org/schema/mule/wsc/current/mule-wsc.xsd
http://www.mulesoft.org/schema/mule/kafka http://www.mulesoft.org/schema/mule/kafka/current/mule-kafka.xsd
http://www.mulesoft.org/schema/mule/scripting http://www.mulesoft.org/schema/mule/scripting/current/mule-scripting.xsd
http://www.mulesoft.org/schema/mule/edifact http://www.mulesoft.org/schema/mule/edifact/current/mule-edifact.xsd">
<http:listener-config name="HTTP_Listener_config" doc:name="HTTP Listener config" doc:id="c498279f-ca24-4a46-999a-64b662cb2adf" >
<http:listener-connection host="0.0.0.0" port="8082" ></http:listener>
</http:listener-config>
<http:request-config name="HTTP_Request_configuration" doc:name="HTTP Request configuration" doc:id="b3f4b64e-a5d9-47d4-9a97-385b13338d1d" basePath="/api/timezone" >
<http:request-connection host="worldtimeapi.org" ></http:request>
</http:request-config>
<edifact:config name="EDIFACT_EDI_Config" doc:name="EDIFACT EDI Config" doc:id="24fa248b-732a-456c-95e8-8f0e47db74e5" ></edifact:config>
<flow name="Splunk_POC" doc:id="deb4fc3a-cd56-44ce-9331-f127cdb55e7a" >
<http:listener doc:name="Listener" doc:id="bf3535c5-c649-430d-b4f0-7c0573b78586" config-ref="HTTP_Listener_config" path="/timezone/{region}/{city}" allowedMethods="GET">
<http:error-response statusCode="#[vars.httpStatusCode]" >
<http:body ><![CDATA[#[payload]]]></http:body>
</http:error-response>
</http:listener>
<set-variable value="#[attributes.uriParams.region]" doc:name="Set Variable" doc:id="2c0068e9-454d-4262-8b06-5164b4882beb" variableName="region"></set>
<set-variable value="#[attributes.uriParams.city]" doc:name="Set Variable" doc:id="c655e67a-19d2-47a4-b8b4-27dbfc78eaac" variableName="city"></set>
<logger level="INFO" doc:name="Logger" doc:id="98e05fb8-9815-4a8a-9ed5-02ab75c457f6" message="#[payload]"></logger>
<http:request method="GET" doc:name="Request" doc:id="a0c6b2e0-6f0b-40ea-ae79-f4c2c34253ae" config-ref="HTTP_Request_configuration" path="/{region}/{city}">
<http:uri-params><![CDATA[#[output application/java
---
{
city : vars.city,
region : vars.region
}]]]></http:uri-params>
</http:request>
<logger level="INFO" doc:name="Logger" doc:id="6644e958-16c4-4d61-8546-4247d4f4389e" message="#['Process Completed']"></logger>
<error-handler >
<on-error-propagate enableNotifications="true" logException="true" doc:name="On Error Propagate" doc:id="18fc98f5-2072-4d4f-ba53-2b907533b1d6" type="HTTP:NOT_FOUND">
<ee:transform doc:name="Transform Message" doc:id="a3a33b85-44fa-4bac-a07f-0f2079d51c69" >
<ee:message >
<ee:set-payload ><![CDATA[%dw 2.0
output application/json
---
{
message:error.description
}]]></ee:set-payload>
</ee:message>
<ee:variables >
<ee:set-variable variableName="httpStatusCode" ><![CDATA[404]]></ee:set-variable>
</ee:variables>
</ee:transform>
<logger level="ERROR" doc:name="Logger" doc:id="fc850af2-b9a1-4131-8399-e579fb6f8b24" message="#[payload]"></logger>
</on-error-propagate>
<on-error-propagate enableNotifications="true" logException="true" doc:name="On Error Propagate" doc:id="aca640dd-26c8-4105-aaec-4fe857a5e8ee" type="ANY">
<ee:transform doc:name="Transform Message" doc:id="aedd383a-c841-4441-a4da-8a5f2e4e8eab" >
<ee:message >
<ee:set-payload ><![CDATA[%dw 2.0
output application/json
---
{
message:error.description
}]]></ee:set-payload>
</ee:message>
<ee:variables >
<ee:set-variable variableName="httpStatusCode" ><![CDATA[500]]></ee:set-variable>
</ee:variables>
</ee:transform>
<logger level="ERROR" doc:name="Logger" doc:id="76af331a-5bdd-468f-8d69-9a92279075dd" message="#[payload]"></logger>
</on-error-propagate>
</error-handler>
</flow>
</mule>
Once you have started the Mule application and have sent the request, it will start logging events into Splunk.
Searching Events With Splunk
For viewing the events, you can go to the Splunk home page and select Search & Reporting.

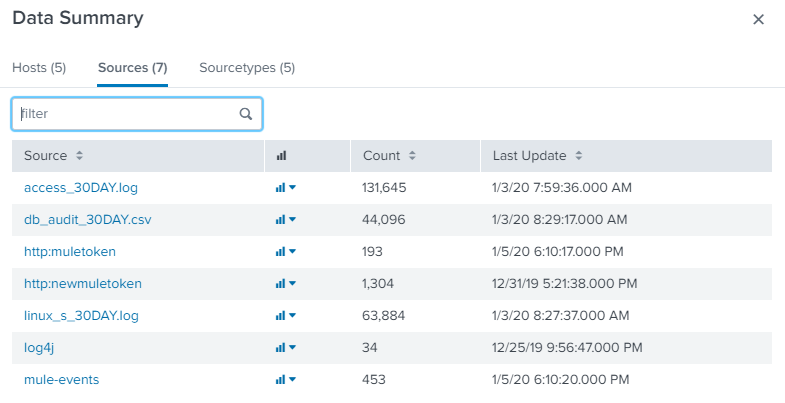
It will navigate you to the search page. On that page, you can use a filter for searching the events and can view a Data Summary. The data summary will show you all the hosts, sources, and source types from where the events are coming from.
These hosts, sources, and source Types can be used to search for events.
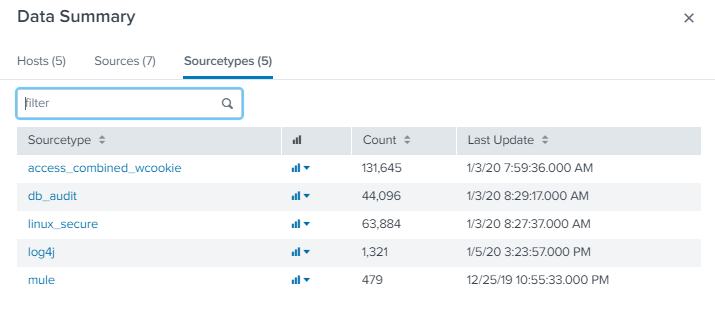
Filter 1: sourceType=log4j for last 24 hours
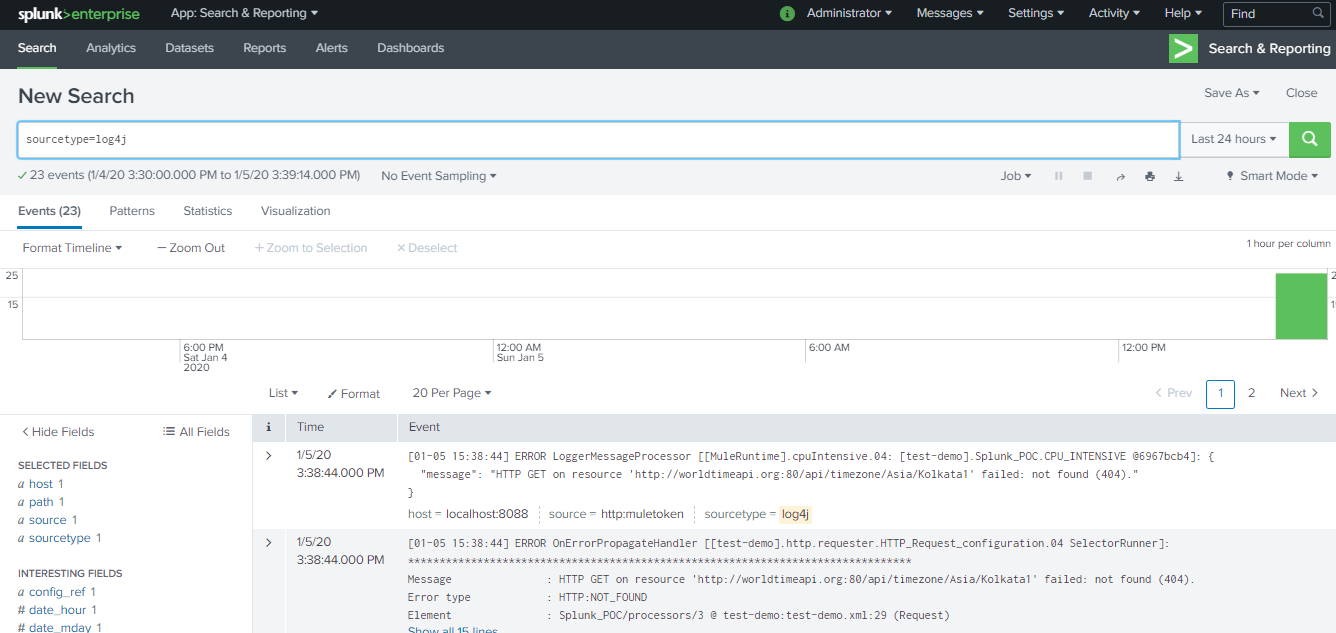
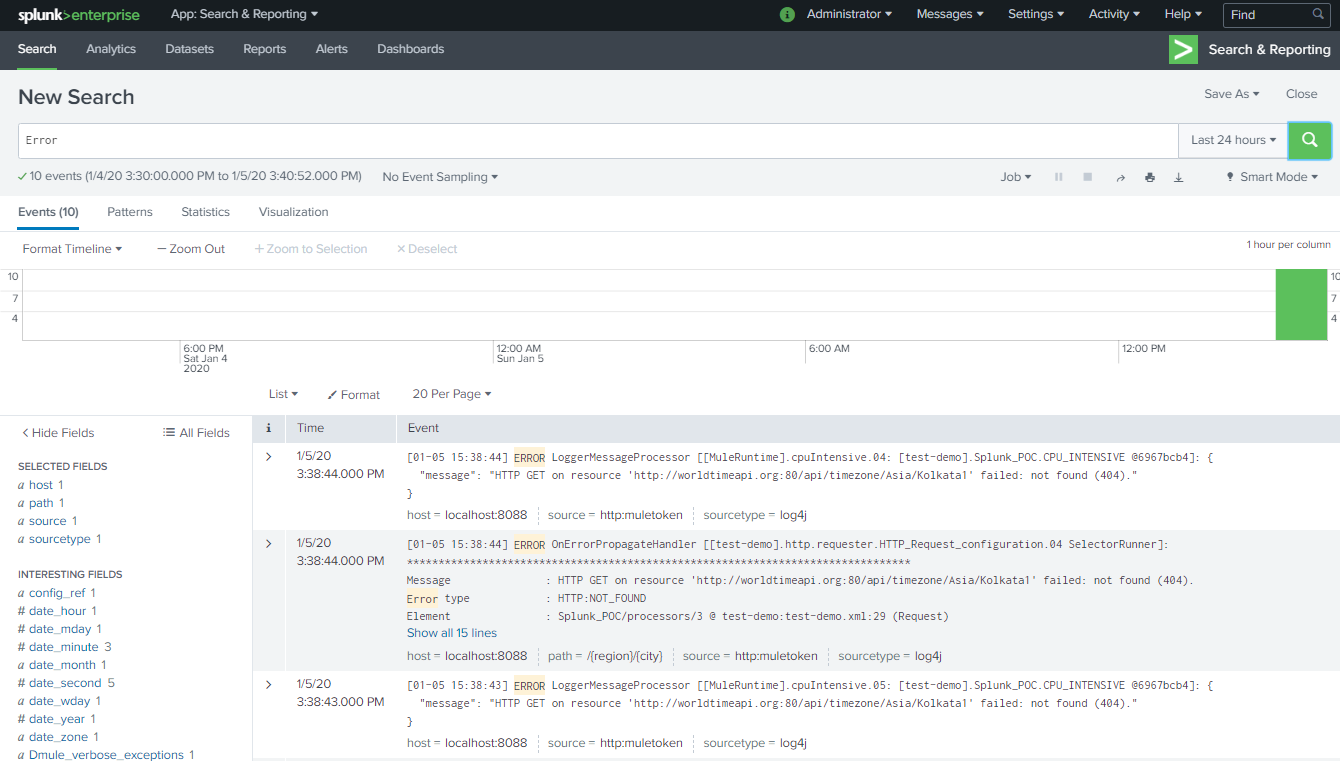
Filter 2: Error in last 24 hours
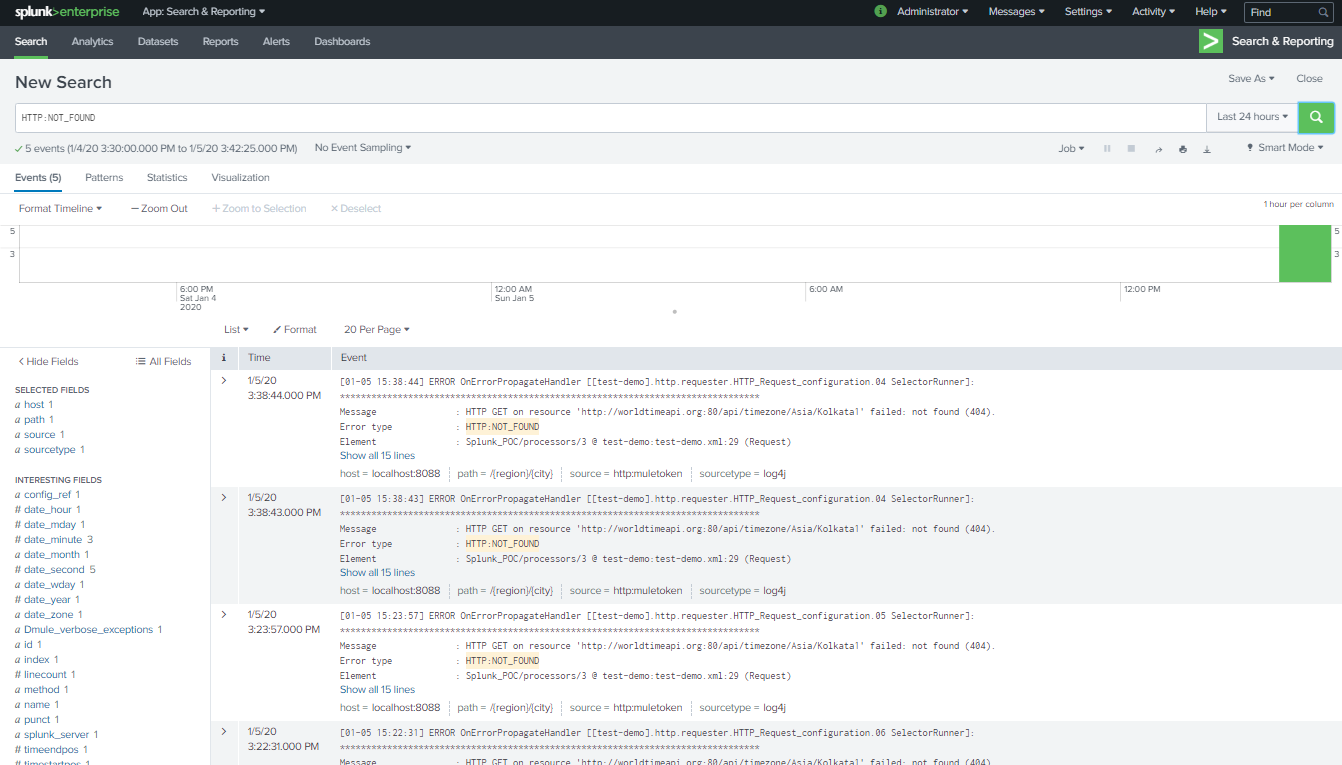
Filter 3: HTTP:NOT_FOUND in Last 24 hours
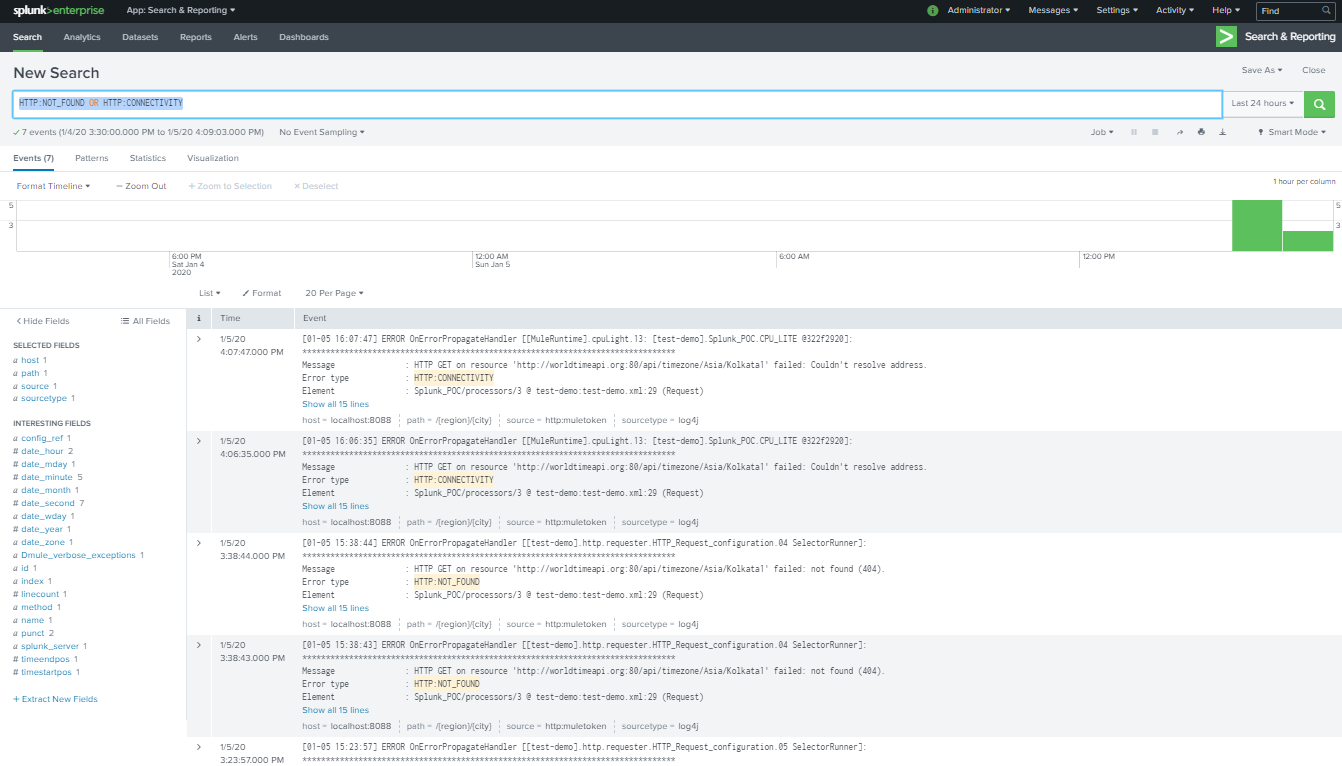
Filter 4: HTTP:NOT_FOUND OR HTTP:CONNECTIVITY in Last 24 hours
Integrating MuleSoft Application With Splunk Enterprise Using Anypoint Platform and Anypoint Server Group or Cluster
For integrating Splunk Enterprise on-premise with Anypoint Server Group or Cluster, you need to create a cluster or server group on Anypoint Platform Runtime Manager.
Adding Server on Anypoint Platform Runtime Manager
For adding a server to Anypoint Platform Runtime Manager, navigate to Runtime Manager → Servers → Add Servers.

Once you click on Add Servers, it will give the command that you need to run on your machine to cd into /bin folder of Mule runtime.

After running the command, you will see the server will be added to Anypoint Platform runtime manager, and it will be a deployed agent on your local machine under /conf folder. Agent details can be found in mule-agent.yml. This will establish secure communication between Anypoint Platform Runtime Manager and your local machine Mule runtime.

Creating Server Group
For creating a server group on Anypoint Runtime Manager, navigate to Runtime Manager → Servers → Create Group.
Define the group name and add the servers that you need in that server group. To add a server into a group, it must be in a running state. Click Create Group, and it will create a server group.
You can add more than one server into Server Group.
Deploying MuleSoft Application to Server Group
For deploying an application to the server group, navigate to Runtime Manager → Applications → Deploy application
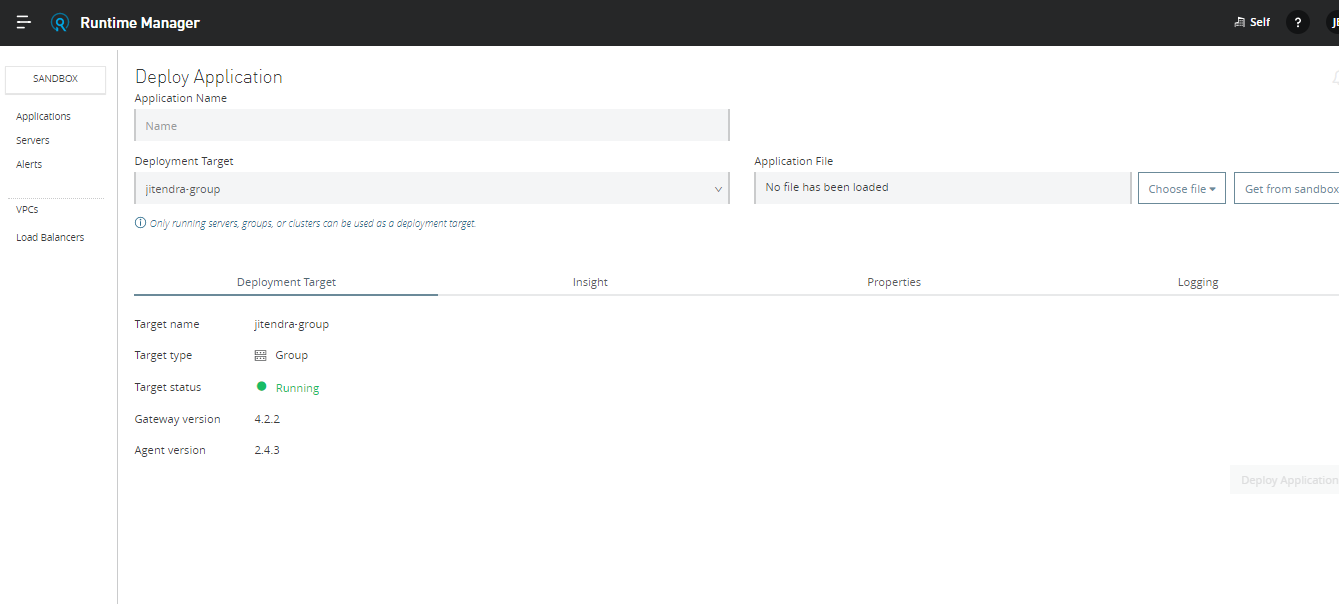
For deploying the application to a server group, you need to select Deployment Target as your server Group Name (in this case, it is jitendra-group). Click on Deploy Application. This will deploy applications to all the servers within that particular server group.
Enabling Splunk on Server Group Using Anypoint Runtime Manager
For enabling Splunk on Server Group, navigate to Runtime Manager → Servers → Click on your server group → Manage Group
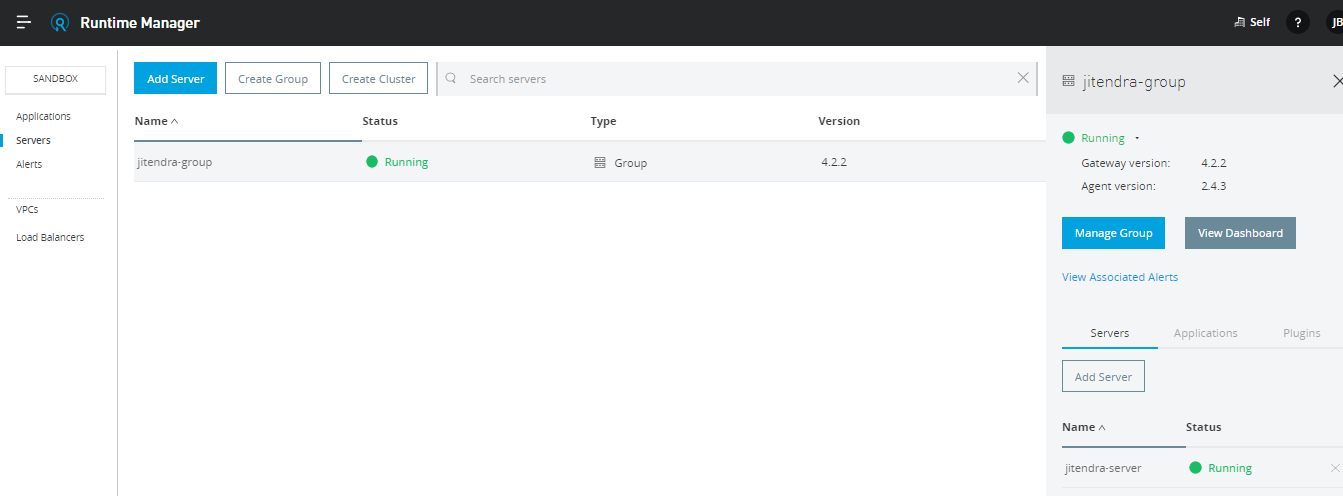
After clicking on Manage Group, click on the Plugins tab and you will see Splunk and ELK plugin.

Click on the Setting icon in front of Splunk to configure it.
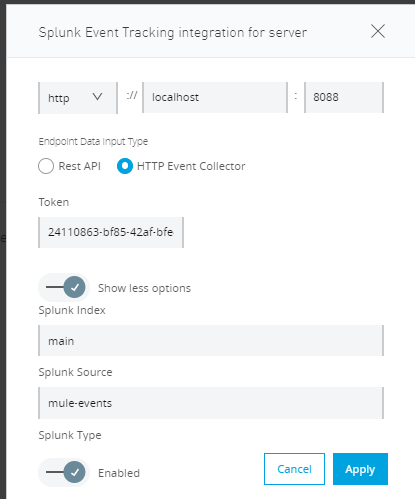
Configure Splunk Event Tracking as shown above in the screenshot.
You need to provide the host and port number of Splunk. In our case, the port number is 8088, and the Token is what we have created at the top of article.
Splunk Source is mule-events and it will be useful for searching events coming from Anypoint Runtime Manager. Click Apply.
This tracking will be applicable for all applications deployed within this server group.
We will be executing an application deployed on the server group and it will start logging the data into Splunk, which can be used for generating alerts, reporting, visualizing, troubleshooting, and analytics.
Now you can see the new Source=mule-events and sourceType=mule have been added to the data summary.
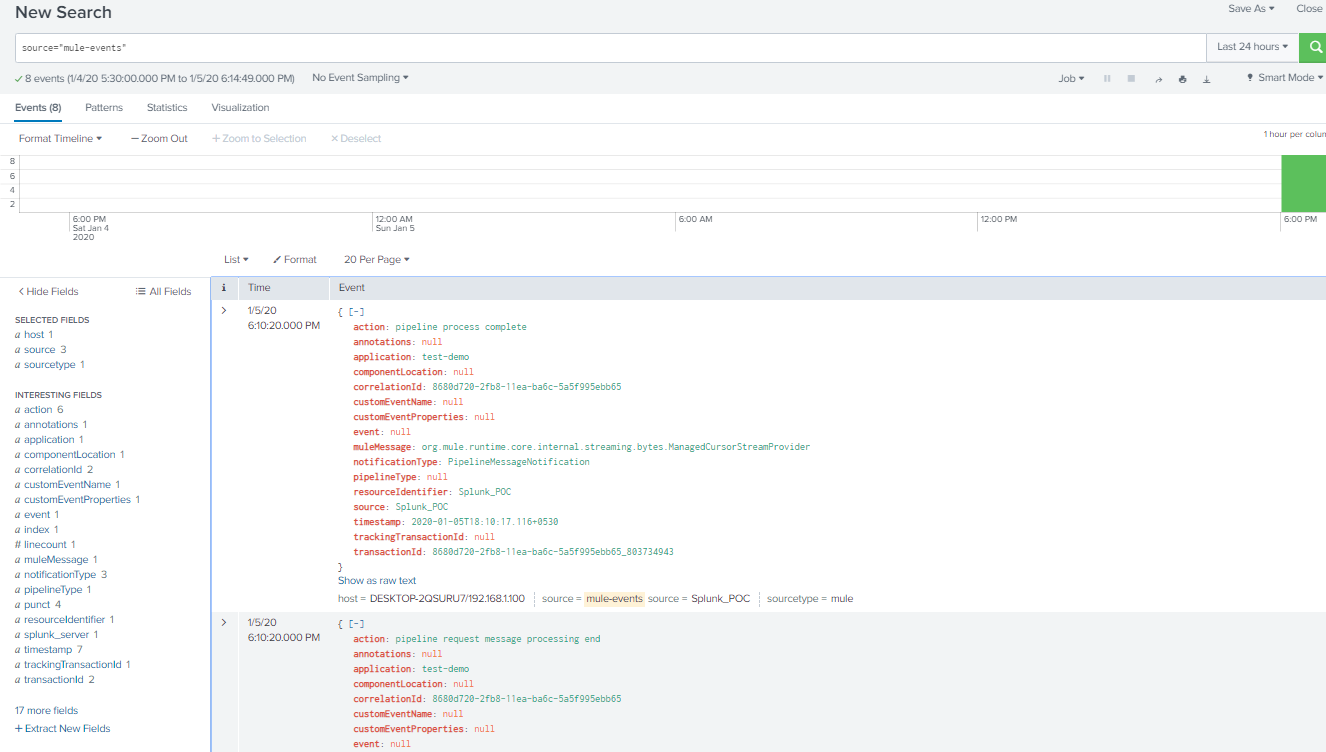
Filter sourceType=mule in last 24 hours
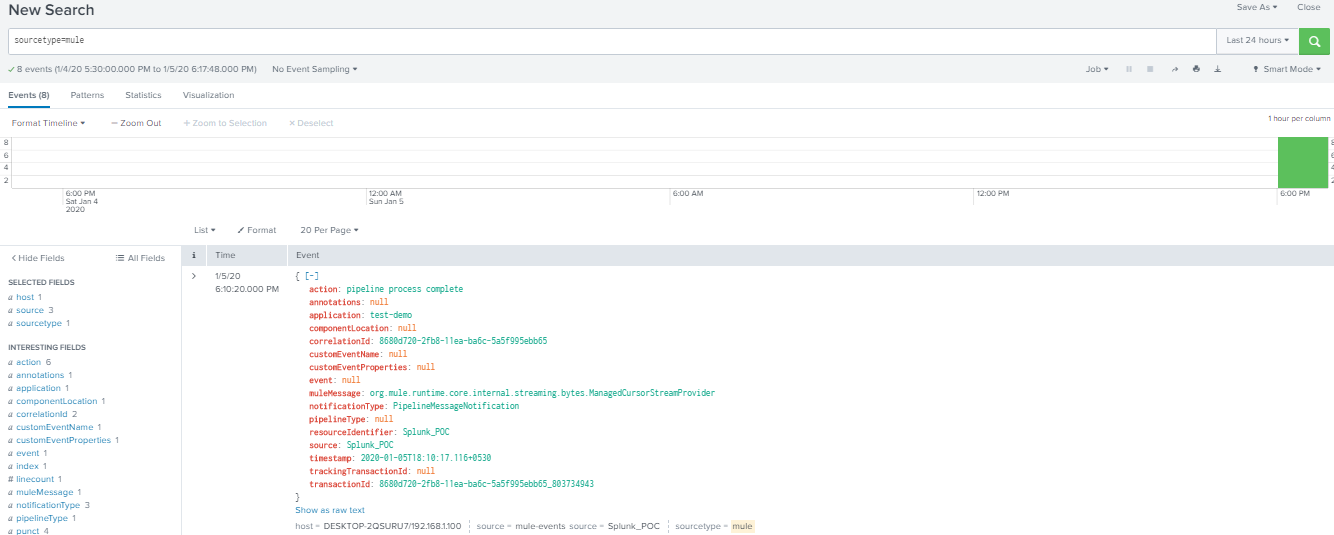
Similarly, you can enable Splunk logging for servers under the cluster.
Generating the Reports and Email Alerts With Splunk
There are default reports available in Splunk. To view reports, navigate to Settings → Searches, reports, and alerts.
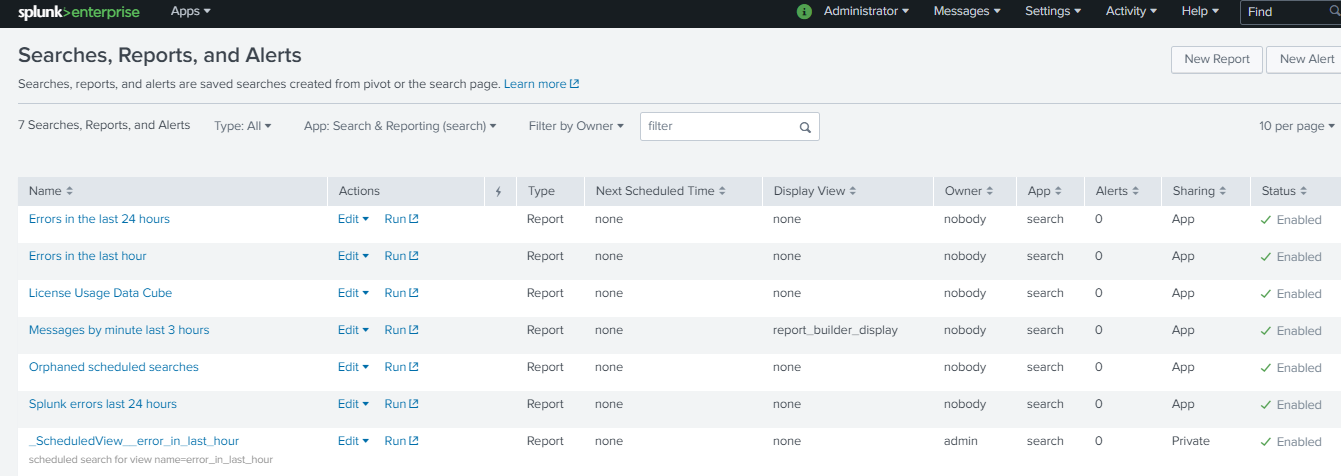
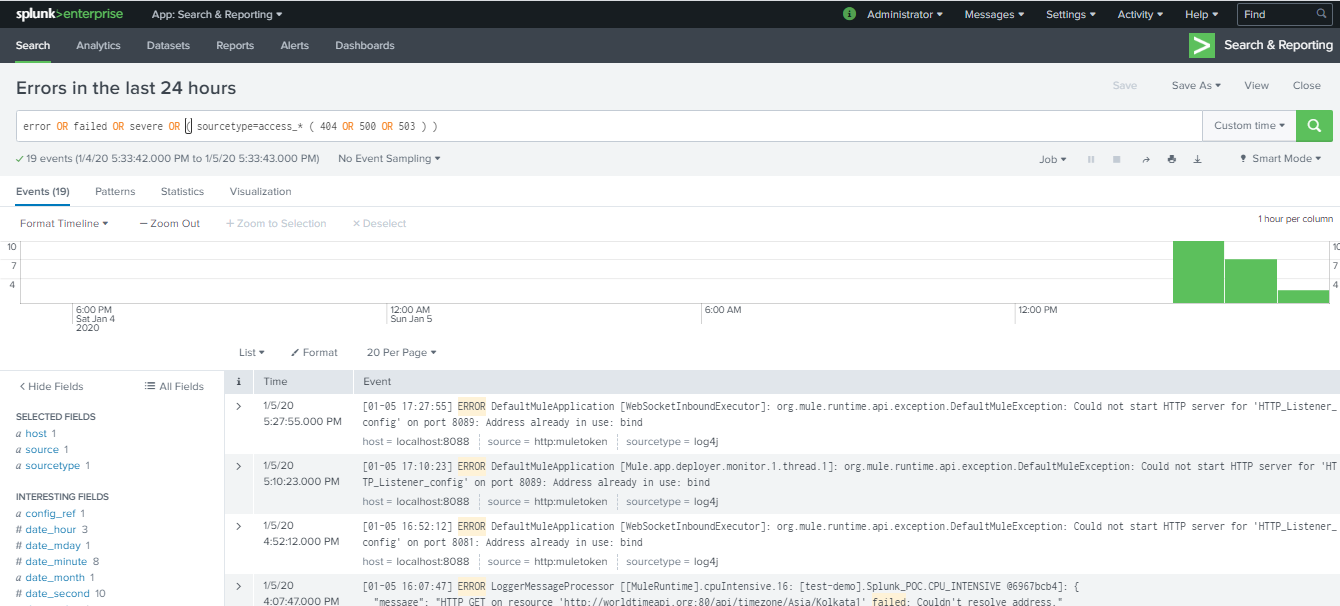
We will run Errors in the last 24 hours report by clicking on run. This will show all the errors or exceptions that occurred in the last 24 hours.
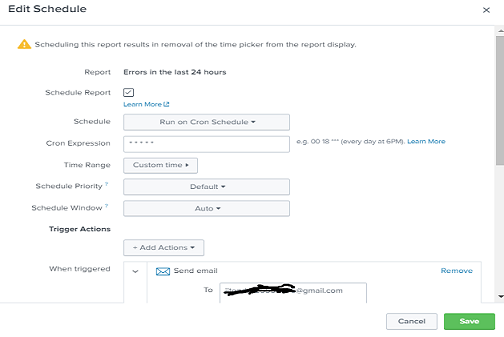
For scheduling the report, click on Edit → Edit Schedule.

Once you've clicked on Edit Schedule, it will open a pop-up window and start filling the details like schedule, CRON expression, and Triggered Actions (send email) as shown in the below screenshot. Click Save.
Another way of scheduling PDF: Navigate To Splunk Homepage → Search & Reporting → Reports

Click on Errors in the last 24 hours → Add to dashboard.

It will open a pop-up and fill in the Dashboard title. Click Save.
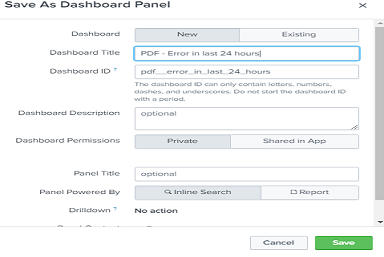
Once saved, it will open a pop-up window. Click on View Dashboard.

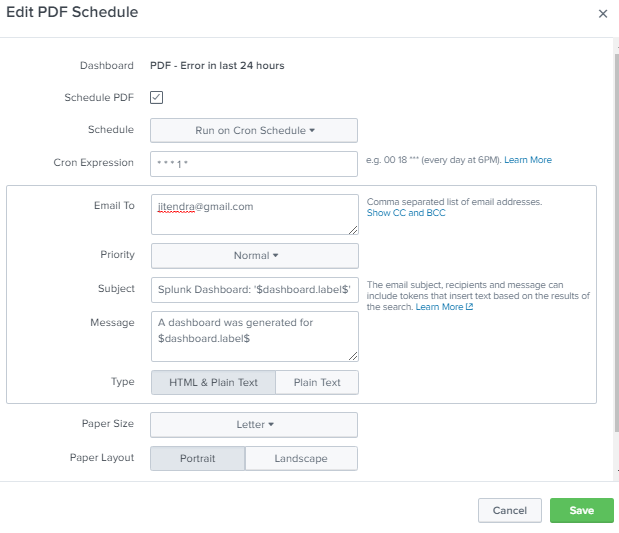
Now click on Export → Schedule PDF Delivery.
This will open a pop-up window, and you can schedule a PDF delivery. We have set up a CRON scheduler to run reports every one minute, and this will send an email every one minute with all errors that occurred in the last 24 hours. Click Save.
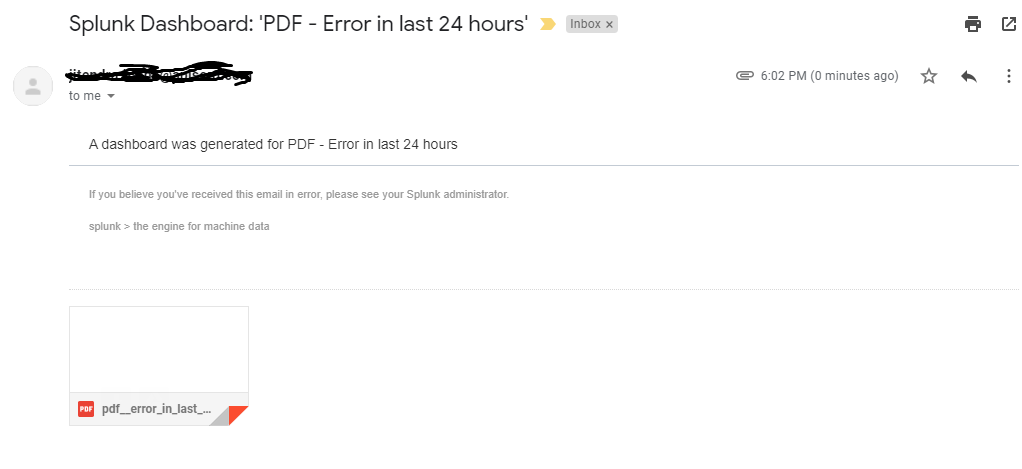
Sample Email Received
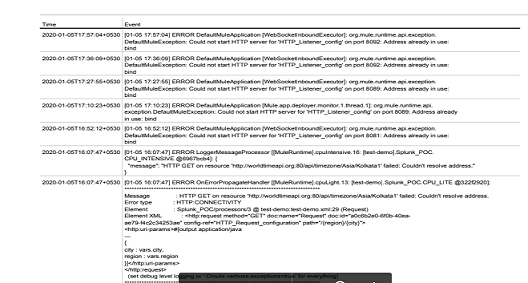
Sample Error PDF
Conclusion
Splunk is a very useful and powerful tool for logging, analyzing, reporting, searching, and visualizing events and data. MuleSoft provides the capability to easily integrate Splunk using Anypoint Studio and Anypoint Platform Runtime Manager.
Further Reading
Add Mule 4 Standalone Runtime as On-Premise Server in Anypoint Platform Runtime Manager
Published at DZone with permission of Jitendra Bafna, DZone MVB. See the original article here.
Opinions expressed by DZone contributors are their own.

Comments